
Tag: Amazon Conversions

  • What Amazon’s Rufus Actually Sees in Your Images — And Why It’s Costing You Conversions

    What Amazon’s Rufus Actually Sees in Your Images — And Why It’s Costing You Conversions

    Amazon Rufus AI reading and scanning product images — split screen showing e-commerce product photo and neural network visualization

    Most Amazon sellers still think of product images as a human problem. Good photography, clean backgrounds, bright lighting — all optimized for the eyes of a shopper scrolling through search results. That mental model made sense in 2022. In 2026, it’s costing sellers conversions they can’t even see leaving.

    Amazon’s AI shopping layer — originally called Rufus, rebranded as Alexa for Shopping in May 2026 — does not experience your product images the way a human does. It doesn’t get drawn to beautiful photography. It doesn’t respond to mood or brand aesthetics. It processes your images the way a system processes structured data: extracting objects, reading embedded text, identifying scene contexts, and using all of it to decide whether your product is a credible answer to a shopper’s question.

    That shift from images-as-visuals to images-as-data is the central thing most listing strategies haven’t caught up with. Sellers investing in gorgeous creative but ignoring the machine-readable content within those images are leaving a significant signal gap — one their competitors are starting to close.

    This piece is about closing that gap. We’ll walk through exactly how Amazon’s multimodal AI engine reads your image stack, which image types carry the most weight and why, how Lens Live has turned your catalog photos into visual search inventory, and what a proper Rufus-era image audit actually looks like — from the hero shot to the last A+ module.

    The goal isn’t another “make your images prettier” article. It’s a technical and strategic breakdown of what the AI is actually scoring, what it ignores, and where the real conversion leverage is hiding in your current image stack.

    From Rufus to Alexa for Shopping: What the May 2026 Rebrand Actually Changed
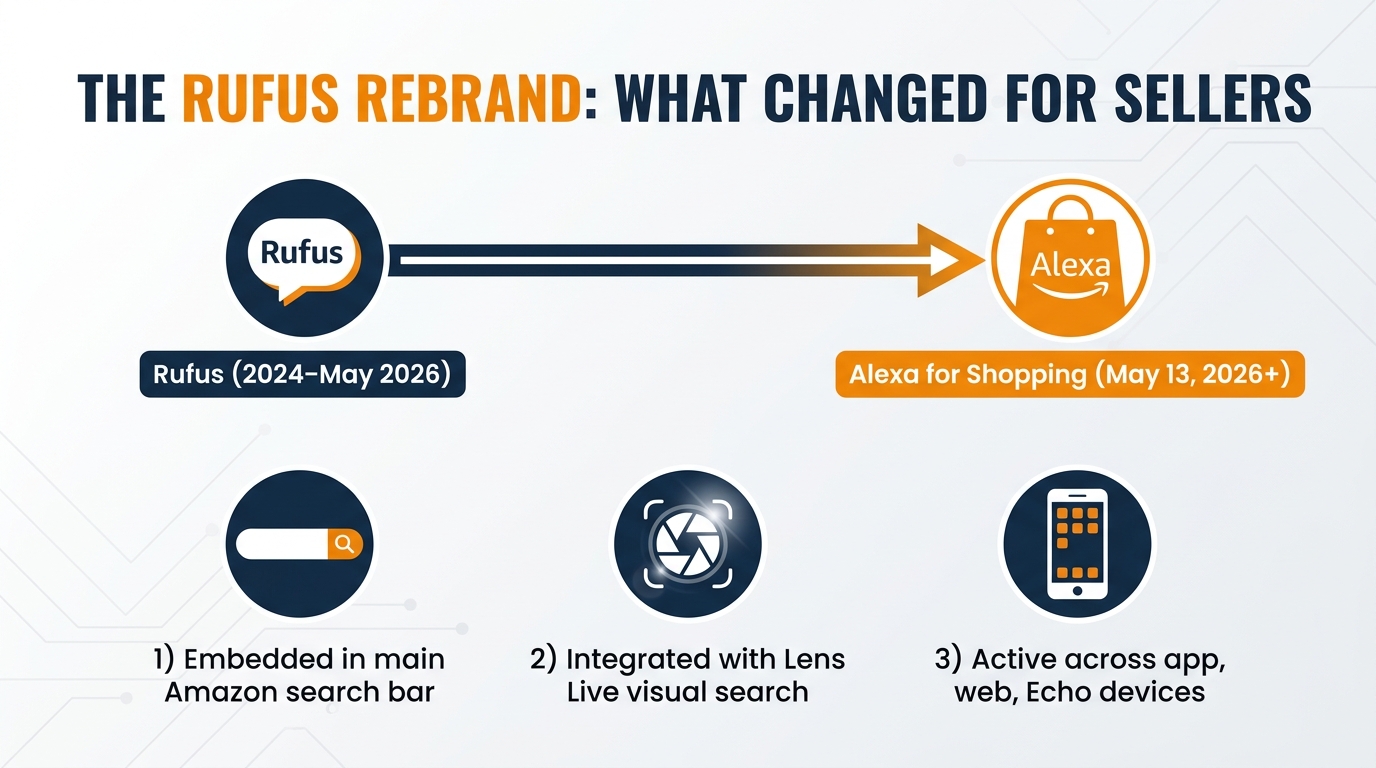
    Infographic timeline showing the evolution from Rufus to Alexa for Shopping in May 2026, with key changes for Amazon sellers

    On May 13, 2026, Amazon officially retired the Rufus brand and replaced it with “Alexa for Shopping” as the default AI layer embedded directly in Amazon’s main search bar. For sellers who’ve been tracking this since Rufus launched in 2024, the name change is less important than the architectural shift that came with it.

    What the Rebrand Actually Means Architecturally

    Rufus as originally deployed lived in a separate chat panel — a discrete box you could open and close while browsing. It was powerful, but it was supplemental. Alexa for Shopping is different in one important way: it is the search bar. For signed-in U.S. users on the Amazon app, every search query now passes through the AI layer first. There is no longer a separate “AI mode” to toggle on. The conversational, multimodal reasoning that used to sit alongside product discovery is now baked into the core of how discovery works.

    The practical implication: Rufus was something a shopper chose to interact with. Alexa for Shopping is something every shopper on the app interacts with whether they intend to or not. That shift in reach changes the stakes considerably. Where Rufus-aware image optimization was a strategic edge, Alexa for Shopping-aware optimization is closer to table stakes.

    The Lens Live Integration

    The rebrand also coincided with Amazon’s official announcement of Lens Live — an on-device computer vision feature embedded in the Amazon Shopping app camera. Where the original Rufus primarily processed text inputs and product data, Lens Live adds a real-time visual dimension: shoppers can point their phone camera at any physical product in the world, and Lens Live will instantly match it against Amazon’s catalog using object detection and deep-learning visual embeddings.

    The link to your product images is direct. When Lens Live matches a physical product to your ASIN, it uses your catalog photos as the reference material for that match. The quality, clarity, and angle coverage of your image stack determines whether your product surfaces in Lens Live matches — or whether a competitor with better visual data wins that moment of intent instead.

    Scale: How Much of Amazon Traffic Is Now AI-Mediated?

    Rufus-era data provides useful context for understanding the scale involved. Agency data from Q1 2026 suggests that Rufus was already mediating approximately 15–20% of shopper queries on mobile. With Alexa for Shopping now embedded in the main search bar, that percentage is expected to grow significantly through 2026 and beyond. Sessions that passed through the Rufus layer showed conversion rates of 8–14% compared to 6–9% for traditional keyword search on the same ASINs — with lower click-through rates but higher-intent, longer-session engagement. Shoppers arriving via AI-mediated discovery were already more qualified. That pattern should intensify as Alexa for Shopping becomes the default.

    The Multimodal Engine — How Amazon’s AI Actually Reads a Product Image

    Technical diagram showing Amazon's multimodal AI processing a product image through computer vision and OCR text extraction branches

    The term “multimodal” gets used loosely in marketing contexts, but in the context of Amazon’s AI it has a precise meaning: the system processes both visual content and textual content as parallel, complementary input streams — and it uses both to build a semantic understanding of your product.

    Understanding the two channels separately is the starting point for any image optimization that actually moves numbers.

    Channel One: Computer Vision

    The computer vision layer of Amazon’s product understanding system does several things simultaneously when it processes your listing images. First, it performs object detection and classification — identifying the primary product, any secondary objects in the frame, and the relationship between them. A cutting board sitting on a kitchen counter next to a chef’s knife signals something fundamentally different to the AI than a cutting board floating on a white background. The scene context matters because it helps the system map your product to use cases and buying scenarios, not just product categories.

    Second, the computer vision layer extracts style and material attributes. Color, finish, fabric weave, surface texture, proportions, form factor — these are all identified visually and used to match products against conversational queries that include descriptive language. A shopper asking “show me minimalist matte black water bottles under 30 dollars” is issuing a multi-attribute query that the AI resolves partly by reading visual signals from catalog images, not just product titles.

    Third, and often overlooked, the system reads object relationships and scale. An image of a notebook next to a hand communicates size information visually. An image of a supplement bottle next to a coffee mug communicates that it’s designed for a daily routine context. These relational signals help the AI understand not just what the product is, but how it’s used and by whom — which maps directly to conversational query matching.

    Channel Two: OCR (Optical Character Recognition)

    This is the channel most sellers are leaving completely dark. Amazon’s AI reads the text embedded in your product images through OCR — and it treats that text as semantic input, not decoration. Text overlays that appear in infographic images, callout arrows with spec labels, badge icons with certifications, dimension annotations — all of it is being extracted and processed as content signals.

    The implication is significant. Text that lives in your product images is, from the AI’s perspective, essentially another version of your bullet points. It’s structured information that the system can use to answer shopper questions and determine relevance for specific queries. A listing with an infographic that reads “BPA-Free • 32oz • Dishwasher Safe • Keeps Cold 24 Hours” is presenting four distinct feature claims that the AI can use to surface the product for queries like “dishwasher-safe water bottle” or “how long does this keep drinks cold?” — even when those specific phrases don’t appear with equal prominence in the listing’s written copy.

    How the Two Channels Work Together

    The power of the multimodal approach comes from the combination. Computer vision identifies an object, classifies its scene context, and extracts visual attributes. OCR reads any embedded text and adds structured claim data. Together, these two streams are fused into a unified semantic profile of the product — one that the AI uses both to rank the product for relevant queries and to generate accurate, confident answers in conversational shopping interactions.

    A listing where these two channels reinforce each other — where the lifestyle image shows the product in a camping scene and the infographic overlay reads “Waterproof to 30m” — gives the AI more to work with than a listing where the visual and text content are disconnected or redundant. Coherence between channels is itself a signal of quality.

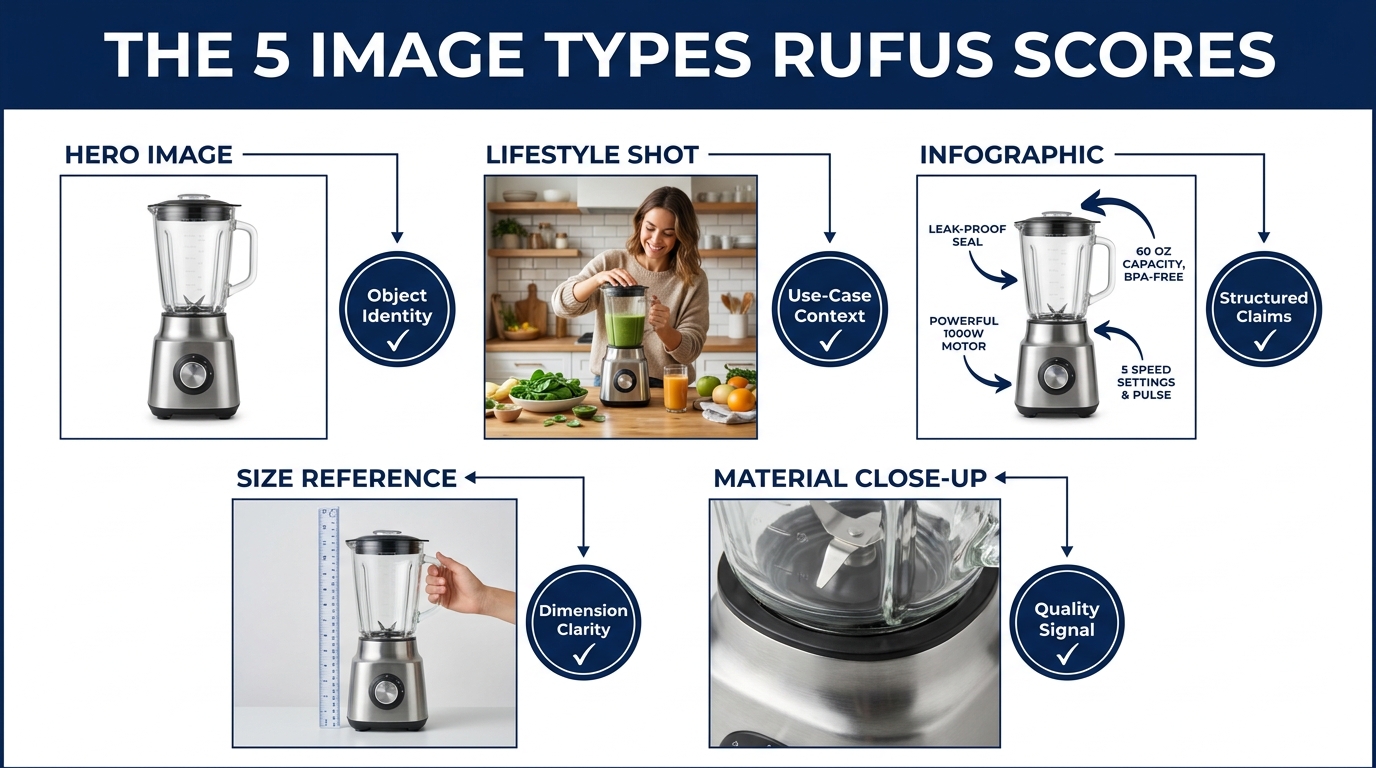
    The Five Image Types the AI Scores Differently
    Comparison of 5 Amazon product image types with AI scoring badges: hero image, lifestyle shot, infographic, size reference, and material close-up

    Not all product images in your stack carry equal weight in Amazon’s AI layer. Different image types serve fundamentally different functions in the multimodal parsing pipeline — and optimizing each one requires understanding what specific signal it’s responsible for delivering.

    1. The Hero / Primary Image: Object Identity Anchor

    The primary image is the AI’s first point of reference for object identification. Its function in the machine-readable layer is to establish a clean, unambiguous “this is what the product is” anchor. Amazon’s existing image policy requires a white background, full product visibility, and no clutter — and this policy exists for reasons that go beyond human aesthetics. A clean, well-lit primary image on white gives the computer vision system the highest-confidence object classification data. Unusual angles, heavy shadows, partial crops, or cluttered backgrounds all reduce that confidence, which can affect how reliably the product is surfaced in visual-search scenarios.

    From a practical standpoint: your primary image should show the product at an angle that reveals its primary identifying features. For apparel, that’s a flat or ghost mannequin shot showing the silhouette clearly. For hardware or tools, it’s a straight-on shot that makes dimensions and proportions readable. For multi-component products (a coffee maker with a carafe), all components should be visible and proportionally represented. The AI needs to know exactly what it’s cataloguing before it can reliably match it to queries.

    2. Lifestyle / Context Images: Use-Case Signal Generator

    Lifestyle images carry a disproportionate share of the use-case and audience-matching signal in your image stack. When the AI processes a lifestyle shot, it’s not evaluating the photography quality — it’s extracting the scene context. A yoga mat photographed in a bright studio next to a water bottle and a folded towel tells the system something very specific: this product belongs to the fitness category, it’s associated with an indoor workout routine, and it appeals to health-conscious consumers.

    That scene context is used directly in conversational query matching. When a shopper asks Alexa for Shopping “what’s a good yoga mat for home workouts?” the AI draws on the scene data extracted from listing images — not just the written product description — to determine which products map confidently to that scenario. Listings with no lifestyle imagery, or lifestyle imagery that places the product in a generic or contradictory context, give the AI weaker scene data to work with.

    The specificity of the lifestyle scene matters. A camping chair photographed outdoors at a lakeside fire pit communicates “camping gear” more precisely than the same chair in a backyard. A laptop stand used in a tidy home office setup communicates “remote work productivity” more clearly than one on a crowded kitchen table. Precision in scene selection is precision in query mapping.

    3. Infographic Images: Structured Claims in Visual Form

    Infographic images — product shots overlaid with callout arrows, spec labels, feature badges, and benefit statements — are the image type where the OCR channel of Amazon’s AI does most of its work. Every legible text element in an infographic is a potential semantic signal. This makes infographic images the highest-density information asset in your entire image stack.

    What makes a good infographic from the AI’s perspective? Legibility is the baseline requirement — text that’s too small, too stylized, or too low-contrast to be reliably read by OCR is wasted signal. Beyond legibility, the content of the text matters. Feature claims that are specific and factual (“1200mAh battery • Up to 18 hours playback”) give the AI precise, queryable data. Vague marketing language (“premium quality • long-lasting”) provides much weaker signal because it doesn’t map to specific queries.

    The distribution of claims across your infographic also matters. Concentrating all your text in one dense block makes OCR extraction less reliable and makes the image harder for human readers too. Spreading callouts across the product image — pointing to specific components or features — gives both the AI and the human shopper a clearer map of what makes the product worth buying.

    4. Size Reference / Comparison Shots: Dimension Disambiguation

    One of the most common failure modes in product listings is dimension ambiguity. A buyer who receives a product that’s significantly larger or smaller than they expected leaves a negative review, requests a return, and depresses the listing’s conversion rate. Amazon’s AI is aware of this problem, and size reference images — shots that show the product next to a hand, a ruler, a common household object, or another version of the same product at a different size — provide the dimension disambiguation data the system needs.

    For products where size varies significantly across the catalog (bottles, bags, furniture, electronics accessories), size reference images help the AI match your product to queries that include dimensional language. “Small,” “compact,” “portable,” “oversized,” “travel-size” — these are terms that the system needs visual evidence to verify, not just title claims. A listing that shows the product next to a recognizable reference object anchors the size claim in visual reality.

    Comparison shots between product variants serve a similar function. If you sell a product in three sizes, an image showing all three side by side — with labels indicating the dimensions — gives the AI a relational understanding of your SKU range that helps it route size-specific queries to the correct variant rather than defaulting to the most popular ASIN.

    5. Material / Detail Close-Ups: Quality and Sensory Signals

    Close-up shots of material texture, finish quality, stitching, joints, surfaces, or other fine details serve a specific function in the AI’s quality assessment. These images are processed by the computer vision layer as material attribute data — the system extracts information about surface finish, texture class, apparent quality tier, and construction method from detailed close-ups that would be invisible in a full product shot.

    For categories where material quality is a primary purchase driver — apparel, leather goods, cookware, furniture, bedding, outdoor gear — material close-ups are not optional. They’re the images that allow the AI to confidently categorize your product as “premium” or “high-quality” in response to queries that use those filters. Without them, the system has to make that determination from less reliable signals.

    Visual Search via Lens Live: Your Catalog as a Discovery Engine

    Smartphone showing Amazon Lens Live interface with real-time product matching and Alexa for Shopping AI chat integration

    Lens Live represents a genuinely new form of product discovery, and its relationship to your existing image stack is direct and concrete. When Amazon’s official May 2026 announcement described Lens Live, the core mechanism was clear: on-device object detection matches physical products in the real world to catalog listings using deep-learning visual embeddings. Those embeddings are built, at least in part, from your product images.

    How Lens Live Matching Works

    When a shopper points their phone camera at a product — say, a bag they spotted at a friend’s house or a piece of furniture in a store — Lens Live’s on-device model identifies the product’s key visual attributes in real time: shape, color, material, proportions, style category. It then queries Amazon’s visual search index for catalog items that match those attributes closely enough to warrant surfacing in the swipeable carousel.

    The match quality depends on the visual embedding built from your catalog images. Products with high-resolution, well-lit images taken from multiple angles — especially images that accurately represent the product’s true color and finish — generate stronger visual embeddings and match more reliably to real-world counterparts. Products with poor image quality, inaccurate color representation, or limited angle coverage generate weaker embeddings and lose out on Lens Live discovery.

    Multi-Angle Coverage Is Now a Discovery Signal

    Amazon’s standard image policy allows up to nine images per listing (more in some categories). In the Lens Live era, using all available image slots with genuinely different angle coverage is not just a conversion tactic — it’s a discovery tactic. Each additional angle gives the visual embedding model more data to work with. A product photographed from front, back, side, top, and at a 45-degree angle generates a richer, more robust visual representation than one with five nearly identical shots.

    This is particularly important for three-dimensional products — bags, footwear, hardware, appliances — where different viewing angles reveal distinctly different visual information. A backpack seen from the front looks very different from one seen from the side, and real-world Lens Live queries can come from any angle. The more angles your images cover, the higher the probability that a real-world sighting generates a match.

    Color Accuracy Has Downstream AI Consequences

    Color accuracy in product photography has always mattered for returns and reviews. In the Lens Live era, it also matters for discovery. If your listing images show a bag as navy blue, but the actual product is closer to black, the visual embedding built from your images will produce confident matches for navy-blue queries and weak matches for black queries — even though the real-world product would logically surface for either. Accurate color representation aligns your visual embedding with the real-world product, which maximizes match coverage across query types.

    Conversational Query Matching: How Images Answer Shopper Questions

    One of the least-understood aspects of Rufus-era image optimization is the role images play in answering the conversational, long-tail queries that now account for a growing share of Amazon search traffic. When a shopper types or speaks “what’s the best non-stick pan for someone who cooks a lot of fish?” into Alexa for Shopping, the AI doesn’t just process the text content of listings — it cross-references the visual content too.

    The Intent-to-Image Mapping Problem

    Conversational queries are richer and more specific than keyword queries, and they map to products through a combination of text signals and visual signals. A query like “show me a gym bag that fits in a locker” is resolved by combining: the text content of the title and bullet points, reviews that mention gym lockers, and — critically — any lifestyle images that show the product in a gym context or next to a locker for scale reference.

    Listings that have done the work of creating scene-specific lifestyle images are materially better positioned for these queries. The AI has direct visual evidence that the product fits the use case the shopper described. Listings that rely solely on written copy to make the same claim are providing a single-channel signal versus a multi-channel one. In a competitive category, the multi-channel signal almost always wins.

    Comparison Queries and the Image Stack

    Rufus was used heavily for comparison queries — “compare the X and the Y” type prompts that the original chat interface was designed for. Alexa for Shopping handles these natively, but the underlying challenge for sellers is the same: when the AI compares your product to a competitor’s, it’s drawing on the full information profile of each listing, including the visual data.

    Sellers who have built a comprehensive, differentiated image stack — images that clearly communicate the specific attributes that make their product the better choice — give the AI the material it needs to include their product favorably in a comparison response. Sellers whose image stacks are thin, generic, or missing key category-specific image types give the AI little to work with, which tends to result in either omission from comparison results or a weaker, less-confident presentation.

    Negative Queries: Exclusion Patterns to Avoid

    Conversational shoppers also use exclusion language: “without BPA,” “no synthetic materials,” “not too heavy.” If your product meets these criteria but nothing in your image stack visually supports those claims, the AI has to rely on text alone. Text claims without visual corroboration carry less weight in the AI’s confidence scoring. An infographic that explicitly shows “BPA-Free” as a labeled callout — backed by a close-up of the materials — addresses both the OCR channel and the computer vision channel simultaneously and produces a higher-confidence match for exclusion-based queries.

    What A+ Content Images Add to the AI’s Understanding

    A+ Content — the enhanced brand content module below the main product description — is often treated as a human-focused selling tool: comparison tables, brand storytelling, lifestyle imagery for emotional resonance. In the multimodal AI era, it’s also a significant source of machine-readable visual and text data that feeds directly into the AI’s product understanding.

    A+ Images Are Indexed by the AI

    Amazon’s multimodal parsing extends into A+ Content. The images, infographics, comparison charts, and text blocks within A+ modules are processed by the same computer vision and OCR systems that handle your primary listing images. This means a well-structured A+ layout with clear image alt text, legible comparison tables, and detailed lifestyle imagery is not just a better human experience — it’s additional signal for the AI.

    Comparison charts within A+ Content are particularly valuable. A chart comparing your product to the category average across six dimensions — weight, materials, warranty, compatibility, cleaning ease, capacity — gives the AI a structured, highly queryable data source that can be used to answer specific comparison queries accurately and confidently. The more structured and legible the chart, the more reliably the AI can extract and use it.

    Alt Text in A+ Images: The Often-Forgotten Signal

    Amazon allows sellers to add alt text to images within A+ Content modules — and this is one of the most consistently overlooked optimization opportunities in the entire listing. Alt text is processed as text by the AI, which means it’s an additional channel for surfacing semantic signals that might not be present in the visual content itself.

    Best practice for A+ image alt text in 2026 is to write it as a descriptive sentence that conveys what the image shows and why it matters: “Stainless steel interior of 32oz insulated bottle showing no-rust lining and wide-mouth opening for easy cleaning” rather than “product interior view.” The first version provides the AI with material type, product dimension, a feature claim, and a benefit claim. The second provides almost nothing useful.

    Premium A+ Content and the AI Confidence Floor

    Brands enrolled in Amazon’s Premium A+ Content program have access to richer modules — video, interactive hotspots, larger image panels, and enhanced comparison charts. From an AI signal perspective, these modules extend the surface area of machine-readable data considerably. More image content means more OCR extraction opportunities. More module variety means a richer scene-context picture. Sellers who have access to Premium A+ and haven’t upgraded their content with AI-signal quality in mind are leaving a measurable data gap.

    The OCR Factor: Why Text Inside Your Images Is Now a Ranking Input

    Infographic showing the OCR Factor for Amazon images — how text overlays on product images are read as semantic signals by AI

    The OCR dimension of Amazon’s image processing deserves its own focused treatment because it’s the area where seller behavior has changed the least despite representing significant untapped leverage. Most sellers put text in images because their designer suggested it or because they saw competitors doing it. Very few are approaching it as a deliberate structured-data strategy.

    What OCR Actually Extracts — and What It Can’t

    Modern OCR systems, including the kind embedded in Amazon’s product parsing pipeline, are highly accurate for clear, high-contrast text at reasonable sizes. The system can reliably extract text that meets these criteria:

    • Font size: Text rendered at the equivalent of at least 14-16pt at the image’s native resolution. Smaller text becomes unreliable for OCR extraction.
    • Contrast: Dark text on light backgrounds or light text on dark backgrounds. Low-contrast combinations (grey on light grey, white on pale yellow) produce extraction errors.
    • Font style: Clean sans-serif or serif fonts. Highly decorative, script, or display fonts with unusual letterforms reduce extraction accuracy.
    • Orientation: Horizontal text extracts most reliably. Vertical or diagonal text is processed with lower confidence.

    Text that fails these criteria isn’t just wasted from the AI’s perspective — it may actually produce garbled extractions that introduce noise into the product’s semantic profile. A misread “waterproof” that comes through as “waterp roo f” creates a semantic signal that doesn’t map to any query.

    Strategic Text Placement in Infographics

    Given that OCR processes text as structured input, the information architecture of your infographic text matters considerably. The most effective approach treats each text element in an infographic as a discrete claim unit that answers a specific type of shopper question:

    • Specification claims: “32oz / 946ml” answers size queries and helps the AI understand both unit systems
    • Material claims: “18/8 Food-Grade Stainless Steel” answers material and safety queries
    • Performance claims: “Keeps Cold 24hr / Hot 12hr” answers use-case performance queries
    • Certification labels: “FDA Approved • BPA-Free • Prop 65 Compliant” answers safety-filter queries
    • Compatibility callouts: “Fits Standard Car Cupholders” answers fit-and-compatibility queries

    Each of these claim types maps to a class of shopper questions that Alexa for Shopping handles through conversational interface. Structuring your infographic text to systematically cover the major question types in your category — rather than just listing features you’re proud of — turns your infographic from a design asset into a query-answering machine.

    Text in Images vs. Text in Bullets: The Redundancy Question

    A common question from sellers optimizing for AI signals is whether it’s worth repeating information in images that’s already in the bullet points. The answer, from a multi-channel signal perspective, is yes — with important caveats. Exact duplication adds little value. Strategic reinforcement, where image text emphasizes the same key claims but in a visually anchored, contextual way, reinforces the signal strength for those claims in the AI’s model.

    A bullet point that says “keeps drinks cold for 24 hours” and an infographic image that shows the product next to a mountain lake with overlay text “COLD 24HRS” are providing corroborating signals through two different channels. The first is text metadata. The second combines a use-case visual signal (outdoor adventure context) with an OCR-readable performance claim. Together they’re more powerful than either alone.

    What Not to Do: Image Patterns That Actively Confuse the AI

    Understanding what weakens or corrupts your image signals is at least as valuable as knowing what strengthens them. Several common image choices — patterns that made sense in a purely human-facing optimization framework — actively degrade the AI’s ability to understand your product.

    Cluttered Hero Images

    A primary image that includes multiple objects, props, or decorative elements alongside the main product creates object classification ambiguity. The AI’s computer vision layer will attempt to identify all objects in the frame, and if the relationship between them isn’t clear, the system’s confidence in the primary product classification decreases. This directly impacts how reliably your product surfaces in queries where precise object identification matters.

    Common offenders: skincare sets photographed with flowers, candles, and towels scattered around the products; tech accessories photographed with laptops, coffee cups, and phones without clear hierarchy; food products photographed with so many ingredients and serving props that the actual product is visually subordinate in the frame.

    Lifestyle Images Without Any Contextual Anchoring

    Generic lifestyle imagery — attractive people using a product in a vague, unspecific setting — provides minimal scene context to the AI. A woman smiling while holding a water bottle in front of a blurred outdoor background communicates almost nothing specific about use case, audience, or context. The same product photographed mid-hike on a mountain trail next to a trail map and hiking boots communicates “outdoor fitness activity, active lifestyle consumer, rugged use case” in a single visual frame.

    The AI extracts scene context from the specific, identifiable elements in an image. Generic lifestyle photography, by design, minimizes specific elements in favor of emotional appeal. For human shoppers, that can work. For AI indexing, it’s a missed opportunity.

    Stylized, Low-Legibility Text in Infographics

    The desire to make infographic images match brand aesthetics — using brand fonts, color palettes, and design styles — sometimes results in text that’s visually on-brand but functionally unreadable by OCR systems. Thin fonts on pale backgrounds, decorative script for important specification text, or text sized for visual proportion rather than legibility all produce extraction failures. The brand-first, readability-second approach to infographic design is a specific pattern to audit and correct.

    Inconsistent Color Representation Across Images

    When your primary image, lifestyle images, and infographic images show the product in noticeably different colors due to inconsistent photography or editing, the AI builds a confused visual embedding. Does this product appear navy or black? Is the finish matte or slightly glossy? Inconsistency across images introduces attribute ambiguity that weakens the visual matching quality for both catalog search and Lens Live discovery.

    Missing Variants in the Image Stack

    For products sold in multiple color or material variants, having only the base variant photographed and using the same image set for all variants is a significant signal gap. The AI may have a high-confidence visual profile for the black version of your product and a low-confidence or absent profile for the green version — resulting in dramatically different discovery performance across the variant set. Each variant deserves its own dedicated image stack, even if the lifestyle and infographic images can be reused with color-adjusted primary and detail shots.

    A Practical 8-Point Rufus Image Audit for Your Listings
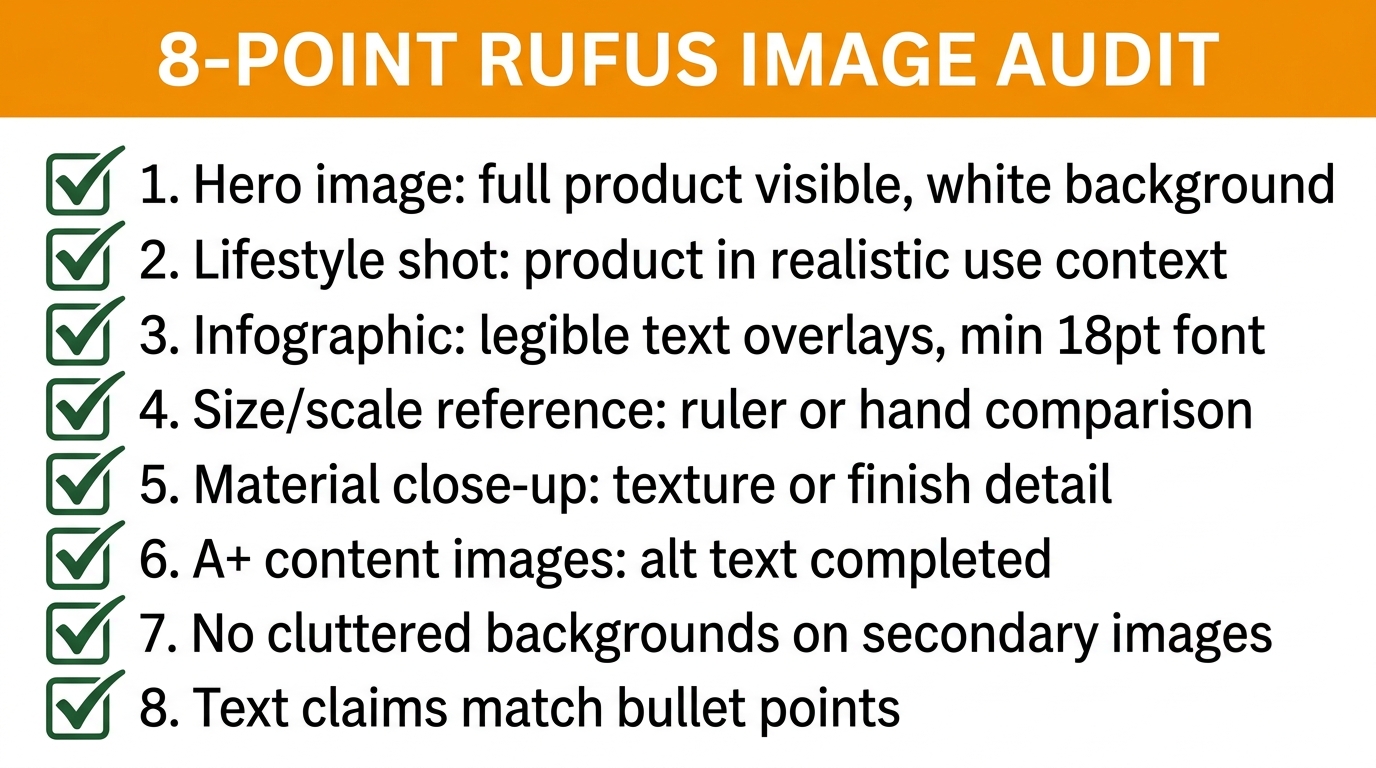
    8-point Rufus image audit checklist for Amazon sellers with green checkmarks on white card with orange title bar

    The following audit framework is designed to be applied to any existing listing to identify the highest-priority image gaps from the AI’s perspective. It’s organized in priority order — the items at the top have the most impact on core AI signal quality, while those at the bottom represent refinements that matter most in competitive categories.

    1. Primary Image Clarity Check

    Pull your hero image and evaluate it against these specific criteria: Is the full product visible without cropping? Is the background genuinely white (not off-white, cream, or grey)? Is the image resolution at least 1000px on the shortest side (required for zoom, also optimal for computer vision)? Are the product’s identifying features — its most recognizable angles, main components, and distinguishing attributes — clearly visible? Flag any image that fails more than one of these criteria for immediate replacement.

    2. Lifestyle Scene Specificity Audit

    Review each lifestyle image and ask: does this image communicate a specific, identifiable use case, or is it generic? For each lifestyle image, write down in one sentence what use case and audience it communicates. If you can’t answer clearly, the AI probably can’t either. Aim for at least one lifestyle image per major use case category for your product. A product that can be used at home, outdoors, and in a gym should have at least one image for each context.

    3. Infographic Text Legibility Scan

    Zoom your infographic images to 1:1 resolution on screen and evaluate text legibility. Can you read every text element clearly? Are the fonts clean and well-contrasted? Are the most important claims — size, materials, key performance specs — present and clearly labeled? Identify any text elements that are decorative rather than informational and consider whether the space would be better used for an additional claim with direct query value.

    4. OCR Coverage Assessment

    List the top 10 questions shoppers ask about your product category — “what size is it?”, “is it dishwasher safe?”, “what material is it made of?”, “how long does the battery last?” — and check whether each of those questions is answered somewhere in your image stack through legible text. Gaps in this coverage represent direct query-answering failures. Prioritize the most common questions first.

    5. Size and Scale Reference Review

    Does your image stack include at least one shot that communicates size or scale through a visual reference? For products where size is a common objection or question in your reviews, this is non-negotiable. The reference should be something universally recognizable — a human hand, a standard household object, or a ruler with measurement markings visible.

    6. Material/Detail Close-Up Coverage

    For any product in a category where material quality drives purchase decisions, check whether you have at least one dedicated close-up image showing the material or finish in detail. If your product’s key quality differentiator is visible at close range — a tight weave, a precision machined joint, a food-safe coating — and that detail isn’t represented in your image stack, the AI has no visual basis for categorizing your product as high-quality in that dimension.

    7. A+ Content Image and Alt Text Audit

    Open your A+ Content and review every image module. Has alt text been added to every image? Does the alt text describe what the image shows and why it matters, or is it a generic label? Are comparison charts legible and clearly structured? Are any image blocks using generic brand imagery that provides neither lifestyle context nor feature information? Flag all alt text fields that are blank or generic for immediate updating.

    8. Cross-Variant Image Consistency Check

    For products with multiple variants, check whether each variant has its own color-accurate primary image and, where possible, its own variant-appropriate lifestyle imagery. Pay particular attention to the accuracy of color representation across images — ensure that the primary image, lifestyle images, and any detail shots all show the same, consistent color rendering. Variants that share a single image stack despite having visually distinct appearances are systematically underperforming in AI-mediated discovery.

    Measuring the Impact: Metrics That Signal Your Image Optimization Is Working

    Image optimization for AI signals is ultimately a conversion and discovery play, which means it should be measurable. Knowing which metrics to watch — and how to interpret them in the context of Alexa for Shopping’s influence — helps you evaluate the ROI of image investments before committing to full catalog overhauls.

    Session-to-Conversion Rate by Traffic Source

    Amazon’s Brand Analytics and third-party analytics tools increasingly allow segmentation of conversion data by traffic source. Sessions driven by conversational or AI-mediated discovery should show higher conversion rates than keyword-only sessions for well-optimized listings. If your AI-attributed sessions are converting at rates similar to or lower than your keyword sessions, that’s a signal that your listing — and specifically your image stack — isn’t meeting the qualification signal that makes AI-driven shoppers convert.

    Return Rate as an Image Quality Proxy

    Return rates and the reasons behind them are often the clearest downstream signal of image quality problems. Returns attributed to “item was different from what was described” or “item was smaller/larger than expected” are frequently image failures — the product didn’t visually communicate what the shopper received. As you improve image specificity (especially size reference shots and accurate color representation), a measurable improvement in return rate is a reliable indicator of signal quality improvement.

    Voice of Customer and Review Themes

    Review analysis for questions that overlap with your infographic text coverage is a useful diagnostic tool. If you’ve added a clear “BPA-Free” callout to your infographic and the frequency of “is this BPA-free?” questions in your Q&A drops over the following 60 days, the image content is working — both for humans and for the AI that uses review and Q&A patterns as ground truth signals in its product understanding model.

    Rufus/AI Panel Appearance Frequency

    Sellers who monitor their listings carefully have reported tracking how frequently their product appears as a specific recommendation in Rufus or Alexa for Shopping responses to relevant category queries. While Amazon doesn’t provide direct attribution data for this, testing with representative queries in your category and tracking the frequency and quality of your product’s inclusion in AI-generated responses is a practical way to gauge image signal quality. A product that’s consistently surfaced with confident, accurate AI-generated descriptions is one whose image stack is providing good multimodal signal. One that rarely appears, or appears with vague or inaccurate AI descriptions, is one whose images are failing to communicate effectively.

    Impressions on Visual Search Queries

    As Amazon’s search reporting evolves to better reflect visual and conversational query traffic, watch for any data Amazon provides through Seller Central or the Advertising console on impressions generated through visual search (Lens Live) pathways. Impressions on visual search queries are a direct measure of how well your images are performing as visual embeddings in the Lens Live discovery system. Listing-level or ASIN-level breakdowns of visual search traffic will become increasingly important as Lens Live usage scales.

    Conclusion: Images Are Infrastructure, Not Decoration

    The mental model shift at the heart of Rufus-era image optimization is simple but demanding: product images are no longer primarily a human communication tool. They are a machine-readable data layer that determines, in a significant and growing number of shopping journeys, whether your product is surfaced, recommended, compared favorably, or ignored entirely.

    Amazon’s transition from Rufus to Alexa for Shopping has accelerated this shift by embedding AI mediation into the core search experience rather than leaving it as an optional chatbot feature. Lens Live has turned every real-world encounter with a product into a potential discovery moment — and the quality of your visual embedding determines whether you win or lose those moments. The OCR processing of infographic text has turned your image callouts into a structured claims database that the AI queries as readily as it queries your bullet points.

    None of this requires abandoning good photography. It requires layering machine-readable intent on top of human-facing aesthetics. The two goals are compatible and, when executed well, mutually reinforcing — images that are rich in accurate visual context and legible, specific text tend to be better for human shoppers too.

    The sellers who will consistently win conversions in an AI-mediated Amazon are the ones who treat their image stack as infrastructure — something to be architected, audited, and maintained with the same rigor as keyword targeting or pricing strategy. The eight-point audit in this post is the starting point. The ongoing discipline of treating every image slot as a machine-readable data asset is what separates the sellers who see their Alexa for Shopping traffic convert at 12% from the ones watching it convert at 6%.

    Key Takeaways:

    • Amazon’s Alexa for Shopping (formerly Rufus) processes product images through two parallel channels: computer vision (for scene context, objects, materials) and OCR (for embedded text). Both channels are active on every image in your listing stack.
    • Each of the five core image types — hero, lifestyle, infographic, size reference, and material close-up — serves a distinct function in the AI’s product understanding model. Missing any of them represents a specific signal gap.
    • Lens Live has made your catalog photos into visual search inventory. Multi-angle coverage and color accuracy directly determine your discoverability in real-world product sighting scenarios.
    • Infographic text should be treated as a structured claims database, systematically covering the major question types in your category. Legibility (contrast, font size, clean typeface) is the prerequisite for any of it to work.
    • A+ Content images and alt text are indexed by the AI. Blank alt text fields and generic lifestyle imagery in A+ are measurable signal gaps, not neutral choices.
    • The 8-point audit — hero clarity, lifestyle specificity, infographic text legibility, OCR coverage, size reference, material detail, A+ alt text, cross-variant consistency — is a practical starting point for any catalog that hasn’t been optimized for the multimodal era.

  • Why Your Amazon Listings Are Invisible to Your Best Customers (And How 360° and AR Images Fix That)

    Why Your Amazon Listings Are Invisible to Your Best Customers (And How 360° and AR Images Fix That)

    360° and AR product images on Amazon — the conversion edge most sellers miss

    There is a fundamental problem baked into every Amazon product listing: the customer cannot pick up the product. They cannot turn it over, peer at the stitching, feel the weight, or hold it up to the light. Every purchase is an act of faith — and the only thing standing between that faith and a click away is your product imagery.

    Most sellers know this in theory. In practice, the vast majority of Amazon listings still rely on the same three or four flat, static photographs that haven’t changed since the ASIN was first created. Meanwhile, a growing number of brand-registered sellers are quietly watching their conversion rates climb — not because they rewrote their bullet points, launched another PPC campaign, or chased review velocity — but because they changed how shoppers experience their product visually before buying.

    This article is not about making your images “look nicer.” It’s about the specific mechanics of 360-degree spin views, 3D model uploads, and Amazon’s AR features — what the data actually shows, who qualifies, how to execute without a large production budget, and how to build a visual asset stack that does measurable work at every stage of the shopper’s decision process.

    If you have already read generic advice about “using high-quality images,” this is something different. What follows is the operational reality of visual commerce on Amazon in 2026 — including a policy shift in early 2024 that most sellers still haven’t caught up with.

    The Visual Trust Gap: Why Shoppers Need More Than a Pretty Photo

    Before getting tactical, it’s worth understanding the psychological problem that 360° and AR imagery actually solves — because the solution only makes sense when you see how deep the problem runs.

    According to the Amazon Shopper Report, which surveyed 1,000 shoppers across the US, UK, Germany, France, Spain, and Italy, 92% of Amazon shoppers cite detailed product images as a key factor in converting their interest into a purchase — second only to price at 95%. That ranking puts imagery ahead of reviews, shipping speed, and brand reputation. Shoppers, in other words, are looking at your images before they read a single word of your listing.

    The “imagination gap” in online retail

    Neuroscience and consumer behavior research consistently show that buying decisions are driven by the buyer’s ability to mentally simulate ownership of a product. When you pick up a chair in a furniture store, your brain is already placing it in your living room. When you hold a pair of shoes, you’re imagining them on your feet. Online shopping strips out this simulation entirely — and a flat photograph does almost nothing to rebuild it.

    This is why static images, no matter how professionally shot, create what researchers call an “imagination gap”: a residual uncertainty about whether the product will actually look, fit, and function as expected in the buyer’s real-world context. That uncertainty is one of the main reasons shoppers add items to carts and never check out. It’s also why 22% of all e-commerce returns are triggered specifically by products not matching their photos — not defects, not sizing issues, but a failure of visual representation.

    The mobile multiplier

    The problem is compounded by the device most shoppers now use. With 73% of Amazon shoppers regularly browsing via smartphone, the limitations of a 1,200-pixel static JPEG are even more severe. On a small screen, details disappear. Texture becomes indistinguishable from color. Scale becomes guesswork. Research shows mobile shoppers abandon listings 2.1 times faster than desktop shoppers when they encounter visual friction — unclear sizing, missing lifestyle context, or no way to examine product details up close.

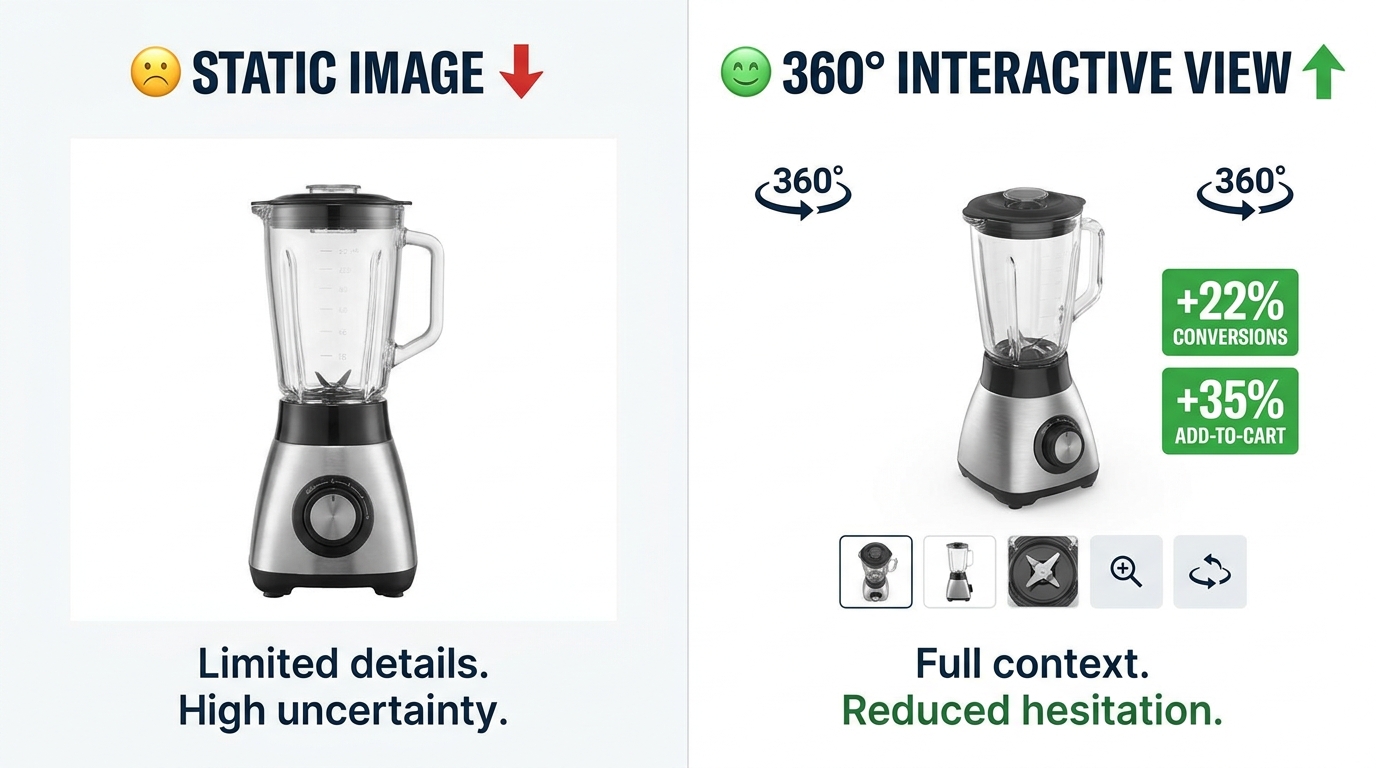
    Interactive imagery — the kind that lets a shopper spin a product, zoom into a seam, or drop a piece of furniture into a photo of their own living room — collapses the imagination gap. It replaces uncertainty with simulated experience, and simulated experience is far closer to the certainty of holding a physical product than any static shot can achieve.

    Static images versus 360° interactive views: conversion rate comparison showing +22% conversions and +35% add-to-cart

    What Happened When Amazon Killed Traditional 360° Photography in January 2024

    In January 2024, Amazon made a policy change that most sellers are still trying to fully understand: the platform formally discontinued support for the traditional 360-degree product photography format — the animated GIF-style spinning images that had become common on many listings. This wasn’t a minor update buried in Seller Central. It was a deliberate architectural shift in how Amazon intends for interactive product views to work going forward.

    The reasoning was straightforward. Traditional 360-degree photography — which involves capturing 24 to 72 individual frames and stitching them into a spinning animation — produces large file sizes, loads slowly on mobile, and cannot be adapted for augmented reality features. Amazon’s infrastructure had moved on. The platform is now built around 3D models as the primary vehicle for interactive product visualization.

    Why many sellers missed the memo

    The discontinuation of 360° photography created a knowledge gap that persists into 2026. Sellers who had invested in 360° photo rigs or paid agencies for spinning images found themselves with assets that couldn’t be uploaded. Many responded by doing nothing — reverting to static images and assuming the feature was simply gone. Others conflated “360° photography” with “interactive spin view” and assumed the entire capability had been removed.

    Neither assumption is correct. The interactive spin experience is alive, well, and delivering stronger results than ever. It’s just delivered through a different medium. Instead of a spinning animation built from dozens of photographs, Amazon’s interactive views are now rendered from 3D models — digital objects that can be spun in real time, zoomed, lit from any angle, and placed into an augmented reality environment by the shopper’s own smartphone camera.

    What this means for competitive positioning

    The transition to 3D models created a short-term competitive gap that still exists today. Because 3D model creation has a steeper learning curve and higher upfront cost than traditional photography, many sellers have opted out entirely. This means that in most product categories, the share of listings with interactive spin views or AR capability is still very low — which means sellers who do make the investment stand out substantially in search results and on listing pages.

    The January 2024 policy shift, in other words, didn’t end the opportunity for sellers who embrace interactive imagery. It filtered out the sellers who weren’t willing to adapt, leaving more visible runway for those who are.

    The 3D Model Era: How Amazon’s Spin View Actually Works Today

    Understanding how Amazon’s current interactive imagery system works is essential before investing time or money into it. The feature is often described loosely as “360-degree views,” but the technical reality is more precise — and more powerful.

    From photographs to digital objects

    When Amazon displays a “spin view” of a product today, it is rendering a 3D model file in real time inside the browser or app. The shopper can grab and rotate the product with their finger or cursor, zoom in to examine texture and detail at any angle, and in eligible categories, activate the “View in Your Room” AR feature to place the product in their own physical space using their device’s camera.

    This is fundamentally different from a spinning animation. A 3D model is not a sequence of photographs — it is a mathematical representation of the product’s geometry, surface materials, and textures. Amazon renders it on the fly, which means the shopper controls the experience rather than watching a pre-set rotation.

    File requirements and technical specifications

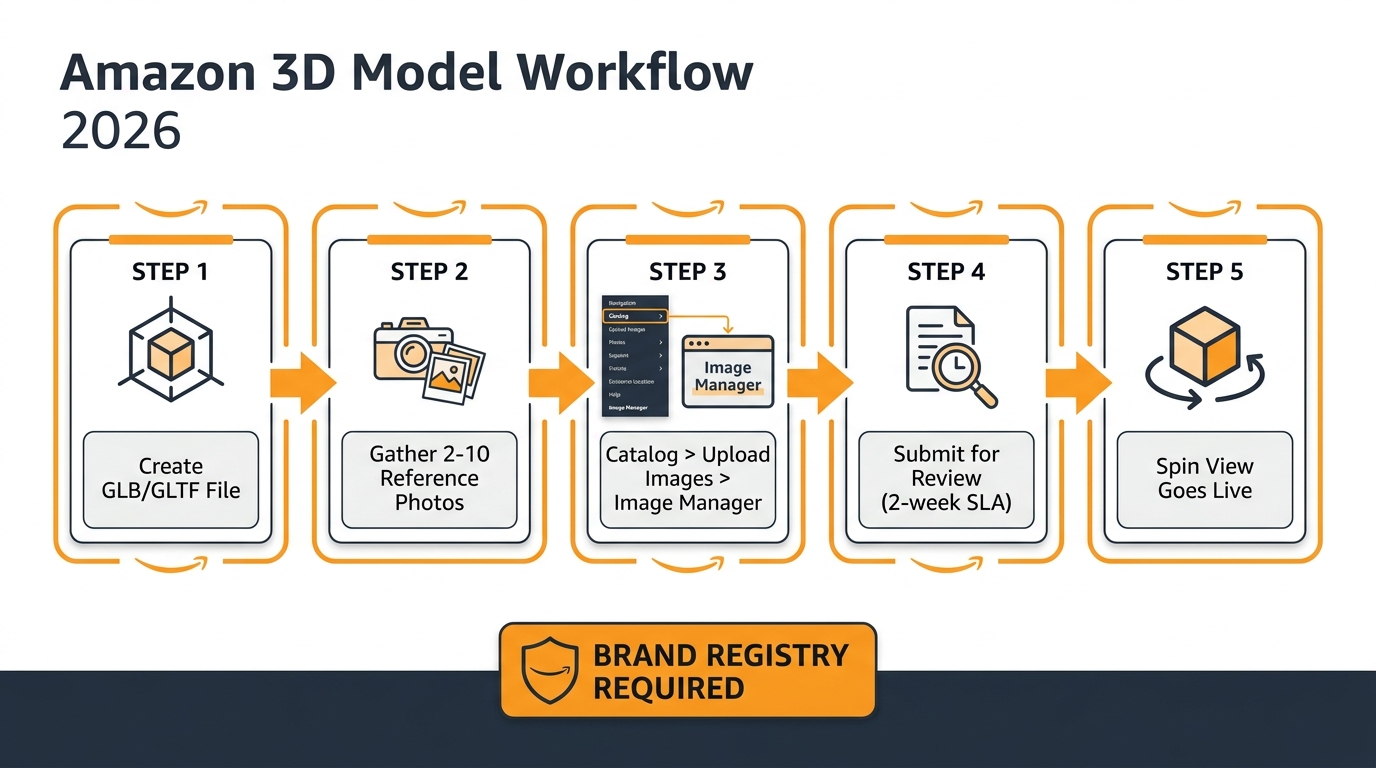
    Amazon accepts 3D models in GLB or GLTF format. The GLB format (Binary GL Transmission Format) is generally preferred because it packages all textures and geometry into a single file. Key technical requirements as of 2026 include:

    • Polygon count: Maximum 1 million triangles per model; Amazon’s recommended sweet spot is 150,000–200,000 for optimal loading performance
    • No cameras attribute: The model must not include embedded camera objects
    • No KHR_materials_specular extensions or other incompatible shader types
    • Textures: Accurate material textures that represent real-world product appearance — Amazon will reject submissions that appear inaccurate
    • Reference photos: 2–10 high-quality photographs of the actual physical product submitted alongside the model to verify accuracy
    • Dimensions: Accurate real-world dimensions required for AR placement to work correctly

    Files can be validated before submission using the Khronos glTF Validator, a free open-source tool that identifies technical errors before Amazon’s review team sees them — saving the two-week review turnaround on easily fixable mistakes.

    The submission process step by step

    Upload happens through Seller Central under Catalog → Upload Images → Image Manager tab. Search for the ASIN or SKU, verify that the Registered Brand Owner icon is showing (this step is required), and select 3D Models → Upload 3D Model. Submit the GLB file alongside reference photos and product dimensions. Amazon’s review team typically takes up to two weeks to approve or reject the submission, with feedback provided on rejections. Once approved, the spin view and AR badge appear on the listing automatically.

    Brand Registry enrollment is non-negotiable. Sellers without it cannot access the 3D model upload feature at all.

    Amazon 3D model upload workflow for Seller Central — 5-step process from GLB file creation to live spin view

    “View in Your Room” and “View in 3D” — Who Qualifies and How to Enable It

    Amazon operates two distinct interactive visualization features that are often confused with each other. Understanding the difference — and which one applies to your product — is important for setting the right production and submission expectations.

    View in 3D: the spin experience on listing pages

    “View in 3D” is the interactive spin capability that appears on the main product detail page. When activated, shoppers see an icon on the image gallery inviting them to rotate and zoom the product in 3D. This feature is available across a wide range of categories including:

    • Shoes and footwear
    • Eyewear (sunglasses, glasses frames)
    • Home and furniture
    • Consumer electronics
    • Beauty and personal care
    • Baby products
    • Sports and outdoor equipment
    • Toys and games
    • Pet supplies
    • Automotive accessories

    This list is expanding. Amazon has been systematically broadening the eligible categories as 3D model production becomes more widespread and its review infrastructure scales up.

    View in Your Room: the full AR experience

    “View in Your Room” is a separate, more powerful feature that uses the shopper’s device camera to place the product into their actual physical environment using augmented reality. The shopper points their phone at their floor, table, or wall, and sees a true-to-scale 3D rendering of the product appear in their space — positioned accurately, casting realistic shadows, and viewable from any angle by moving the phone.

    Eligibility is more specific: any product that would naturally sit on a floor or table, or be mounted to a wall or vertical surface. Practically, this covers the bulk of the furniture, home décor, lighting, kitchen appliance, and storage categories. Supported marketplaces include amazon.com, amazon.ca, amazon.co.uk, amazon.de, amazon.es, amazon.fr, and amazon.it.

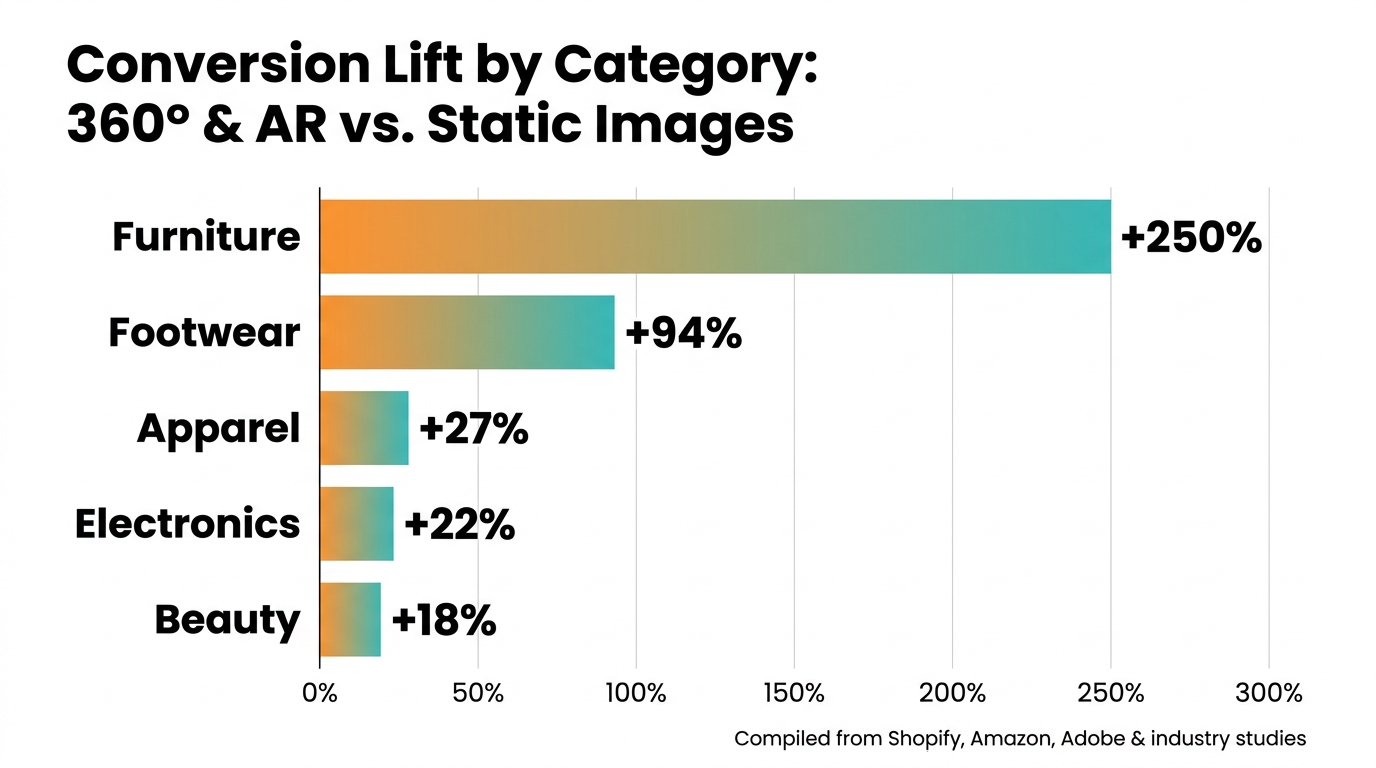
    When Amazon analyzed listings using “View in Your Room” in a 2023 study, the feature delivered an average 9% improvement in sales for enrolled products. In high-consideration categories like furniture and home décor, results are considerably more dramatic: AR visualization for furniture has been cited in Adobe and industry research at conversion lift figures as high as 250% over static images, as shoppers who can place a sofa in their living room before buying eliminate virtually all scale and color uncertainty.

    The “Virtual Try-On” features for fashion and beauty

    Amazon also operates category-specific AR try-on features that sit slightly outside the standard 3D model workflow. Virtual Try-On for Shoes (launched 2022) uses the device camera to overlay shoe imagery onto the shopper’s actual feet. Similar functionality exists for eyewear. These features are managed through Amazon’s fashion and brand programs rather than the standard 3D model upload path, and eligibility is typically connected to brand participation agreements rather than a standard self-service upload process.

    Amazon describes all of these AR features as ongoing experiments and does not publish category-level conversion data. What is known from Amazon’s own public statements is that products with 3D views or virtual try-on features saw purchase rates approximately double compared to listings without them in the period following their introduction, and that eight times more customers engaged with AR-viewed products between 2018 and 2022.

    The Return Rate Problem That Nobody Talks About (And Why Visuals Are the Fix)

    Most sellers think about product imagery purely in terms of conversion. Getting more shoppers to click “Add to Cart” is the obvious goal. But there is a second, equally important dimension to the imagery problem that rarely makes it into the seller conversation: returns.

    Returns are expensive in a way that doesn’t always show up cleanly in an advertising dashboard. FBA return fees, restocking costs, the likelihood of returned inventory being graded as unsellable, and the downstream impact on seller metrics — all of this compounds quickly. In categories like apparel, furniture, and electronics, return rates can reach 15–30% of all units sold. A meaningful fraction of those returns is not the product’s fault at all. It’s the listing’s fault.

    The data on image-driven returns

    Research consistently points to a direct link between image quality and return rates. The key statistics from 2024–2026 data:

    • 22% of e-commerce returns are triggered by products not matching their photographs or descriptions — not defects, sizing errors, or buyer’s remorse, but a failure of visual expectation-setting
    • Professional multi-angle photography reduces return rates by 23% compared to basic single-angle images
    • Adding 360-degree or interactive views on top of multi-angle photography reduces returns by a further 15%
    • 3D model and AR visualization tools deliver return reductions of up to 40% in categories where spatial context matters most (furniture, home goods)
    • 34% of all product returns across e-commerce are linked directly to poor product presentation

    Put simply: every dollar invested in better imagery does double work. It increases the number of buyers who convert, and it decreases the number of buyers who convert and then return. The economics of this compound in a way that makes visual investment one of the highest-return line items in a seller’s budget.

    The category-specific return problem

    Returns driven by visual mismatch are not distributed evenly across categories. They are most severe in categories where real-world context matters most — where a buyer needs to know how something fits in a space, how a color reads under natural light rather than studio lighting, or how a texture feels relative to other materials in the image. Furniture, rugs, curtains, lighting, apparel, footwear, and electronics accessories are the highest-risk categories. Counterintuitively, these are also the categories where 3D and AR solutions deliver the most dramatic return-rate reductions, because the solution directly addresses the source of the uncertainty.

    Returns caused by poor product images versus AR visualization reducing return rates by up to 40%

    The Categories Where 360°/AR Has the Biggest Impact — and Where It Doesn’t

    Not every product benefits equally from 360-degree and AR imagery. Understanding where the ROI is highest — and where additional visual investment delivers diminishing returns — helps sellers prioritize their production budgets intelligently.

    Highest-impact categories

    Furniture and home décor is the category where AR delivers the most transformative results. Scale uncertainty — “will this sofa fit in my living room?” — is the single biggest barrier to purchase in this category. AR’s ability to place a true-to-scale rendering of a product in the shopper’s actual room eliminates that barrier entirely. Amazon’s own data shows a 9% average sales improvement from “View in Your Room,” and category-specific research puts the conversion lift from AR visualization in the 200–250% range over static images for high-consideration pieces.

    Footwear and apparel benefit enormously from interactive spin views and virtual try-on features. The ability to rotate a shoe 360 degrees to inspect the sole, heel construction, and profile addresses the most common pre-purchase questions. Fashion retailers using 360-degree rotation imagery have documented conversion improvements of up to 27% over static front-and-back shots.

    Consumer electronics and gadgets benefit from spin views because buyers want to understand port placement, button locations, connection points, and physical scale before committing. A laptop bag, for example, sells much better when a shopper can rotate it to see every pocket, zipper, and strap attachment point rather than relying on separate flat images of each angle.

    Eyewear and accessories are strong candidates for virtual try-on features where available, and for spin views more broadly. The physical shape and profile of a pair of sunglasses from multiple angles is difficult to represent in two or three static images alone.

    Lower-impact categories

    Commodity consumables — vitamins, cleaning products, batteries, and similar items — see minimal conversion benefit from interactive imagery because purchasing decisions are driven almost entirely by price, reviews, and brand recognition. The product’s shape is largely irrelevant to the purchase decision, and there is no spatial context needed.

    Books, digital media, and software are similarly immune to the benefits of interactive visualization for obvious reasons.

    Highly standardized components — screws, cables, replacement parts sold by spec number — convert on specification matching, not visual exploration. A buyer purchasing a specific HDMI cable by length and specification does not need to rotate the cable in 3D.

    The general rule: the more the purchase decision depends on understanding how a product looks from multiple angles, how it fits in a space, or how it sits on or with the buyer’s body, the more interactive imagery will move the conversion needle.

    Conversion lift by category using 360° and AR versus static images: furniture, footwear, apparel, electronics, beauty

    How to Create 3D Models Without a Studio Budget

    The single most common reason sellers cite for not pursuing 3D model uploads is cost. Traditional 3D modeling — commissioning a CAD artist to build a product from reference photographs — can run anywhere from $150 to $1,500+ per model depending on product complexity. For a catalog of 50 SKUs, that math gets uncomfortable quickly. But the production landscape has changed substantially in the last two years.

    Photogrammetry: turning a smartphone into a 3D scanner

    Photogrammetry is the process of creating a 3D model by photographing an object from dozens of angles and using software to stitch those images into a 3D mesh. What was once a process requiring expensive camera rigs and specialized software is now achievable with a smartphone and accessible software tools.

    The workflow is straightforward: place the product on a turntable or clean surface, capture 40–100 photos covering every angle and height, then process those images through software such as RealityCapture, Meshroom (free and open-source), or Polycam (mobile app). The output is a GLB file that can be cleaned up and submitted to Amazon. For products with relatively simple geometry — most consumer goods fall into this category — photogrammetry delivers results that meet Amazon’s accuracy requirements at dramatically lower cost than traditional 3D modeling.

    CGI and product visualization agencies

    For products that don’t photograph well (highly reflective surfaces, transparent materials, very small or intricate objects), computer-generated 3D models built from product specifications and reference images are often the better path. The market for this service has grown considerably alongside Amazon’s 3D feature rollout, and pricing has become more competitive. Specialist agencies offering Amazon-optimized GLB models now exist at multiple price points, with some offering per-SKU packages starting around $75–$150 for simple products.

    Manufacturer files: the overlooked shortcut

    Many manufacturers — particularly in electronics, furniture, and consumer goods — already have CAD or 3D model files of their products that were used in the design and tooling process. Private label sellers sourcing from manufacturers, especially larger factories, should ask explicitly whether product 3D files are available. These files often need format conversion and texture cleanup before they meet Amazon’s GLB requirements, but the base geometry is already there — saving significant production time and cost.

    Amazon’s own AI generation tools

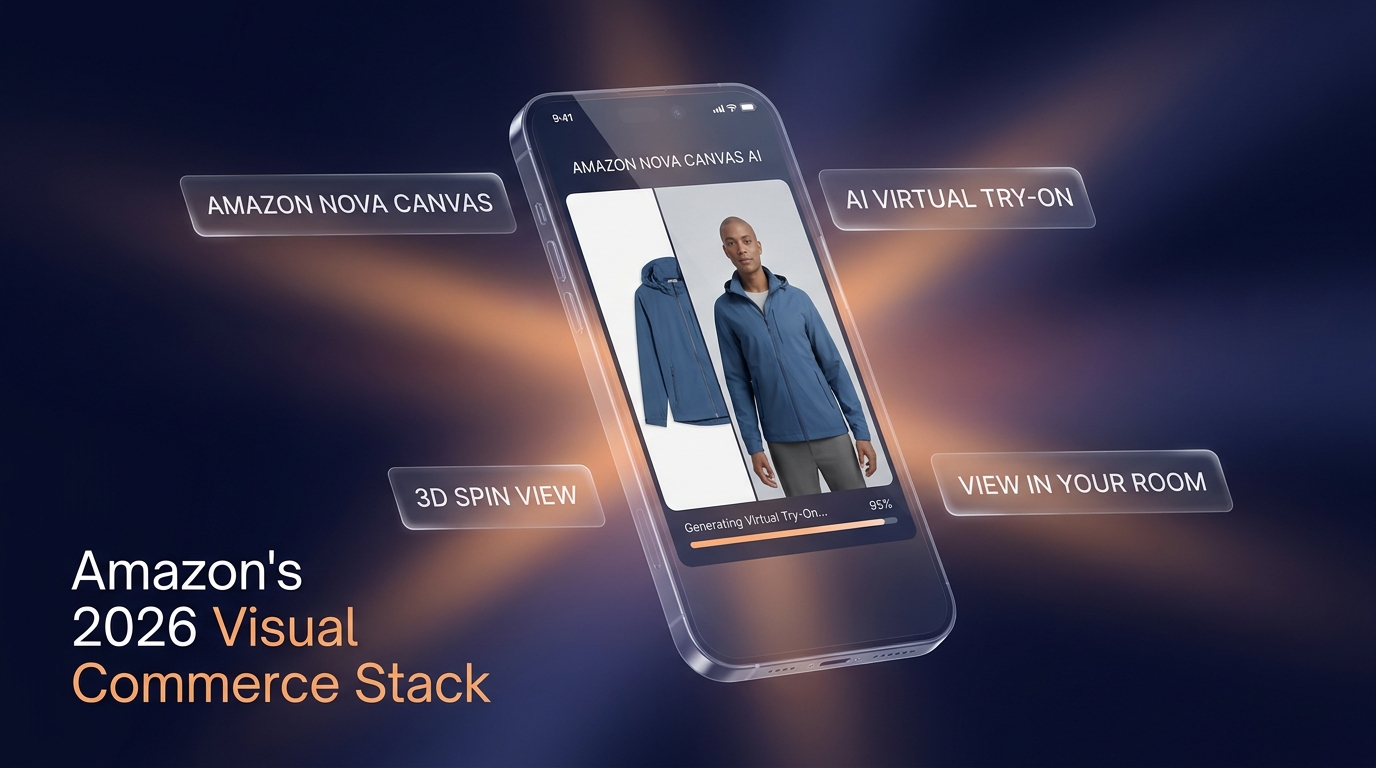
    Amazon has been expanding its internal tools for sellers. In 2026, Amazon’s generative AI capabilities — including the Nova Canvas model — include functionality that can synthesize product imagery, lifestyle images, and virtual try-on composites directly from existing product photos. These AI-generated assets are permitted in secondary images and A+ Content (not in the main product image, where Amazon’s white-background rules still apply). While AI-generated assets don’t yet fully replace professional 3D model uploads for spin views, they represent a growing toolkit for sellers who need to produce high volumes of visual content without per-image photography costs.

    A/B Testing Your Visual Assets: The Framework Serious Sellers Use

    Investing in 3D models and interactive imagery is a significant decision. The sellers who extract the most value from that investment are the ones who treat it as a controlled experiment rather than a one-time production project. Amazon’s “Manage Your Experiments” tool — available to brand-registered sellers in Seller Central — makes this unusually achievable without external testing platforms.

    What you can and cannot test

    Manage Your Experiments supports A/B testing on main product images, secondary images, titles, bullet points, and A+ Content. For the purposes of visual testing, the most impactful tests in order of return are:

    1. Main image variation — This is the highest-leverage test because it directly affects click-through rate from search results. A main image change affects every impression your listing receives. Test angle (3/4 vs. straight-on), background style (pure white vs. contextual lifestyle for categories where it’s permitted), and scale (product filling the frame vs. showing packaging or accessories).
    2. Secondary image sequence — Once the main image is optimized, test the order and composition of supporting images. Does a lifestyle image as the second image outperform an infographic? Does a size comparison image earlier in the stack reduce returns measurably?
    3. Spin view vs. no spin view — For sellers who have uploaded a 3D model, testing the before/after impact on unit session percentage (conversion rate) provides clean attribution data for the investment in 3D production.

    Test duration and traffic requirements

    Amazon recommends running experiments for a minimum of four weeks to achieve statistical significance. Shorter tests — two to three weeks — can provide directional signals on high-traffic ASINs, but should not be treated as conclusive. Manage Your Experiments requires sufficient traffic to generate statistically valid results; low-traffic ASINs may need to run experiments for eight to twelve weeks before the data is reliable. Amazon provides a confidence indicator within the tool that shows when the winning variant has reached statistical significance.

    The metrics that matter

    When evaluating the results of visual experiments on Amazon, focus on three metrics in descending order of priority:

    • Unit Session Percentage (conversion rate): The proportion of page visits that result in a purchase. This is the most direct measure of visual impact on buying behavior.
    • Click-Through Rate (CTR) from search: For main image tests, this measures how effectively the image draws shoppers from search results to the listing page. An image that generates 20% more clicks at the same conversion rate produces 20% more sales with no change to anything else.
    • Return rate over time: This is not visible in Manage Your Experiments directly, but should be tracked manually against visual changes. A main image that dramatically understates the product’s true appearance may lift short-term conversion while increasing returns — a net negative result that only appears if you’re watching the full picture.

    The most common A/B testing mistakes

    Sellers who run visual experiments on Amazon tend to make a handful of predictable errors. The most costly is testing multiple elements simultaneously — changing the main image, two secondary images, and the title at the same time. When one variant wins, you have no idea which change drove the result. The second most common mistake is ending experiments early when one variant is trending ahead — Amazon’s confidence indicators exist for a reason, and early results frequently reverse as more data comes in. Third is ignoring segment differences: a main image that converts well for mobile shoppers may underperform for desktop shoppers, and vice versa.

    Building an Image Stack That Converts at Every Stage of the Funnel

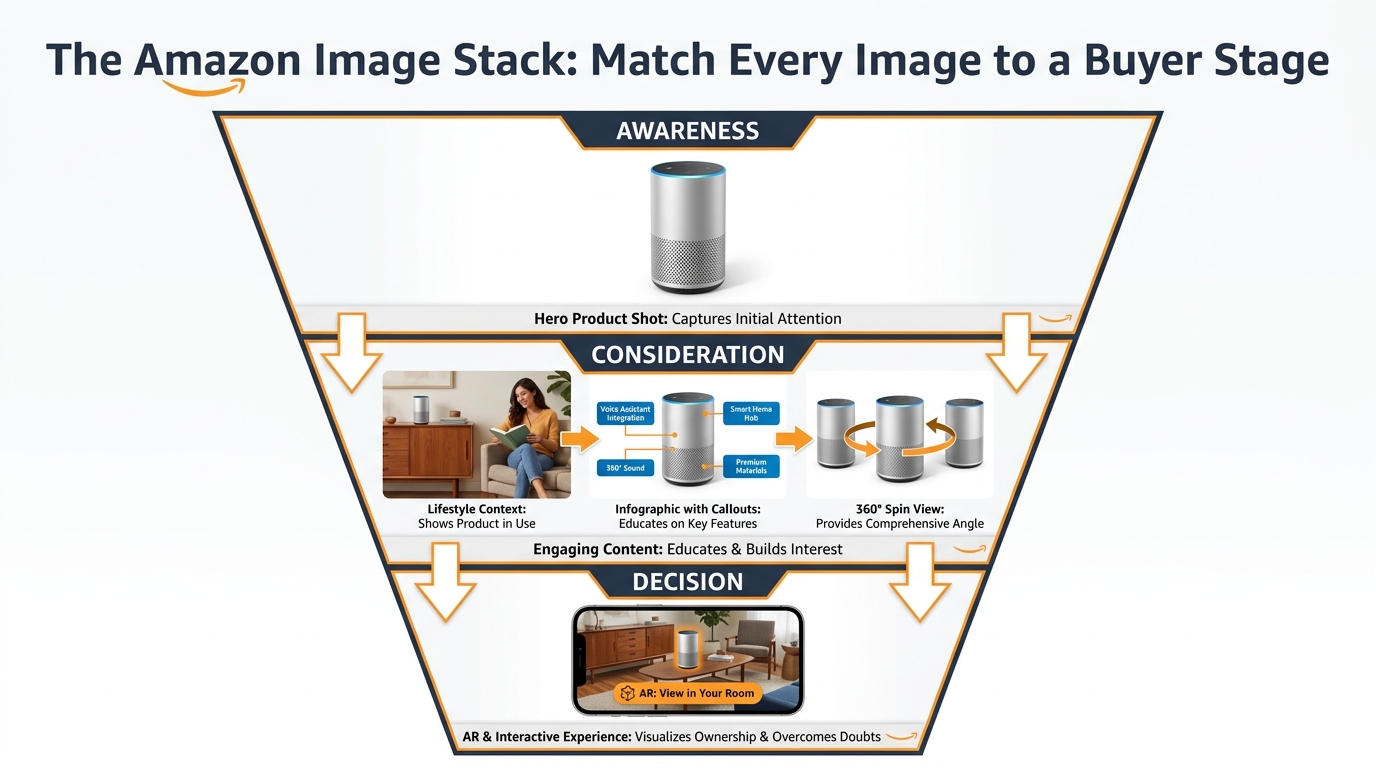
    One of the most useful frameworks for thinking about Amazon product imagery is the “image stack” — the idea that different images in your listing’s gallery serve different functions for shoppers at different stages of their decision process. A listing that treats all nine image slots as equivalent is leaving conversion on the table. A listing built with a deliberate stack converts at every stage.

    Amazon listing image stack: matching each image to a buyer stage from awareness through consideration to purchase decision

    Image 1 (Main Image): The click-driver

    This image has one job: stop the scroll and earn the click from a search results page. Amazon’s rules are strict — pure white background (RGB 255, 255, 255), no text, no graphics, no props, product occupying at least 85% of the frame. Within those constraints, the optimization levers are angle, lighting, and the visual hierarchy of the product itself. Professional lighting that creates depth and dimension consistently outperforms flat studio lighting. A 3/4 angle that shows depth and three-dimensionality typically outperforms a straight-on flat view. Research from eBay Labs found that listings with five to eight high-quality images see conversion lifts of up to 65% over listings with one or two images — and it starts with the main image earning the click.

    Images 2–3: The orientation and detail images

    Once a shopper clicks through to the listing, they need to build a comprehensive mental picture of the product. Images two and three should systematically cover angles and details that the main image could not. For most products, this means a back/side view, a close-up of the highest-value detail (a zipper, a connector port, a distinctive design element), or a scale reference shot that shows the product next to a hand, a common household object, or a labeled dimension overlay.

    Images 4–5: The lifestyle and context images

    Lifestyle images serve a different psychological function than product detail images. They don’t answer “what does this look like?” — they answer “can I picture this in my life?” Showing a product in a realistic, aspirational real-world setting gives shoppers permission to project themselves into ownership. A well-executed lifestyle image for a coffee mug is not a photograph of a coffee mug. It is a photograph of a morning — the mug is just in it. These images work particularly hard for home goods, apparel, fitness equipment, and any product with a strong lifestyle association.

    Images 6–7: The infographic images

    Amazon allows text, callouts, comparison charts, and labeled diagrams in secondary images (not the main image). These slots are best used for information that is difficult to convey in bullet points alone — size charts, compatibility guides, material comparisons, before/after results, or feature callouts with measurements. Mobile shoppers who don’t scroll to read bullet points often do engage with well-designed infographic images. Keeping text mobile-readable (minimum 16pt equivalent when viewed on a phone) is critical.

    Images 8–9: The trust and social proof images

    The final images in the stack can carry review highlights, certifications, brand story elements, or comparison grids against competing products (where Amazon policies permit). For newer brands or products in a trust-sensitive category (supplements, baby products, safety equipment), images that communicate third-party testing, material sourcing, or manufacturing standards do real conversion work in this position.

    Where the spin view fits in the stack

    When a 3D model is approved, Amazon adds the interactive spin view as an additional option within the image gallery — typically surfaced as an overlay on the main image or as a separate tab. It doesn’t replace any of the nine standard image slots. Think of it as image 10: a bonus interactive layer that sits on top of the static gallery. Shoppers who engage with the spin view demonstrate significantly higher purchase intent, making the spin view most valuable for mid-funnel shoppers who are seriously considering the product but not yet committed.

    What’s Coming Next: Amazon Nova Canvas, AI Try-On, and the 2026 Visual Stack

    The landscape of product visualization on Amazon is moving faster in 2026 than at any point in the platform’s history. Understanding where the technology is heading allows sellers to make smarter decisions about where to invest now and what to build toward.

    Amazon's 2026 visual commerce stack: Nova Canvas AI, virtual try-on, 3D spin view, and View in Your Room AR features

    Amazon Nova Canvas and AI-generated product imagery

    Amazon’s Nova Canvas generative AI model is available through AWS and increasingly integrated into seller-facing tools. Its capabilities relevant to product sellers include generating lifestyle background images around existing product shots (placing a product into a kitchen scene, a bedroom, or an outdoor setting without a physical photoshoot), creating color and variant images from a single physical product photograph, and — in its most advanced application — generating virtual try-on composites that show apparel or accessories on a model without a live photoshoot.

    These AI-generated images are explicitly permitted in Amazon listings as secondary images and in A+ Content, as of 2026 guidelines. They are not permitted as the main product image, which must still represent the actual physical product accurately. For sellers managing large catalogs with many color variants, the ability to generate secondary lifestyle images at scale using Nova Canvas — rather than paying for individual photoshoots per variant — represents a significant operational cost reduction.

    The Rufus AI layer and visual search

    Amazon’s Rufus AI shopping assistant, which became a significant part of the Amazon shopping experience in 2025, introduces a new dimension to visual content strategy. Data from the holiday quarter of 2025 showed that Rufus-assisted shopping sessions converted at 3.5 times the rate of non-assisted sessions. What this means for visual content: Rufus can engage with product images, A+ Content, and 3D model information when generating responses to shopper queries. Listings with richer visual assets give Rufus more accurate and detailed information to draw from, which translates into more confident and specific recommendations to shoppers asking questions like “show me sofas under $500 that would work in a small living room.”

    The trajectory of AR in Amazon’s roadmap

    Amazon has been incrementally expanding AR feature eligibility since “View in Your Room” launched in 2017. The pace of that expansion is accelerating. Fashion categories began receiving category-specific virtual try-on features starting in 2022 and have continued to expand. The direction of travel is clear: Amazon intends for AR visualization to be a standard feature across most high-consideration product categories, not a specialty feature for furniture alone.

    Sellers who invest in building accurate 3D models today are positioning their catalogs for multiple future feature rollouts, not just the current set of AR capabilities. A 3D model created and approved today becomes the foundation for whatever Amazon’s AR feature set looks like in 2027 and beyond — including features that don’t exist yet.

    The competitive window is narrowing

    The adoption curve for 3D models on Amazon follows the same pattern as virtually every new seller capability: early adopters gain disproportionate benefits while the feature is underused, then those benefits compress as adoption becomes mainstream and the feature becomes a parity expectation rather than a differentiator. Right now, 3D models and interactive spin views are genuinely differentiating. A listing with a spin view badge in a category where competitors have none stands out visibly. A “View in Your Room” badge on a furniture listing is still unusual enough that shoppers notice and engage with it.

    That window will not stay open indefinitely. The sellers who build this capability into their listing infrastructure in 2026 will have the advantage of experience, established workflows, and catalog coverage before it becomes a standard baseline expectation.

    The Practical Roadmap: Prioritizing Your Visual Investment

    For sellers looking at their catalog and trying to figure out where to start, the decision framework is straightforward. Not every ASIN warrants the investment in a 3D model. The right sequence is to audit, prioritize, produce, and iterate.

    Step 1: Audit your current visual assets against the benchmark

    Pull your unit session percentage (conversion rate) data from Seller Central for every ASIN in your catalog. Sort by traffic volume (highest-traffic listings first) and identify listings with conversion rates below your category benchmark. Amazon’s average conversion rate across categories runs 10–20%, with high performers exceeding 25%. Listings with significant traffic but below-average conversion are the highest-priority candidates for visual improvement.

    For each of those priority ASINs, answer three questions: Does this product have a spatial context problem (scale, fit, placement)? Is it in a category where interactive imagery is eligible? Does it currently have fewer than six substantive images? A “yes” to any two of those three flags an ASIN for immediate visual investment.

    Step 2: Fill the static image stack first

    Before investing in 3D model production, ensure every priority ASIN has a complete, high-quality static image stack. The data shows that moving from one or two images to six or more high-quality images delivers conversion improvements that rival or exceed the benefit of adding a spin view in isolation. The image stack is the foundation; interactive features are a multiplier on top of it.

    Step 3: Prioritize 3D models by category and revenue concentration

    Once the static stack is solid, prioritize 3D model production for your top revenue ASINs in categories where AR and spin views have the highest impact. Start with your two or three best-selling products in home goods, furniture, footwear, or electronics accessories — categories where the conversion data is clearest and the ROI is fastest. Use the learnings from those first submissions to refine your production workflow before scaling to a larger portion of your catalog.

    Step 4: Run controlled experiments and reinvest

    Use Manage Your Experiments to measure the actual conversion impact of new visual assets on each ASIN. Document the results — your unit session percentage before and after, your return rate, and your click-through rate from search. Use that data to build a business case for expanded 3D production across a wider set of ASINs, and to identify which categories and product types in your specific catalog respond most strongly to interactive imagery.

    Conclusion: The Sellers Who Win on Imagery Win on the Fundamentals

    It is easy to treat product photography as a cost of doing business — a box to check during listing setup, a budget line to minimize. The data tells a different story. In a marketplace where 92% of shoppers cite imagery as a top conversion factor, where a 22% conversion lift from interactive views is a documented and reproducible outcome, and where up to 40% of the return problem traces directly back to visual failures, imagery is not a cost. It is one of the most compounding investments a seller can make.

    The specific opportunity in 2026 is sharper than it has ever been. Amazon’s transition away from traditional 360° photography toward 3D models created a knowledge gap that filtered out many sellers who weren’t paying attention. The sellers who do understand how the system works today — the GLB file requirements, the Seller Central upload path, the category eligibility for “View in Your Room,” the A/B testing framework for measuring impact — are operating in a window where this capability is still genuinely differentiating rather than table stakes.

    That window will close. The sellers who build these capabilities into their standard listing workflow now will not only capture the conversion benefits today. They will also be positioned for whatever Amazon’s visual commerce infrastructure looks like next year, and the year after that — because the 3D models they create today are the foundation for every AR feature Amazon has not yet launched.

    The camera cannot replace the in-store experience entirely. But a well-built 3D model on an Amazon listing comes considerably closer than anything that came before it. The question is not whether your competitors will eventually figure this out. The question is whether you figure it out first.

    Key Takeaways

    • Amazon discontinued traditional 360° photography in January 2024. The interactive spin view now requires a 3D model in GLB/GLTF format.
    • 360°/interactive imagery lifts conversion rates 22–27% on average, with furniture seeing up to 250% in AR-specific studies.
    • 3D model and AR visualization reduce return rates by up to 40%, attacking one of the most significant hidden cost drivers for FBA sellers.
    • Brand Registry enrollment is required to upload 3D models. The file must be GLB or GLTF format, max 1 million triangles, with 2–10 reference photos submitted alongside.
    • “View in Your Room” is available for floor/table/wall-mounted products across major Amazon marketplaces, and averages a 9% sales improvement per Amazon’s own data.
    • Use Manage Your Experiments to measure conversion impact before rolling out 3D production across your full catalog.
    • AI tools including Amazon Nova Canvas now allow AI-generated lifestyle imagery in secondary slots and A+ Content — a significant catalog-scale cost reduction for variant-heavy listings.
    • The competitive window for 3D model differentiation is open now, and will narrow as adoption becomes mainstream.