Tag: Amazon DSP

  • SBV Budget Rebalancing: When Video Should Eat Search

    SBV Budget Rebalancing: When Video Should Eat Search

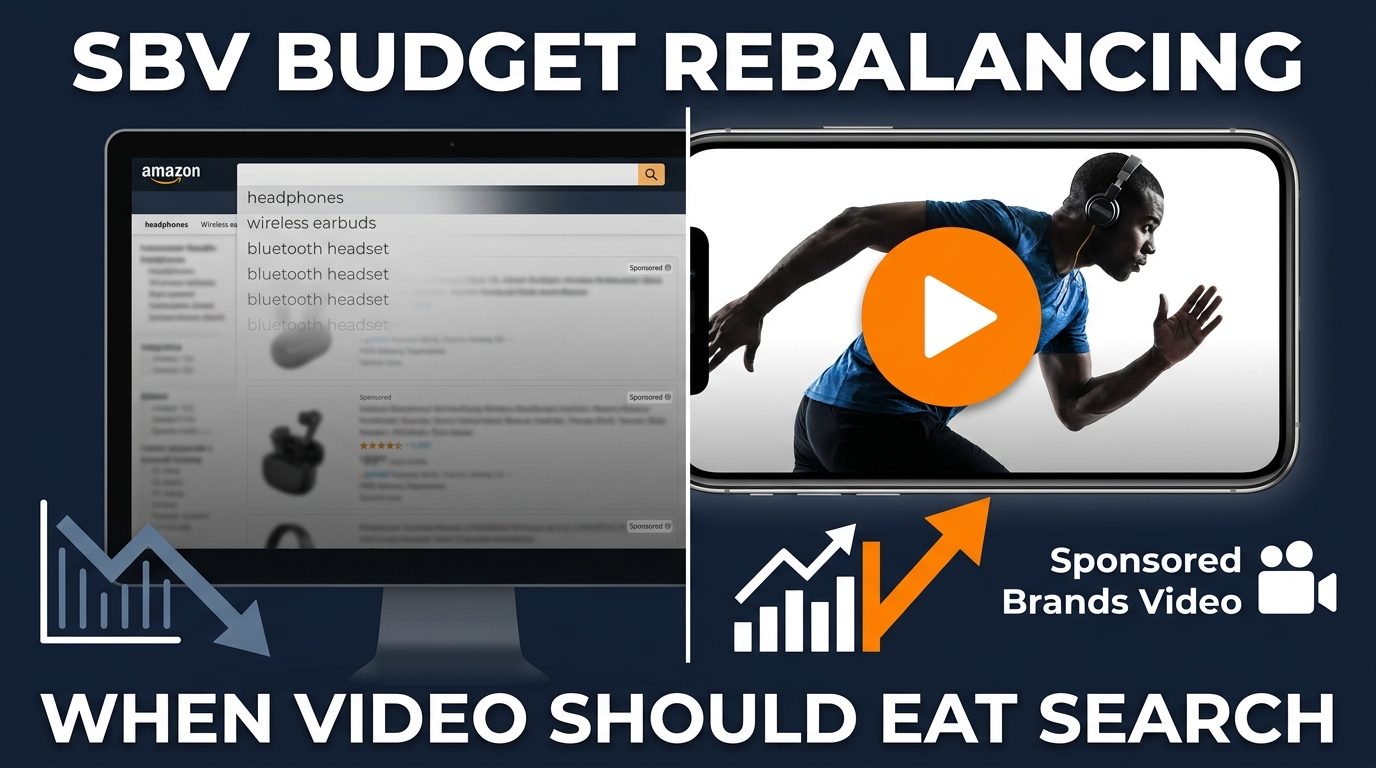
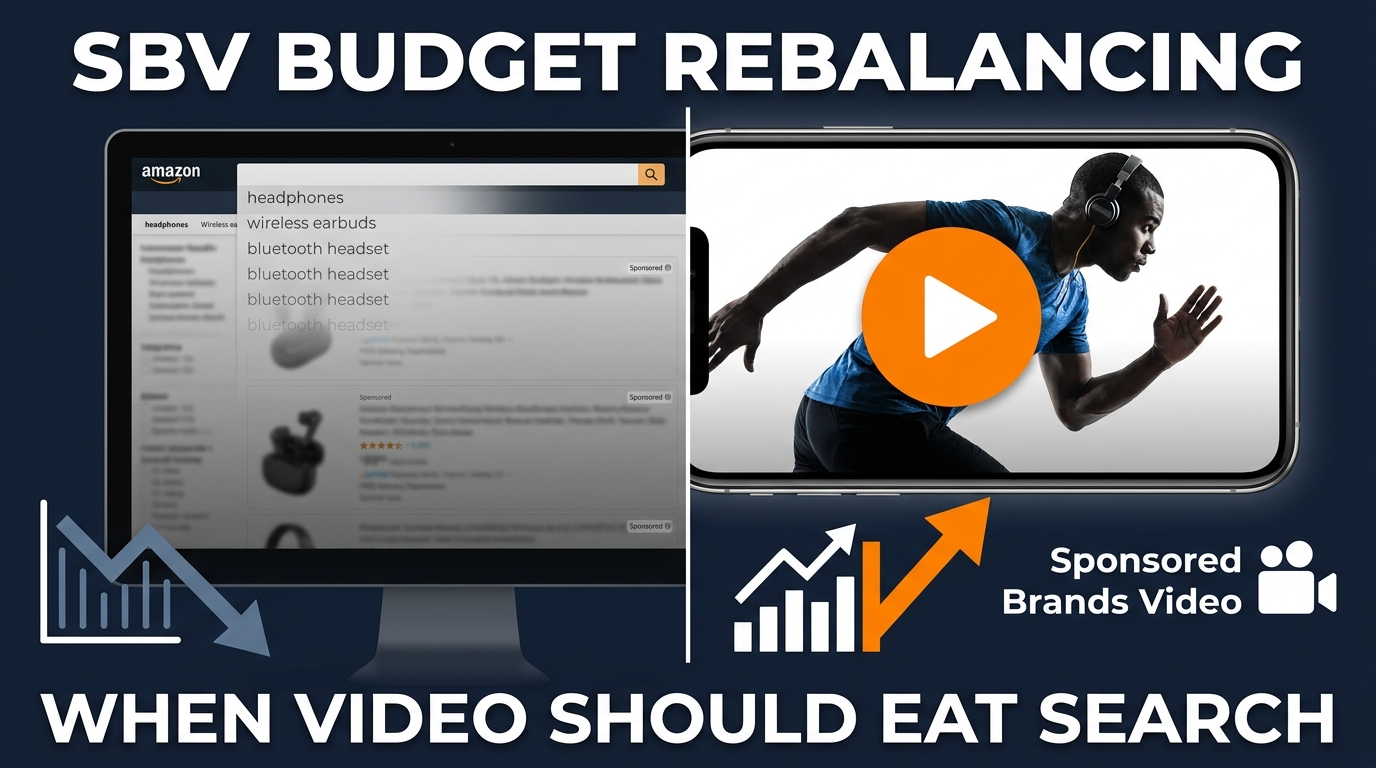
    SBV Budget Rebalancing: When Video Should Eat Search — split screen showing fading search ads and a bright product video playing on an Amazon search page

    Most Amazon PPC accounts are built on the same unspoken assumption: Sponsored Products is the engine, and everything else exists to support it. Sponsored Brands Video gets a sliver of budget — enough to say it’s being tested, not enough to actually pressure-test whether it should own a larger share. That assumption made complete sense in 2021. In 2026, it is quietly costing brands significant money every month they leave it unchallenged.

    The economics of Amazon search have shifted. Sponsored Products CPCs have climbed roughly 48% cumulatively since 2019, with competitive categories absorbing 10–15% annual increases that in some verticals reach 25–35% year-over-year. More budget into SP no longer reliably buys more proportional reach or sales. Instead, it increasingly buys position maintenance — defending placements brands already hold against competitors willing to outspend them by a few cents more per click.

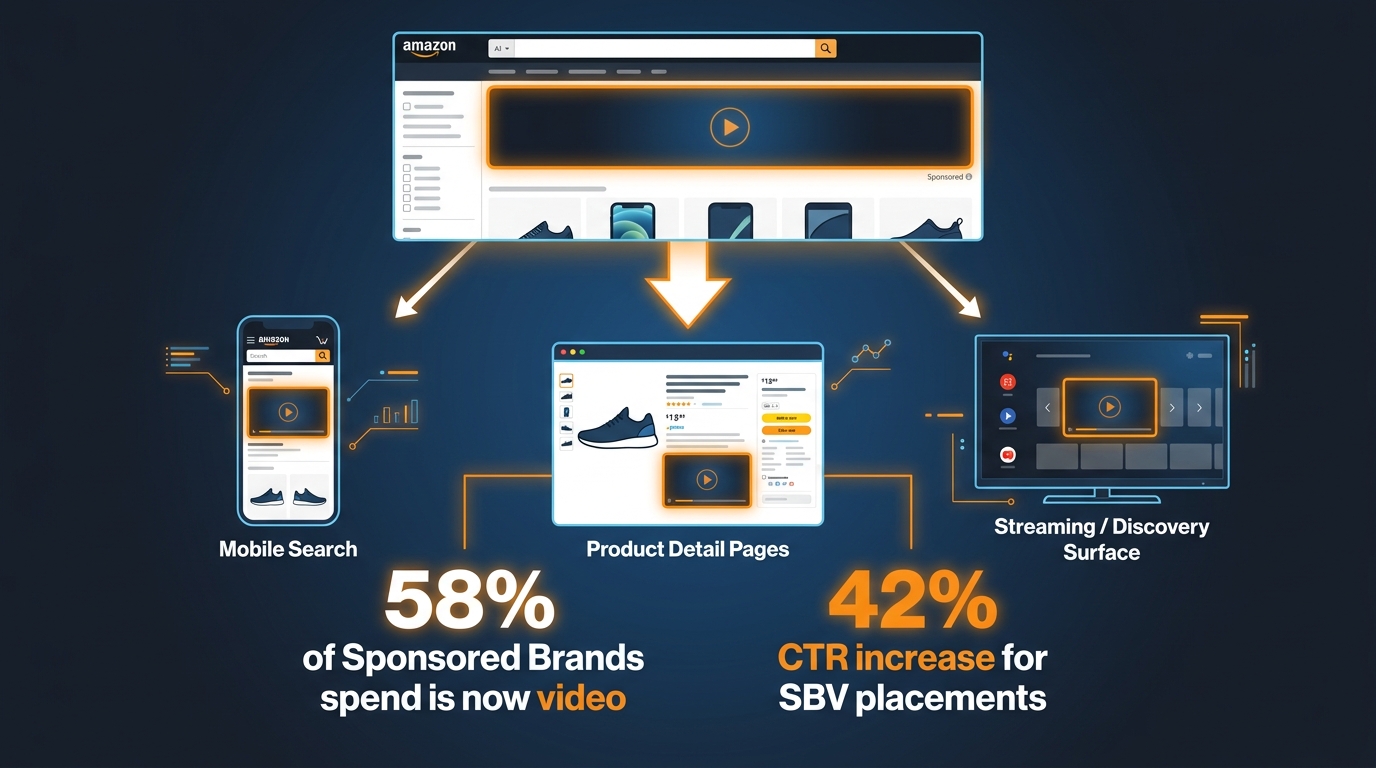
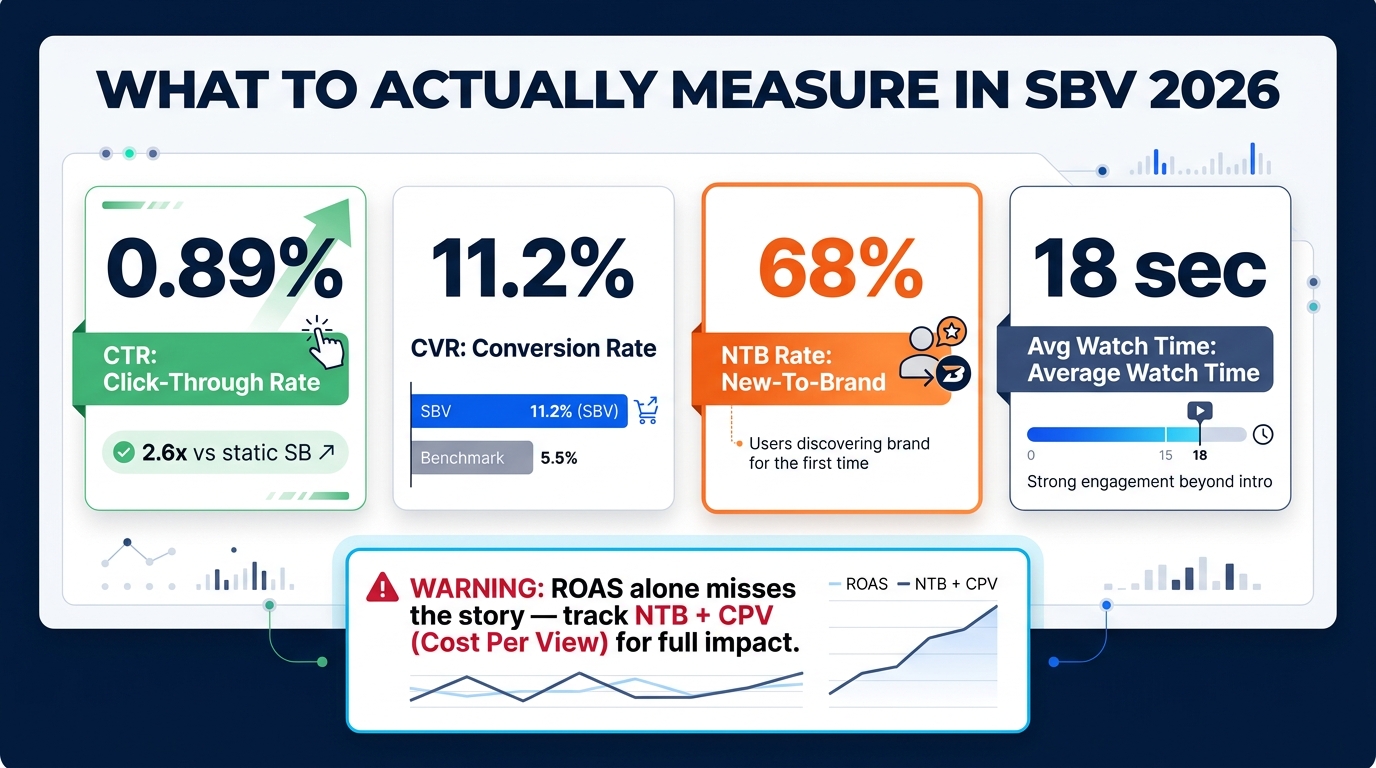
    Sponsored Brands Video, meanwhile, has moved from experimental format to dominant Sponsored Brands strategy. Advanced accounts now route 80–95% of their SB spend into SBV, and aggregate data from Q1–Q2 2026 shows SBV delivering approximately 1.6× the click-through rate and 1.3× the conversion rate of static Sponsored Brands. New-to-brand customer acquisition data — which SP campaigns simply cannot surface — reveals an entirely different story about where incremental growth is actually coming from.

    The question in 2026 is not whether video should take more of your search budget. The question is when — and what signals, metrics, and structures should govern that decision. This post works through all of it.

    The CPC Squeeze: What’s Actually Happening to Sponsored Products Economics

    Before you can make a rational case for moving budget out of Sponsored Products, you need to understand exactly what those rising CPCs are buying — and, more importantly, what they are no longer buying at the margin.

    The cost trajectory since 2019

    Amazon’s auction model for Sponsored Products has compressed advertiser efficiency consistently over the past several years. CPCs that averaged under $0.90 in many categories in 2019 now commonly land between $1.05 and $1.65 across mid-competition verticals, with high-competition categories — consumer electronics, supplements, home goods — pushing well beyond $2.00 for top placements on core keywords.

    The cumulative 48% CPC increase across the SP ecosystem since 2019 is not evenly distributed. Branded and category-defining keywords have absorbed the steepest increases, because these are the terms where auction pressure concentrates. Every established brand in a category is bidding on the same short-tail terms. The winner pays more than they did last year for the same position, and the loser goes back to the drawing board to figure out whether to overspend on defensive bidding or accept the erosion.

    What diminishing marginal returns looks like in practice

    Diminishing returns in SP aren’t always visible in the headline ROAS number — which is precisely why they’re dangerous. A Sponsored Products campaign can show a stable 4× ROAS while every additional dollar of budget added to it earns a 2× marginal return. The average looks fine. The marginal reality is quietly terrible.

    The clearest symptom is budget utilization behavior: campaigns that used to run out of budget by 11am now pace through the full day without exhausting their allocation, yet conversion volume hasn’t increased proportionally. This pattern signals that the algorithm is spending more carefully because incremental impression opportunities at acceptable CPCs are genuinely scarce. More budget cannot create more qualified search intent. It can only compete more aggressively for the intent that already exists — which, in a saturated category, means paying more to reach audiences that have already been heavily targeted.

    Position defense is not growth

    There is an important distinction between SP spend that acquires customers and SP spend that defends position. When a brand has established organic rank on its core keywords and runs SP to maintain those placements against competitor conquesting, a significant portion of that budget is effectively insurance rather than acquisition. That’s not inherently wrong — competitive defense has real value. But treating defensive SP spend and growth-oriented SP spend as a single undifferentiated pool is what causes accounts to chronically underinvest in formats that can actually expand the customer base.

    Recognizing the split between defensive and acquisitive SP spend is the first analytical step toward a rational SBV rebalancing conversation.

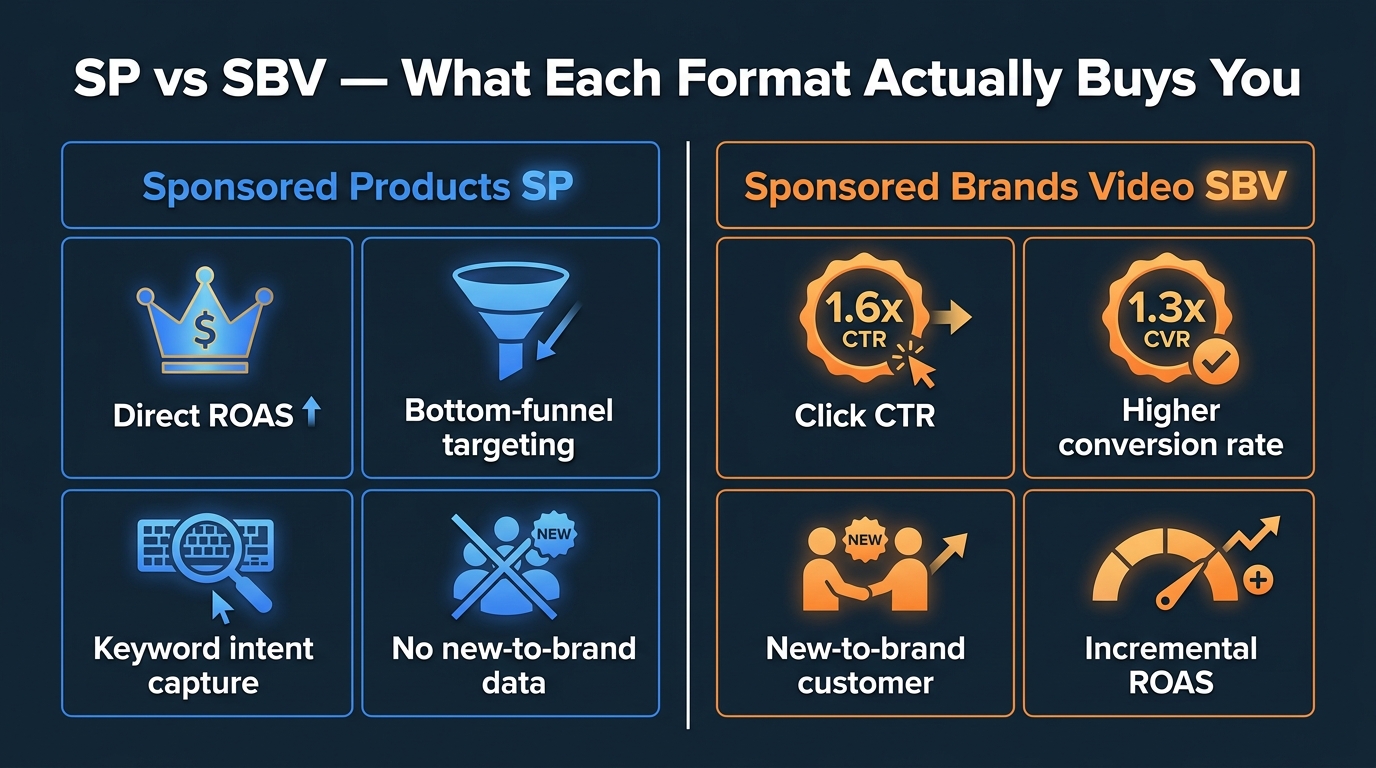
    Side-by-side comparison of Amazon Sponsored Products vs Sponsored Brands Video — CTR, CVR, new-to-brand reporting, and what each format actually buys

    SBV vs. SP: Understanding What Each Format Is Actually Buying You

    The mistake most advertisers make when comparing Sponsored Brands Video to Sponsored Products is treating them as substitutable formats competing for the same objective. They are not. They operate at different points in the shopping funnel, they deliver different types of value, and they should be evaluated on different metrics. Conflating them in a single ROAS comparison produces misleading conclusions in both directions.

    What Sponsored Products is purpose-built for

    Sponsored Products is, fundamentally, an intent-capture engine. When a shopper types “noise cancelling headphones under $100” into Amazon’s search bar, SP intercepts that expressed, bottom-of-funnel intent and places your product in front of someone who has already decided what category they’re buying from and roughly what they’re willing to spend. The conversion efficiency is high because the qualification work has already been done by the shopper’s own search behavior.

    This is why SP consistently posts higher direct ROAS than SBV in last-click attribution models. It’s not that SP is better at advertising — it’s that SP is fishing in a pond stocked with fish that are already hungry. The format deserves credit for execution, but the underlying demand isn’t being created by the ad. It existed before the ad appeared.

    The ceiling of SP efficiency is therefore largely determined by the volume of existing search intent in your category. Once you’ve captured the efficient portion of that intent, additional SP spend competes for diminishing returns: lower-intent queries, less-qualified audiences, and expensive defensive placements.

    What Sponsored Brands Video is actually doing

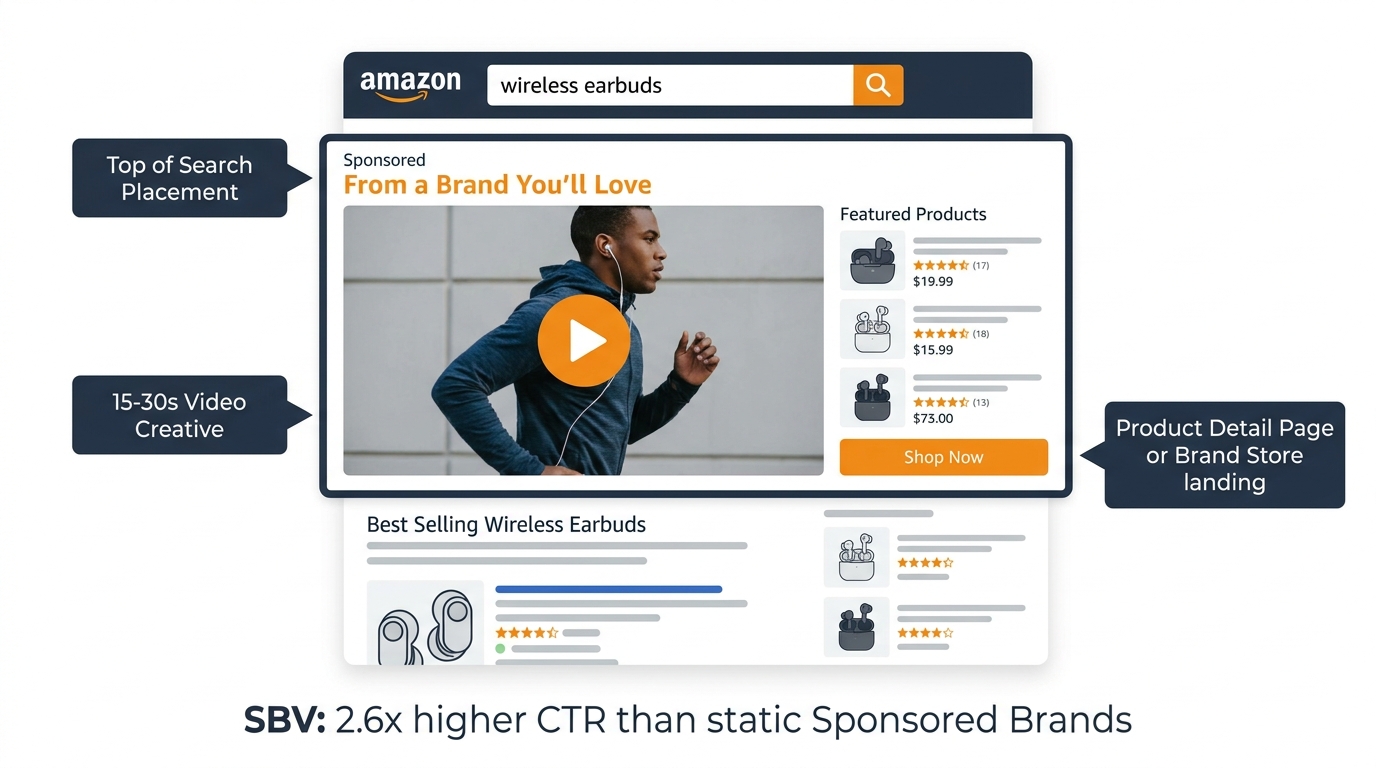
    SBV operates differently. It appears in the search results environment — same page, same intent context — but it functions more like an awareness and consideration tool than a pure intent-capture mechanism. The video format interrupts the browsing session in a way that a static text-and-image ad cannot. It communicates product context, brand story, and key differentiators within the first three seconds of autoplay, before the shopper has consciously decided to engage.

    That interruption capability is what produces SBV’s 1.6× CTR advantage over static Sponsored Brands. Shoppers who weren’t specifically looking for your brand get pulled into an evaluation they might otherwise have skipped. And because video conveys more information faster than a static thumbnail, the shoppers who do click arrive at the product detail page better informed — which supports the 1.3× CVR lift relative to static formats.

    Critically, SBV’s impact doesn’t stop at the direct conversion. Amazon’s new-to-brand reporting — available for Sponsored Brands formats but not Sponsored Products — reveals that SBV consistently drives a higher proportion of NTB customers than SP. These are shoppers who had never purchased from your brand in the prior 12 months. They represent genuine incremental growth, not recapture of existing demand.

    The attribution gap that makes SP look better than it is

    Standard Amazon attribution assigns conversion credit to the last-clicked ad before purchase. In a typical multi-touch journey, a shopper might see a Sponsored Brands Video ad that introduces your brand, spend four days considering the purchase, and eventually convert through a Sponsored Products click on a branded keyword. The SP campaign gets the credit. The SBV campaign that initiated the journey shows zero.

    This attribution structure systematically undervalues SBV’s contribution to overall account performance and overvalues SP’s apparent efficiency. Accounts that optimize exclusively on last-click ROAS will perpetually underinvest in the formats that drive top-of-funnel awareness — and then struggle to understand why their SP conversion rates gradually decline as branded search volume stagnates.

    The NTB Advantage: Why Standard ROAS Comparisons Lie

    New-to-brand metrics are one of the most underused data sets in Amazon advertising. They’re available for Sponsored Brands (including SBV) and Sponsored Display but absent from Sponsored Products entirely, which creates a structural information asymmetry that most advertisers never fully reckon with.

    What NTB metrics actually tell you

    Amazon defines a new-to-brand customer as someone who has not purchased from your brand in the previous 12 months. NTB metrics in the SBV reporting dashboard show you the number of NTB orders, NTB order revenue, NTB order rate, and the average NTB order value generated by your SBV campaigns.

    These numbers are important for one specific reason: they represent the only reliable proxy for incremental demand creation in your Amazon advertising account. Existing customers who repurchase would have done so with or without your ad. New-to-brand customers, by contrast, represent expansion of your addressable customer base — growth that almost certainly would not have occurred without the advertising exposure.

    A Sponsored Brands Video campaign showing a 2.5× direct ROAS with a 45% NTB order rate is delivering substantially more business value than its ROAS number suggests. A Sponsored Products campaign showing a 4.5× ROAS with a 12% NTB rate is largely servicing existing demand, not growing it. If you evaluate these two campaigns purely on ROAS, you’ll defund the one actually building your brand.

    Long-Term Sales ROAS and incremental ROAS frameworks

    Amazon has introduced Long-Term Sales ROAS (LTS ROAS) as an additional measurement layer, designed to estimate the incremental sales value of new-to-brand customers over a 12-month horizon after acquisition. The logic is straightforward: a customer acquired through SBV today may make five additional purchases over the next year. Attributing only the first purchase to the acquisition campaign dramatically understates its true economic contribution.

    Advanced advertisers are increasingly building incremental ROAS (iROAS) frameworks that incorporate NTB acquisition rates, estimated customer lifetime value, and downstream organic purchase behavior. When you run this math, SBV’s apparent ROAS disadvantage relative to SP frequently disappears — and in high-repeat categories like consumables, supplements, or pet products, SBV often shows superior iROAS precisely because it acquires customers who hadn’t yet been reached by SP.

    Practical NTB benchmarking

    If you’re running SBV campaigns and haven’t established NTB benchmarks, start there before making any rebalancing decisions. Pull 90-day NTB order rate, NTB order revenue, and NTB customer acquisition cost (NTB ad spend ÷ NTB orders) from your SBV campaigns. Compare NTB CAC to your estimated first-order margin to establish whether SBV is acquiring customers profitably. Then factor repeat purchase rate into a 12-month LTV calculation to determine the true value of each NTB customer generated by SBV.

    This analysis — not a surface-level ROAS comparison — is the analytical foundation for a defensible rebalancing decision.

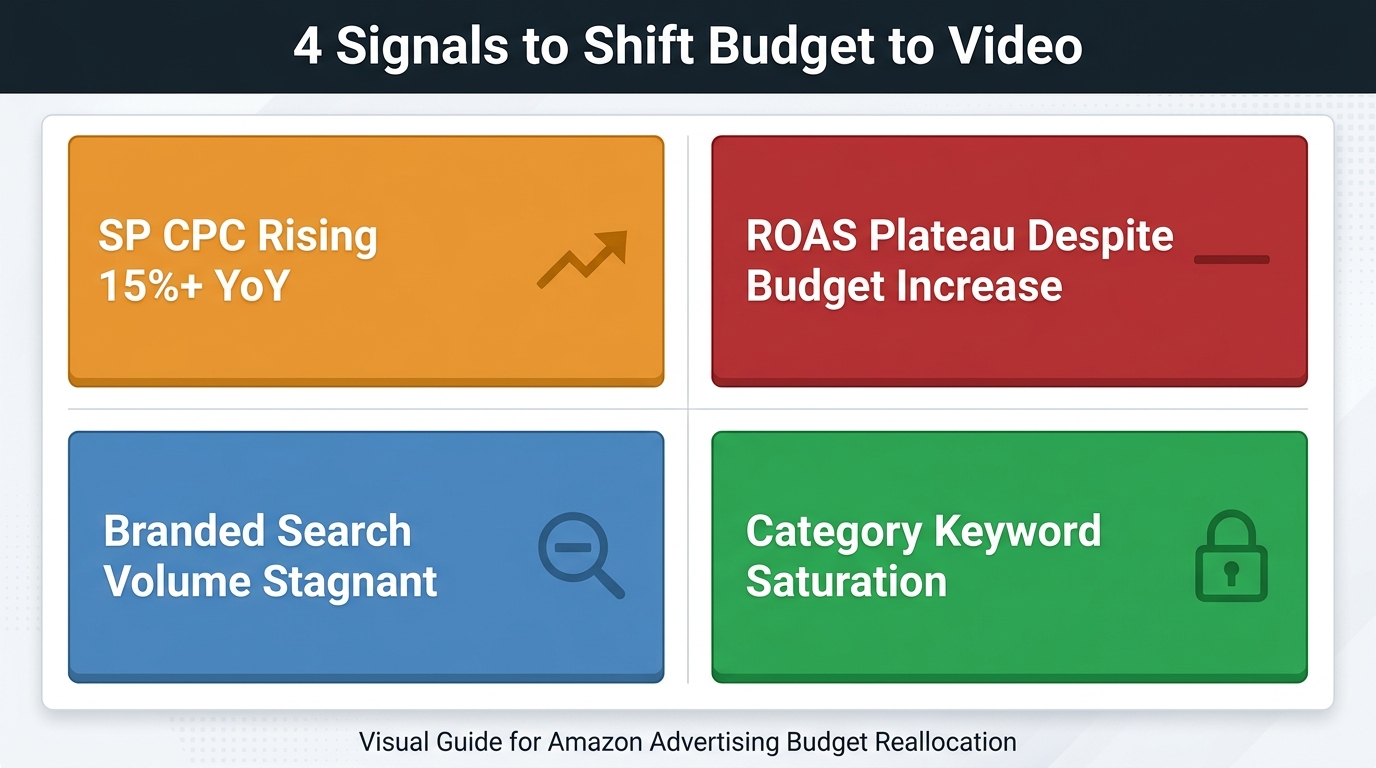
    Four-quadrant signal dashboard showing the four triggers for rebalancing Amazon advertising budget from Sponsored Products to Sponsored Brands Video

    Four Signals That Mean Video Should Take Search Budget

    The rebalancing decision is not a one-time judgment call. It’s a diagnostic exercise that should be repeated at least quarterly, because the conditions that justify or contra-indicate a budget shift change as your account matures, your category evolves, and the auction dynamics shift. These four signals are the most reliable indicators that SBV deserves a larger share of your total PPC budget.

    Signal 1: SP CPC rising faster than category average

    When your Sponsored Products CPC is climbing 15% or more year-over-year on your core non-branded keywords, you’re experiencing auction pressure that additional budget cannot solve. You can’t bid your way out of a structurally expensive auction. At some threshold — different for every category and margin structure — incremental SP spend crosses from profitable to value-destroying, even if the headline ROAS looks acceptable.

    The diagnostic is simple: calculate your marginal ROAS on SP for the most recent 30 days versus the previous 30-day period, controlling for seasonality. If marginal ROAS is declining while CPC is rising, you’re past the efficient frontier on SP. That’s budget that should be finding a more productive home, and SBV is the logical first candidate.

    Signal 2: ROAS plateau despite sustained budget increases

    If your SP budget has increased by 20% or more over the past 90 days and total account ROAS has stayed flat or declined, the auction has absorbed your incremental spend without delivering proportional output. This is the most visible symptom of SP saturation in a mature account — the algorithm has found the profitable keywords and is now spending more to maintain those positions rather than finding new, efficient opportunities.

    The distinction here matters: ROAS plateauing because of seasonal softness is different from ROAS plateauing because of structural auction saturation. The test is whether your impression share on core keywords is already high (above 70%) even before budget increases. If you’re already capturing the majority of available impressions at your target keywords, adding budget will mostly raise CPCs rather than meaningfully expand volume.

    Signal 3: Branded search volume is stagnant

    Organic branded search — shoppers typing your brand name directly into Amazon — is one of the cleanest leading indicators of brand health and future conversion efficiency. When branded search volume grows, your SP branded campaigns become cheaper and more efficient, and organic conversion rates typically improve alongside. When branded search volume stagnates, it signals that your brand is failing to capture new customers at the top of the funnel who would eventually become high-value branded searchers.

    SBV’s primary mechanism for building branded search volume is exposure at the discovery stage: shoppers who see your SBV ad, don’t click immediately, but remember the brand name well enough to search for it specifically in a later session. This halo effect is real and measurable — brands that add SBV to an SP-only strategy consistently report 10–18% branded search volume increases over 90-day periods, which compounds into long-term organic rank improvements and reduced branded CPC.

    Signal 4: Category keyword saturation with available SBV placements

    Not all categories reach SBV saturation at the same pace. If your category analysis shows that fewer than 30–40% of search results pages in your core keywords display SBV ads — or that the same two or three competitor brands own the SBV slots consistently — there is an immediate placement arbitrage available. SBV CPCs in undersaturated categories frequently run materially lower than SP CPCs for comparable keyword targets, while delivering superior CTR and reaching audiences at a different decision-making stage.

    This asymmetry won’t last. As more advertisers recognize SBV’s efficiency advantage, auction pressure on video placements will increase. The window for low-CPC SBV entry into competitive categories is narrowing — which means accounts that act on this analysis in 2026 will establish creative assets, quality scores, and historical performance data that provide durable advantages before costs normalize.

    The Rebalancing Math: How to Calculate the Right Budget Split

    The portfolio math for SBV allocation in 2026 has crystallized around some fairly consistent benchmarks from advanced accounts. But those benchmarks are outputs of a calculation, not inputs to it. Understanding the calculation is more durable than memorizing the numbers.

    The standard advanced account structure

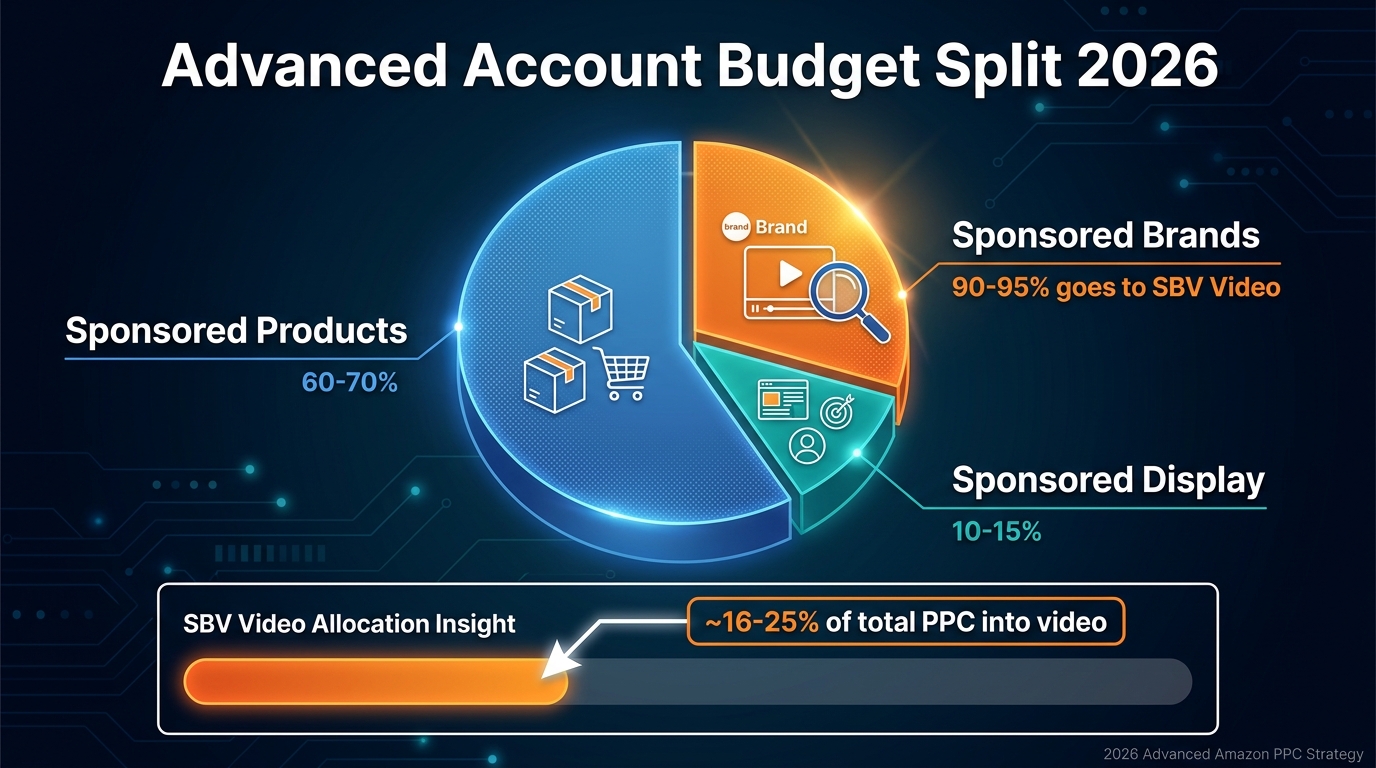
    Data from well-optimized Amazon PPC accounts in 2026 clusters around a consistent portfolio structure: 60–70% of total ad spend in Sponsored Products, 20–25% in Sponsored Brands, and 10–15% in Sponsored Display. Within the Sponsored Brands allocation, 80–95% flows to Sponsored Brands Video rather than static Sponsored Brands headline ads.

    Working through that math: if SB receives 20–25% of total spend and 90% of that goes to SBV, then SBV is absorbing roughly 18–22% of total PPC budget in advanced accounts. For a brand spending $50,000 per month in Amazon advertising, that’s $9,000–$11,000 per month in SBV — a number that would have seemed aggressive for most advertisers three years ago and is now increasingly treated as the baseline for accounts that take video seriously.

    How to calculate your specific rebalancing threshold

    Rather than adopting aggregate benchmarks wholesale, calculate your account-specific rebalancing ceiling using this structure. First, identify the portion of your current SP spend that is defensive rather than acquisitive — budget spent maintaining top-of-search positions on branded keywords and saturated category keywords where incremental ROAS has demonstrably declined. This is your rebalancing pool: spend that is currently delivering below-marginal returns in SP and could potentially generate higher incremental value in SBV.

    Second, establish your SBV capacity constraint. SBV budget can only be effectively deployed if you have sufficient creative assets and keyword targeting infrastructure to utilize it without quality degradation. Running more budget through a single SBV campaign with one creative asset leads to frequency fatigue and creative decay. The practical rule is that each distinct SBV creative should support no more than $3,000–$5,000 in monthly spend before performance begins to diminish from repetition.

    Third, calculate the incremental NTB acquisition opportunity. Using your current SBV NTB rate and NTB CAC, estimate how many additional new-to-brand customers the rebalanced budget would generate per month. Multiply by your 12-month LTV estimate. If that LTV figure exceeds the marginal ROAS you’re generating from the SP spend you’d be reallocating, the math supports the shift.

    The 5–10% incremental rule

    Whatever the calculation suggests, the execution should be gradual. The consensus among advanced Amazon PPC managers in 2026 is that budget shifts exceeding 10% of total account spend in a single adjustment period create performance instability. Amazon’s campaign algorithms require observation data to optimize new bid levels and placement priorities effectively. Large sudden budget changes can trigger algorithmic recalibration periods — sometimes manifesting as temporary performance dips — that make it impossible to evaluate whether the shift was genuinely beneficial or simply disruptive.

    Move 5–10% of SP budget into SBV over each 30-day period. Observe for 30 days before making the next adjustment. This pacing gives algorithms time to stabilize, gives you clean data to evaluate at each stage, and limits downside exposure if the initial rebalancing reveals unexpected issues with creative quality or keyword targeting in the SBV campaigns.

    Budget allocation pie chart for advanced Amazon PPC accounts in 2026 showing recommended split between Sponsored Products, Sponsored Brands Video, and Sponsored Display

    Creative That Earns the Budget: What SBV Needs to Perform

    Budget rebalancing without creative infrastructure is a money-wasting exercise. SBV is an unforgiving format in one specific respect: the creative asset is the campaign. You can build technically sound targeting, competitive bid levels, and a sensible keyword strategy, and still generate mediocre SBV results if the video asset fails to earn attention in the first three seconds. This is categorically different from SP, where a strong main image and price point do the majority of the conversion work.

    The first three seconds are non-negotiable

    SBV ads autoplay when approximately 50% of the unit is visible on screen, without sound, on mobile and desktop. The shopper did not choose to engage with your ad. The ad appeared in their scroll path, and they have approximately two to three seconds before their thumb continues to the next result. In that window, the video must accomplish one thing: show the product doing something interesting enough that stopping and watching more seems worthwhile.

    This sounds obvious. It is routinely violated. Common first-three-second failures include: opening with a logo or brand name before the product appears; slow-building lifestyle montages that haven’t shown the physical product by second four; text-heavy title cards that require reading rather than watching; and transitions that obscure the product during the critical hook window.

    Amazon’s own research supports the product-first principle: videos that show the core product within the first two to three seconds consistently outperform those that build to the product reveal. The mechanism is practical — a shopper searching for “stainless steel cookware” who immediately sees a gleaming pan being used on a stovetop has received immediate confirmation that this ad is relevant to their intent. A shopper who sees a nature landscape opening sequence has not.

    Design for mute: captions are not optional

    Because SBV autoplays without sound, every video that relies on spoken information to communicate its core message is operating at a structural disadvantage. The shopper who watches a 15-second SBV ad on mute and has no idea what the product does or what makes it different from competitors is not going to tap to enable audio — they’re going to scroll to the next result.

    Bold, high-contrast text overlays that mirror or supplement the visual content are the standard approach for mute-first design. Key benefit statements, differentiators, size/quantity callouts, and pricing signals should all appear as on-screen text at the relevant moment in the video. Captions for spoken content are a secondary measure — effective, but not a substitute for text overlays designed specifically for a sound-off experience.

    Runtime, refresh cadence, and creative volume

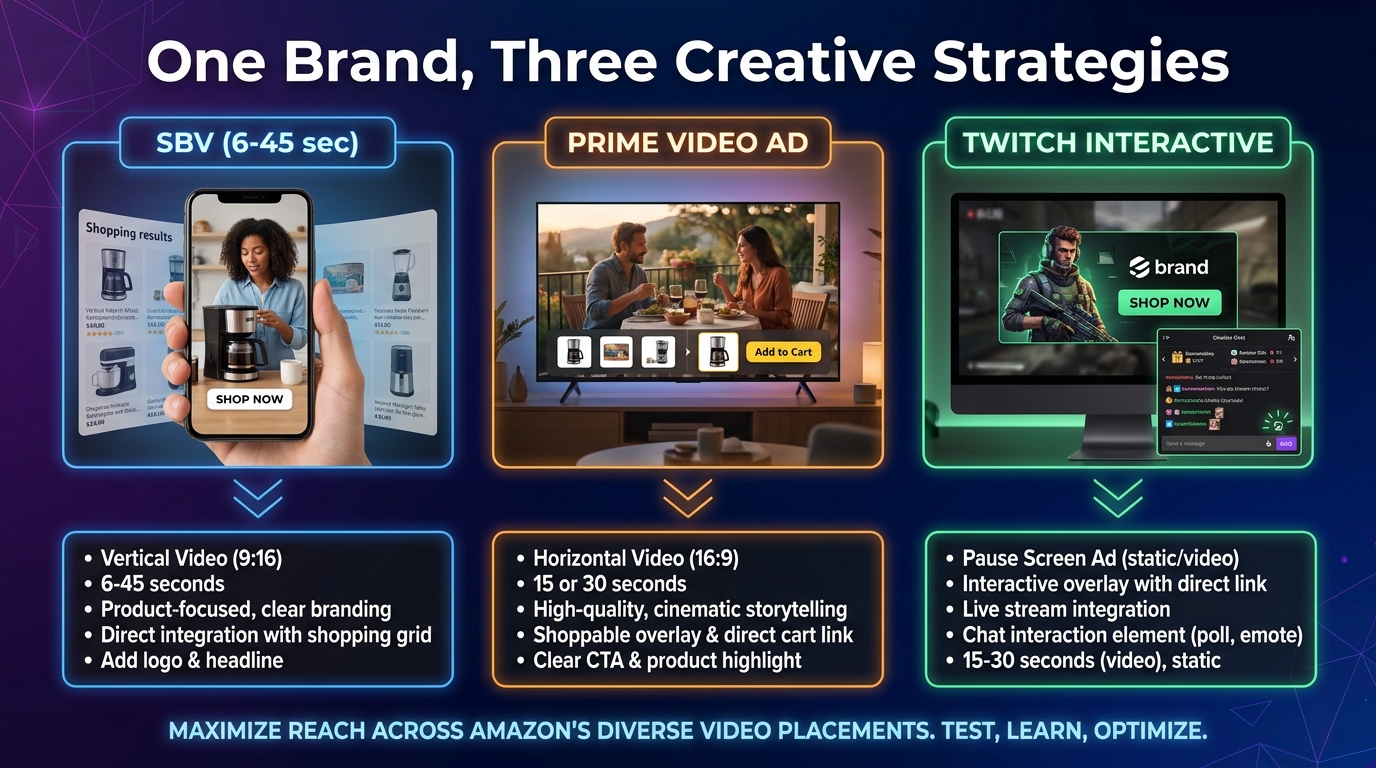
    Current SBV best practice benchmarks in 2026 center on videos in the 15–30 second range, with 15–20 seconds outperforming longer formats in most categories where the product benefit can be communicated concisely. Categories with complex products — technical equipment, multi-component systems, software-adjacent products — support slightly longer formats, but even these rarely benefit from videos exceeding 45 seconds in the search results environment.

    Creative decay is one of the most underappreciated performance risks in SBV campaigns. A video that drives strong CTR in month one will typically show meaningfully declining performance by month two or three as the same audiences see it repeatedly. Advanced SBV accounts maintain a minimum of two to three active creative variants per campaign and rotate in new assets at least every 30 days. Some highly scaled accounts run monthly creative production cycles specifically to prevent fatigue-driven performance erosion.

    Amazon’s introduction of its own Video Generator tool for Sponsored Brands campaigns in 2026 has lowered the production barrier for smaller advertisers, enabling basic video creation from existing product images and text. While this tool won’t replace purpose-built video production for established brands, it removes the “we don’t have video assets” constraint for brands that have been deferring SBV entry for creative-cost reasons.

    Multi-ASIN vs. single product SBV strategy

    SBV campaigns can showcase a single product or a curated selection of up to three products in a store spotlight format. The strategic choice between these approaches has meaningful implications for budget efficiency. Single-product SBV is typically more conversion-focused: the ad communicates one clear value proposition, and the click lands on a specific ASIN detail page. Multi-product SBV is more acquisition-focused: it shows category breadth, drives traffic to a custom landing page or brand store, and is more likely to drive NTB exploration across the catalog.

    The general guidance from 2026 account data is to run single-product SBV for your highest-priority ASINs where conversion rate optimization is the objective, and multi-product SBV when the goal is brand building and catalog discovery among new-to-brand audiences. Both have a place in a mature SBV portfolio — but mixing objectives within a single campaign makes it impossible to evaluate performance accurately.

    Attribution Reality: Measuring SBV’s True Contribution

    The measurement challenge for SBV is not technically complex — the tools exist. The challenge is organizational: most Amazon PPC reporting dashboards are built around last-click ROAS, which is the metric most brand managers and finance teams understand and can benchmark against. Introducing incremental ROAS, NTB metrics, and halo effect analysis requires either building new reporting infrastructure or doing a significant amount of educational work with stakeholders who have strong intuitions about what “good” ROAS looks like.

    Building an incrementality baseline

    The first step in accurate SBV measurement is establishing what your account looks like without SBV. If you’ve been running SBV campaigns for six months or more, you can do a retrospective analysis by pulling weekly performance data and identifying periods when SBV budgets were paused or significantly reduced — then examining what happened to SP conversion rates, branded search volume, and overall account ROAS during those periods. If SBV pauses correlate with degraded account-level performance even when SP budgets were held constant, that’s directional evidence of SBV’s incremental contribution.

    For accounts building a prospective incrementality baseline, the cleanest methodology is a geo-based holdout test: run SBV in specific states or regions while suppressing it in matched control regions, with SP budgets held constant across both groups. Comparing sales velocity, branded search growth, and NTB acquisition rates between test and control groups over 30–60 days gives you a reasonably clean incrementality estimate without touching your core SP performance.

    The branded search lift metric

    One of the most practical proxies for SBV’s halo contribution is branded search volume lift. Track your branded keyword impression volume in Sponsored Brands reports before and after SBV campaigns launch or scale. If branded search impressions increase materially — even if your branded SP bids haven’t changed — SBV is generating awareness that converts to intent in later sessions. This metric isn’t available in a single report; it requires pulling SB impression data over time and correlating it with SBV spend levels. But it’s tractable, and it tells a clean story that’s easy to communicate to stakeholders who aren’t fluent in incrementality methodology.

    What to actually report to decision-makers

    For internal reporting purposes, present SBV performance across three distinct metrics tiers: direct performance (CTR, CVR, direct ROAS), new-to-brand performance (NTB order rate, NTB revenue, NTB CAC), and brand health performance (branded search volume trend, branded keyword CPC trend). Showing all three simultaneously makes it impossible to evaluate SBV in purely direct-ROAS terms — which is the framework that leads to chronic SBV underinvestment — and creates a richer, more accurate picture of what the format is delivering to the business.

    How Rufus and Alexa for Shopping Change the Video Equation

    Amazon’s AI-powered shopping assistant — initially launched as Rufus and increasingly integrated across the shopping experience under the Alexa for Shopping umbrella — is adding a new dimension to the SBV value calculation. The precise mechanics of AI-assisted ad placement are still evolving and not fully documented by Amazon, but the directional trends are clear enough to inform 2026 budget strategy.

    Conversational discovery and Sponsored Prompts

    Rufus/Alexa for Shopping processes conversational queries — “What’s the best protein powder for building muscle?” — and generates product recommendations that blend organic results with Sponsored Brands and Sponsored Prompts placements. The AI’s intent-matching capability creates a new discovery surface that is qualitatively different from keyword-triggered search: the shopper is expressing category interest through a conversational format rather than entering a precise search query, which means the discovery mechanism rewards brand awareness and category association more than keyword optimization.

    SBV has a structural advantage in this environment. A brand that has generated meaningful awareness and association with a category through SBV campaigns — impressions, video completions, click-throughs — builds signals that inform the AI’s understanding of brand-category relevance. Brands that exist only as keyword-targeted SP listings have a thinner signal footprint for the AI to work with. As conversational discovery grows as a share of total Amazon shopping sessions, the brands with richer upper-funnel data will have compounding advantages in AI-assisted placement.

    Video surfaces in AI-driven shopping experiences

    Amazon has begun integrating video ad units into AI-assisted discovery surfaces alongside traditional search results. The trajectory suggests increasing video representation in these environments over time, consistent with broader platform trends toward richer media in shopping interfaces. Brands that have established SBV creative assets, performance history, and quality signals in 2026 will be better positioned to occupy these placements as they scale, compared to brands that delay video entry and attempt to build that infrastructure later in a more competitive environment.

    What this means for the rebalancing decision

    The Rufus/Alexa for Shopping trend reinforces the rebalancing case without transforming it. The core argument for shifting budget from SP to SBV — based on CPC economics, NTB acquisition, and incremental ROAS — is already compelling on its own terms. The AI shopping assistant dynamic adds a forward-looking dimension: the investment in SBV creative and performance history being made today is building assets that will compound in value as Amazon’s AI-driven discovery surfaces grow in importance. Brands that treat SBV as an experimental supplement to SP will find themselves starting from scratch in that future environment.

    Common Rebalancing Mistakes (And How to Avoid Them)

    Budget rebalancing decisions are easy to get wrong even when the strategic logic is sound. These are the most consistent failure modes observed in accounts that attempt SBV rebalancing without adequate preparation.

    Moving budget before creative is ready

    The most common and costly mistake is reallocating SP budget into SBV before the SBV creative infrastructure is genuinely ready to absorb it efficiently. Launching a $10,000/month SBV budget against a single 30-second video with mediocre production quality will produce poor results — not because SBV doesn’t work, but because the creative is the limiting factor. Poor SBV results often lead to the incorrect conclusion that “video doesn’t work for our category” and a reversion to SP-heavy allocation, when the actual lesson is that video requires creative investment proportional to the budget behind it.

    The rule of thumb: don’t move more than $3,000–$5,000 per month into SBV per creative asset until you’ve validated CTR and CVR performance on that asset at lower spend levels. Scale budget only behind creative that has demonstrated it can earn attention.

    Evaluating SBV on the same metrics as SP

    Applying SP’s ROAS target to SBV campaigns is analytically incorrect and will systematically prevent SBV from reaching budgets where it can generate its distinctive value. SBV typically shows 15–30% lower direct ROAS than SP in the same account — not because it’s less efficient, but because it’s doing different work. Holding SBV to the same ROAS threshold as SP ensures that every marginal dollar of SBV budget that exceeds that threshold gets cut before the campaign has the scale to generate NTB acquisition at volume.

    Set separate performance targets for SBV based on NTB-adjusted metrics, not direct ROAS. A reasonable starting threshold: SBV ROAS + (NTB order rate × estimated NTB LTV) should exceed SP marginal ROAS. If the combined metric clears the bar, the SBV budget is justified even if the direct ROAS looks weaker in isolation.

    Rebalancing during peak seasons

    Budget structure changes made during Q4, Prime Day, or other high-velocity periods introduce additional variables that make it impossible to evaluate whether performance changes are driven by the rebalancing or by the seasonal dynamics. Always conduct rebalancing tests during stable, predictable demand periods. Use Q1 and Q3 for the bulk of your structural budget experimentation. Apply the learnings from those experiments to your Q2 and Q4 budget configurations, rather than running live experiments during your most consequential trading periods.

    Ignoring keyword strategy in SBV campaigns

    SBV is a keyword-targeted format. The quality of keyword selection in SBV campaigns matters significantly for both performance and cost efficiency. A common mistake is targeting only the same core category keywords in SBV that are already heavily contested in SP — which drives up CPCs, reduces the efficiency advantage of SBV, and limits the format’s reach to audiences the account is already aggressively targeting through SP.

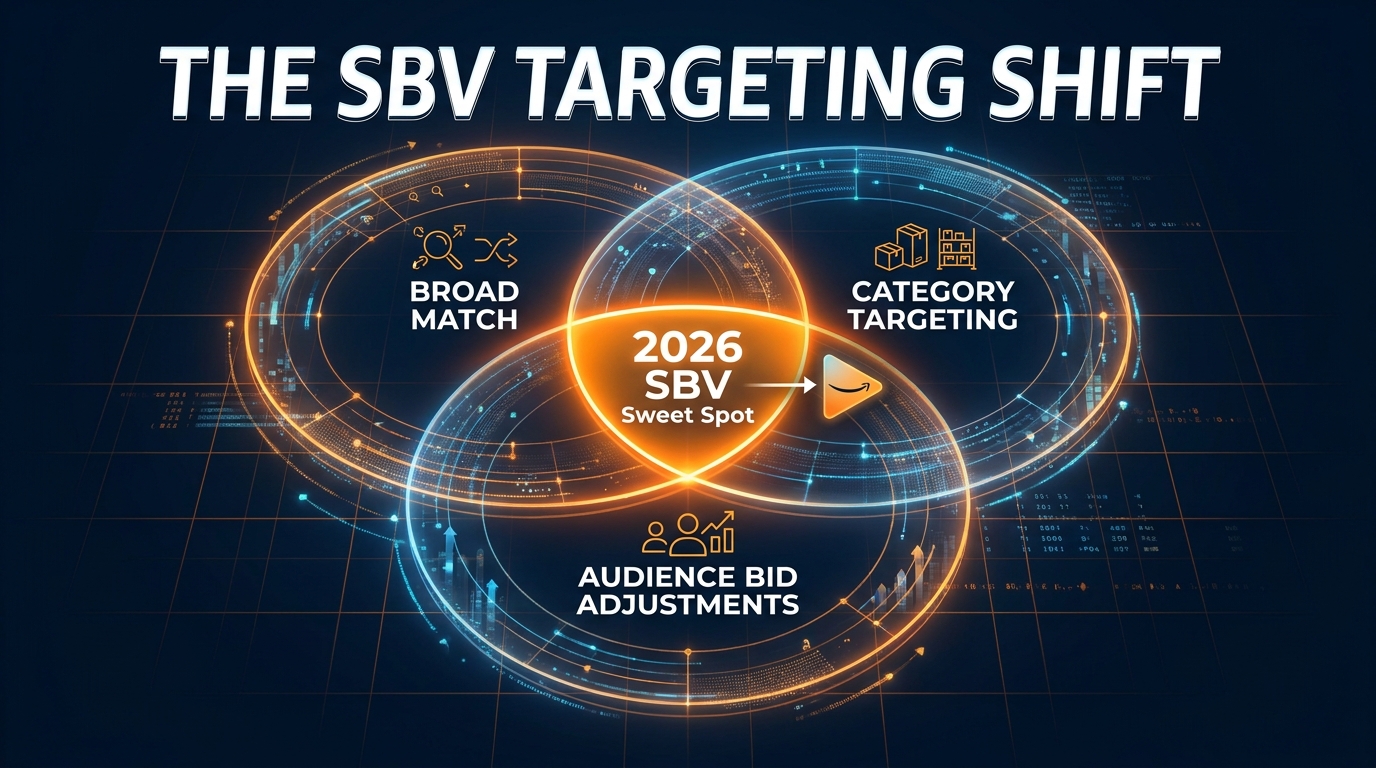
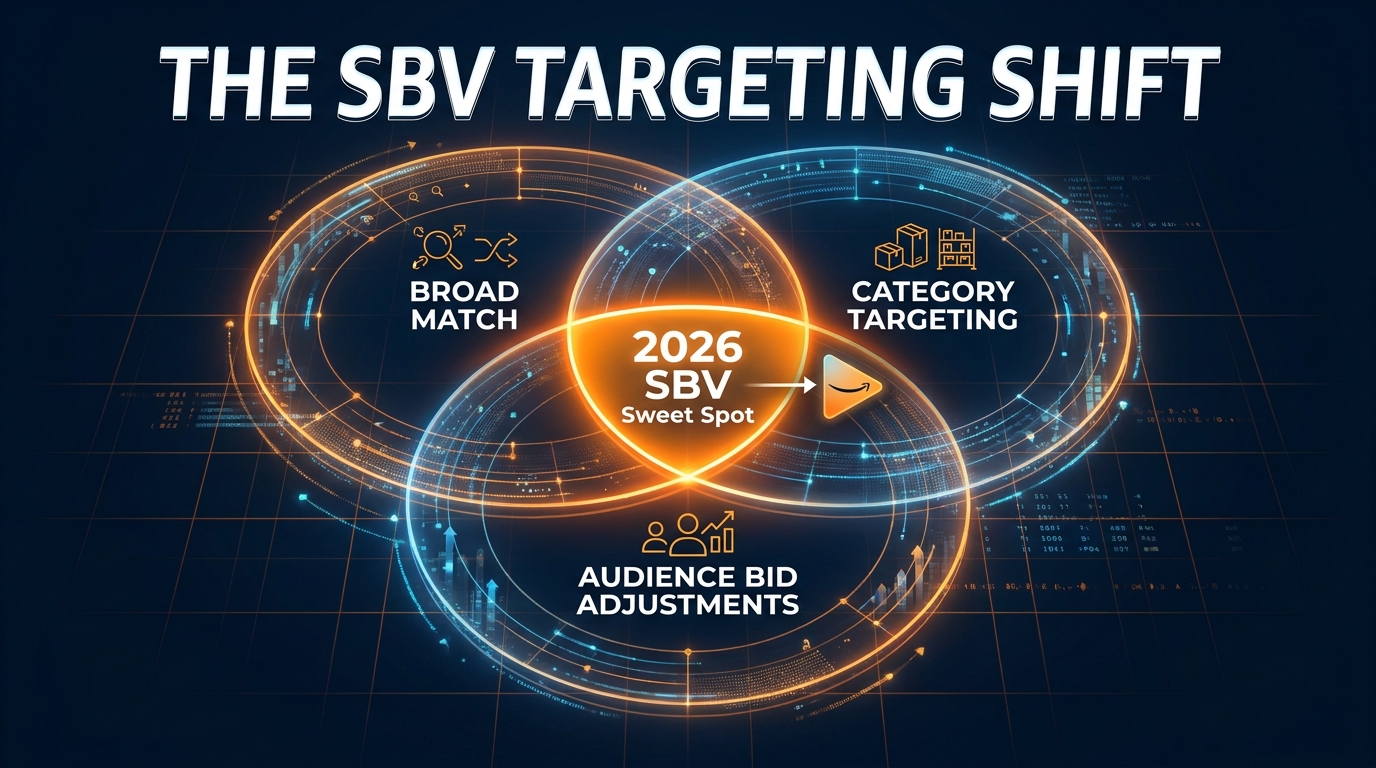
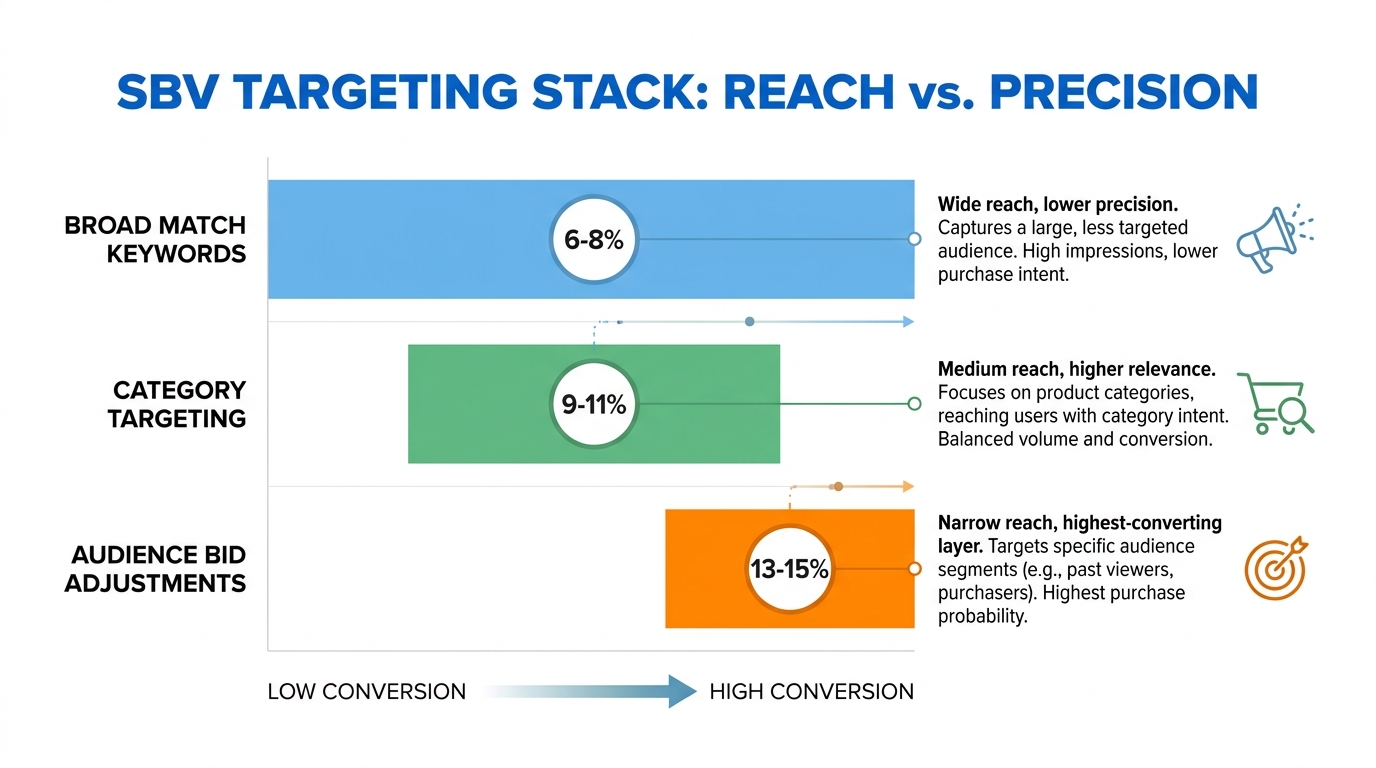
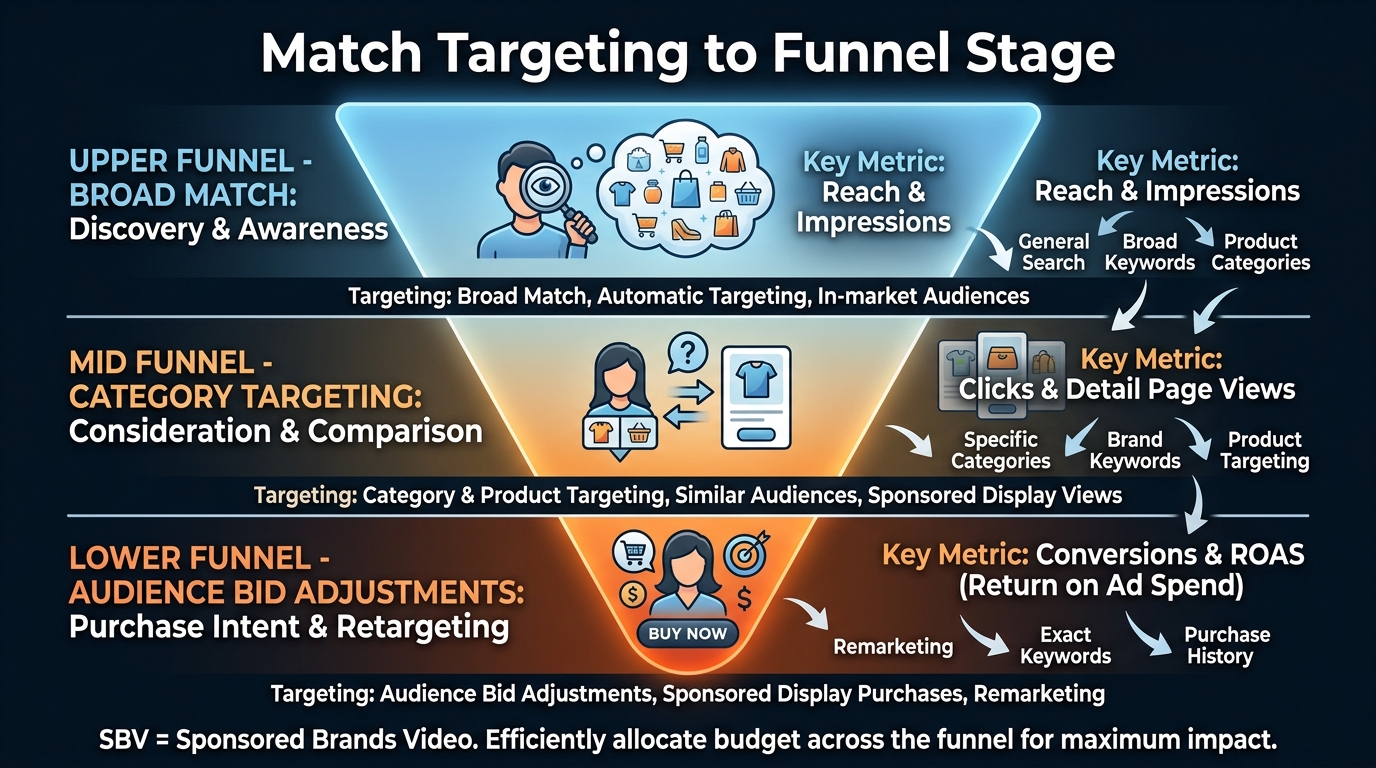
    SBV keyword strategy should include a meaningful proportion of broader, aspirational, or adjacent category keywords that SP campaigns don’t target efficiently. These wider matches reach shoppers earlier in the consideration journey — exactly where SBV’s awareness and video-engagement advantages are most relevant. The CTR from these broader terms will be lower than core keyword CTR, but the NTB acquisition rate will typically be higher, and the CPCs will be more competitive.

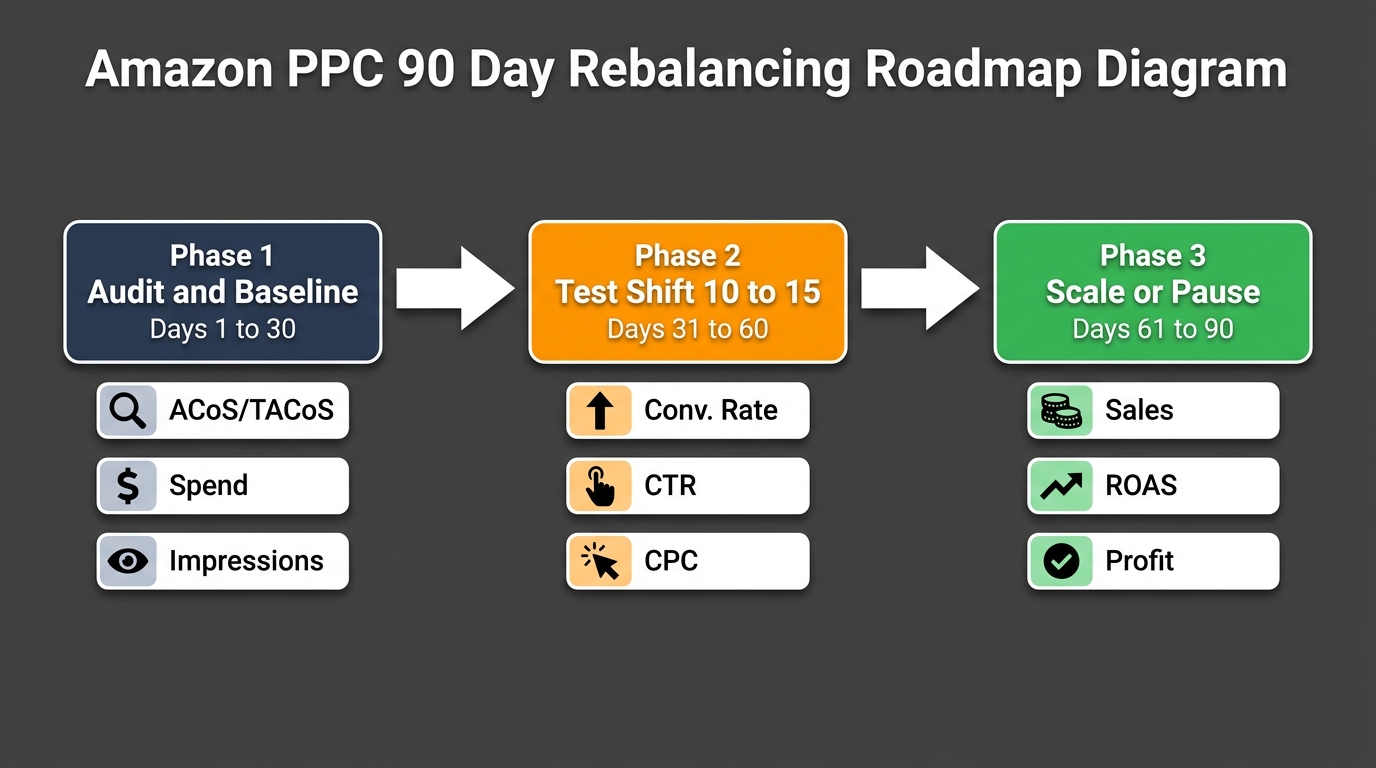
    90-day phased Amazon PPC budget rebalancing roadmap: Phase 1 audit and baseline, Phase 2 test 10-15% shift, Phase 3 scale or pause based on incrementality data

    The Phased Rebalancing Framework: A 90-Day Approach

    The following framework provides a structured approach to SBV budget rebalancing that manages risk, preserves account stability, and generates clean data at each stage to support subsequent decisions. It assumes an existing SP-primary account with either no current SBV presence or a small experimental SBV allocation.

    Phase 1 (Days 1–30): Establish baselines and prepare creative

    The first month is entirely analytical and preparatory. Run your existing SP and SBV campaigns without structural changes. Pull 30-day and 90-day performance data across: SP CPC by keyword group, SP marginal ROAS (estimated), SP impression share on core keywords, SBV CTR and CVR by creative asset, SBV NTB order rate and NTB CAC, and branded keyword search volume trends.

    Use this data to identify: (1) which SP campaigns or keyword groups are showing the clearest diminishing marginal returns — these are the rebalancing source pool; (2) which SBV creative assets have demonstrated the strongest CTR and NTB performance at current spend levels — these are the assets worth scaling; and (3) what creative gaps exist if the SBV budget were to double or triple.

    Simultaneously, prepare or commission any additional creative assets needed for Phase 2 scaling. The 30-day Phase 1 window is the production runway for the video assets that Phase 2 will need. Entering Phase 2 without ready creative puts you in the position of scaling budget against an asset before it’s been adequately tested.

    Phase 2 (Days 31–60): Execute the first rebalancing shift

    Move 10–15% of your identified SP rebalancing pool into SBV. If your analysis in Phase 1 suggested $8,000/month in SP spend that is delivering below-marginal returns, shift $800–$1,200 of that into SBV in Phase 2. This is deliberately conservative — the goal is not to maximize the rebalancing speed but to generate clean, observable data on how the shift affects both account-level performance and SBV-specific metrics.

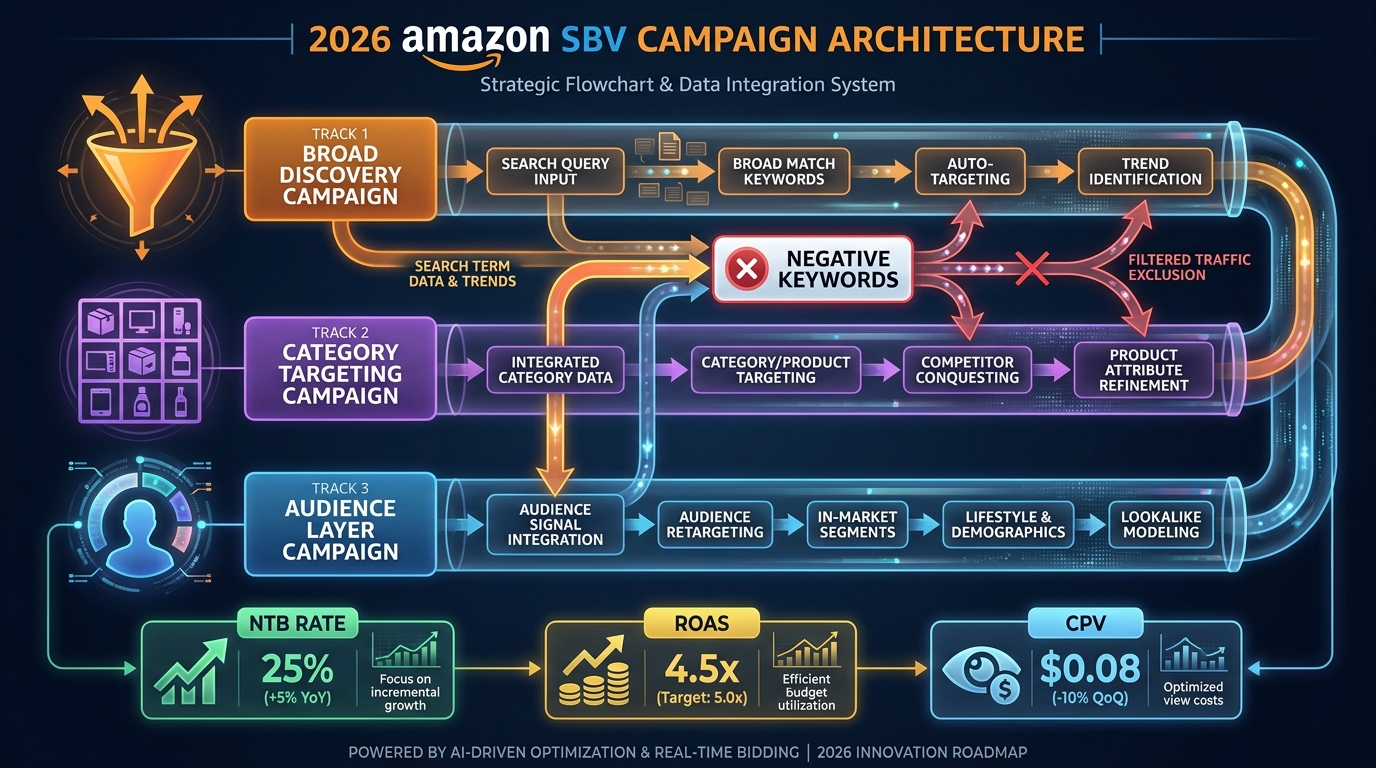
    Configure SBV campaigns with the validated creative assets identified in Phase 1. Separate campaigns by targeting strategy: one campaign targeting your core category keywords, one targeting broader adjacent keywords, and — if you have the budget — one targeting competitor ASINs or branded terms where SBV’s video format can interrupt competitor consideration. Maintain all existing SP campaigns at their current levels minus the reallocated amount; do not simultaneously adjust SP bids, which would introduce additional variables.

    Track weekly: total account ROAS (not just SBV ROAS), SP conversion rate, SBV CTR and CVR, SBV NTB order rate, and branded keyword impression volume. Any significant deterioration in total account ROAS or SP conversion rate should trigger a diagnostic review before Phase 3.

    Phase 3 (Days 61–90): Scale, hold, or pull back based on data

    By Day 61, you have 30 days of clean Phase 2 performance data. The decision tree is straightforward:

    If total account ROAS held or improved: SBV has absorbed the rebalanced budget without degrading overall performance. The data supports further rebalancing. Execute a second 10–15% shift in Phase 3 and extend the framework to a 180-day cycle.

    If total account ROAS declined but SBV NTB metrics are strong: The direct ROAS decline may be offset by NTB acquisition value. Run the iROAS calculation including estimated LTV contribution from NTB customers. If the combined metric supports the shift, hold the current allocation and monitor for 30 more days before deciding whether to scale further or stabilize.

    If both direct ROAS and NTB metrics are weak: The creative or targeting in Phase 2 is the problem, not the rebalancing thesis. Pause the SBV scale, diagnose which elements of creative and targeting underperformed, produce revised assets, and re-run Phase 2 with the improvements before attempting Phase 3 again.

    The structured approach forces each rebalancing decision to be grounded in observed data rather than either blind commitment to the rebalancing thesis or premature retreat at the first sign of performance volatility. Most accounts that fail at SBV rebalancing fail because they either move too fast without adequate measurement infrastructure or abandon the strategy based on direct ROAS data alone without incorporating NTB and iROAS context.

    Conclusion: The Budget Assumption Worth Revisiting

    The SP-primary Amazon advertising account was the right structure for a previous version of the Amazon advertising ecosystem. In that environment — lower SP CPCs, limited SBV placement inventory, fragmented video creative tools — allocating 80–90% of PPC budget to Sponsored Products was a rational, efficient choice. That environment no longer exists in 2026.

    SP CPCs have climbed to levels where incremental spend in many categories generates genuinely poor marginal returns. SBV has matured into a format with documented CTR advantages, measurable NTB acquisition capacity, and a clear place in the full shopping funnel. The analytical tools — NTB metrics, LTS ROAS, incremental ROAS frameworks — to evaluate SBV on appropriate terms are available in Amazon’s own reporting console. The creative production barrier has dropped with Amazon’s Video Generator and widespread access to affordable video production services.

    The remaining barrier is organizational: the habit of evaluating all advertising spend on last-click direct ROAS, which makes SP look more efficient than it is at the margin and makes SBV look less efficient than it is when NTB and halo contributions are included. Changing that measurement framework is the precondition for making rational rebalancing decisions.

    The four signals — rising SP CPCs, ROAS plateaus, stagnant branded search volume, and underutilized SBV placement inventory — are a diagnostic toolkit, not a checklist requiring all four items to be present before action is warranted. Two or three of them appearing simultaneously is sufficient to begin the 90-day rebalancing framework and generate the data that will either confirm or complicate the thesis.

    Video is not eating search because it is a better channel in some abstract sense. It’s earning budget because the economics of search have shifted to a point where video’s incremental contribution — measured honestly and completely — is frequently more valuable than the marginal return on additional search spend. That’s not a creative trend. It’s a math problem with a specific answer that differs for every account and changes every quarter. The job is to run the math, act on what it shows, and keep running it.

    Key Takeaways

    • SP CPCs have risen ~48% cumulatively since 2019; marginal returns on additional SP spend are declining in most competitive categories.
    • SBV delivers approximately 1.6× higher CTR and 1.3× higher CVR than static Sponsored Brands, with new-to-brand reporting that SP cannot provide.
    • Standard last-click ROAS comparisons systematically undervalue SBV; NTB-adjusted and incremental ROAS frameworks are required for accurate evaluation.
    • Advanced accounts in 2026 allocate 80–95% of SB budget to SBV, representing roughly 16–25% of total PPC spend.
    • The four rebalancing signals: rising SP CPC, ROAS plateau, stagnant branded search volume, and available SBV placement inventory.
    • Move budget in 10–15% increments per 30-day period; evaluate with a combined direct ROAS + NTB + iROAS framework.
    • Creative quality is the binding constraint on SBV performance — do not scale budget ahead of creative readiness.
    • Rufus/Alexa for Shopping’s conversational discovery surfaces reward brands with richer upper-funnel data, reinforcing the long-term case for SBV investment.
  • Sponsored Brand Video Beyond Amazon: What Off-Platform Placements Actually Deliver (And What They Don’t)

    Sponsored Brand Video Beyond Amazon: What Off-Platform Placements Actually Deliver (And What They Don’t)

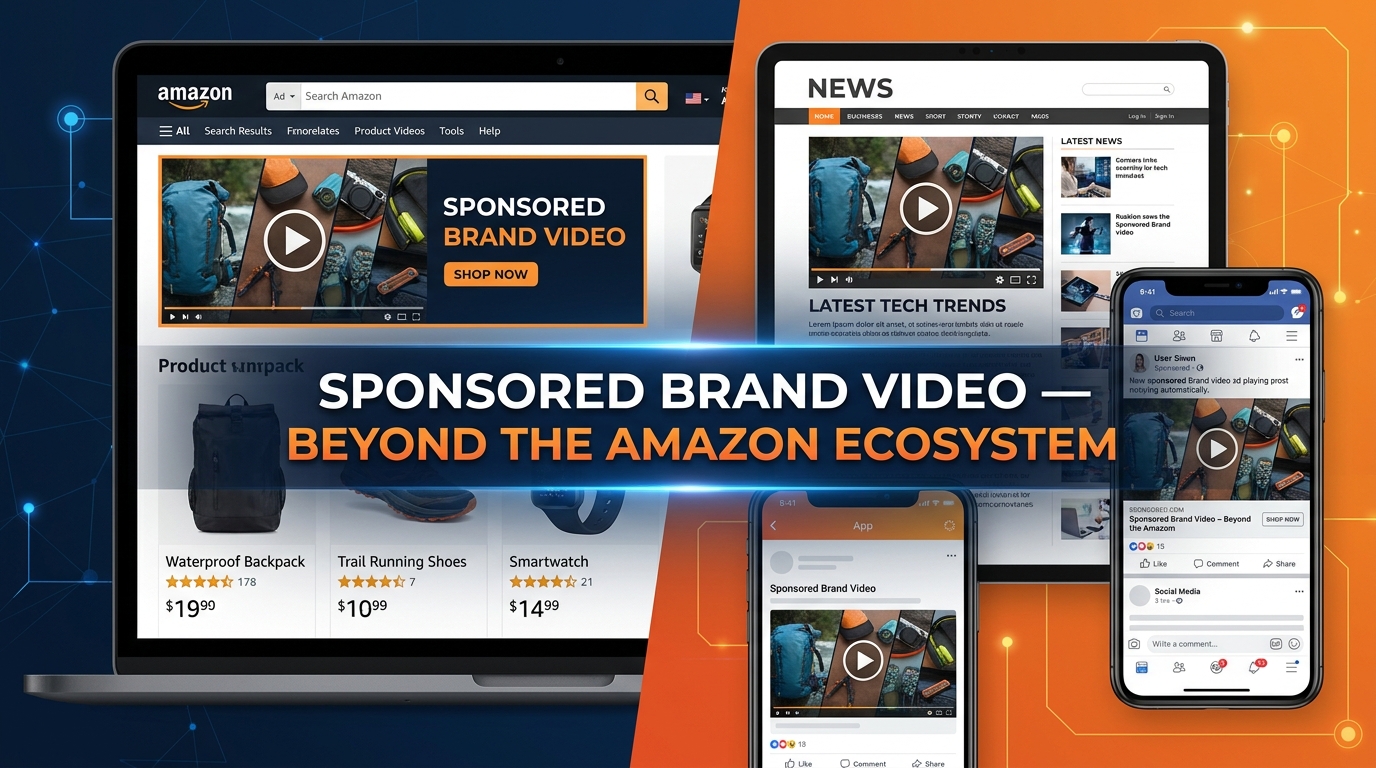
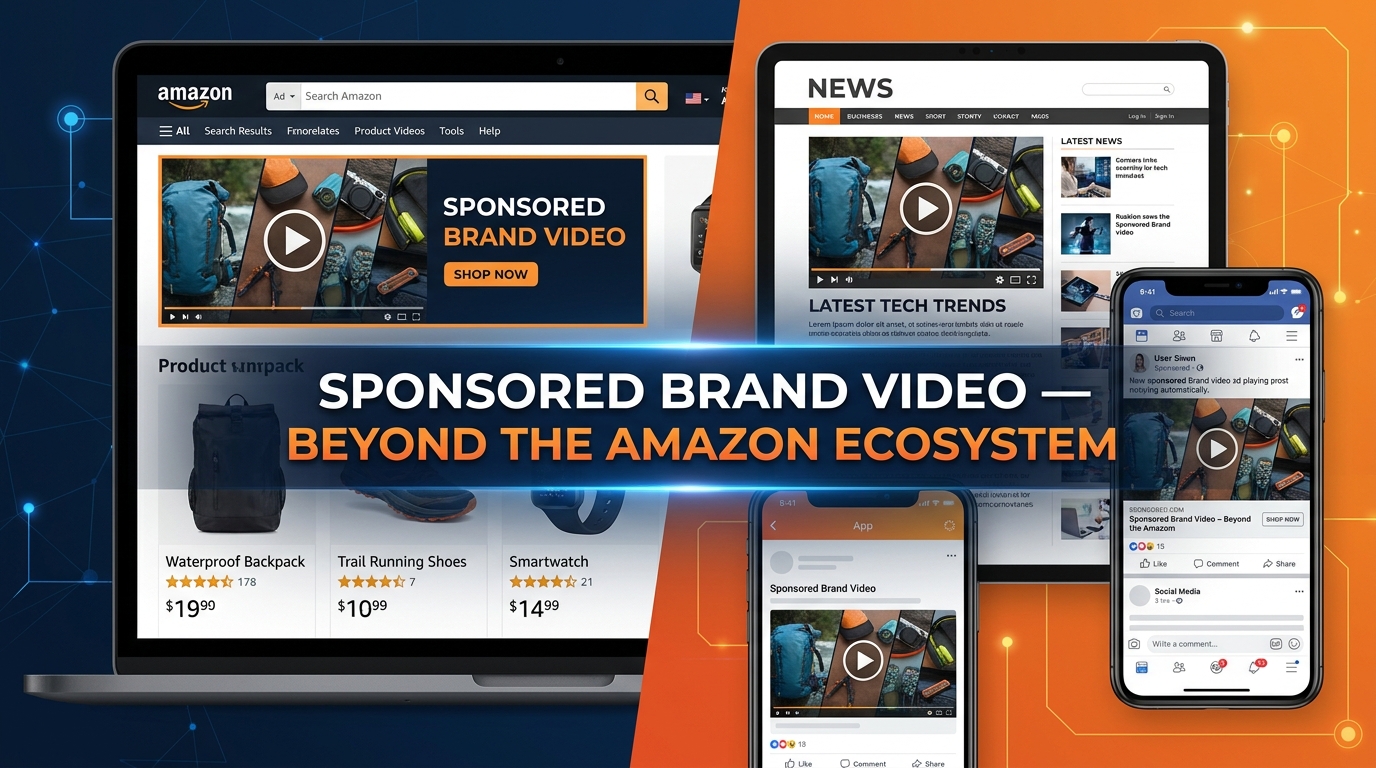
    Sponsored Brand Video ads running on Amazon search results and external websites side by side

    There is a version of Sponsored Brand Video that most advertisers know well: the autoplay unit that fires at the top of Amazon search results, product in frame within the first two seconds, sound off, text overlay telling the viewer exactly what they’re buying before they’ve even decided they want it. It converts. It scales. It is one of the most defensible CPCs in self-serve advertising.

    Then there’s the other version — the one that Amazon quietly serves beyond its own domain, into third-party apps, publisher sites, and off-platform inventory — and the story there is considerably more complicated.

    The promise is straightforward: extend your brand’s video reach beyond Amazon’s walls, capture shoppers earlier in their journey, and drive them back to your listings with higher purchase intent than a cold paid-social impression ever could. The reality, as practitioners are discovering through placement reports and AMC queries, is messier. Off-Amazon SBV placements can carry higher ACoS, lower conversion rates, and significantly murkier attribution than the search-result placements that made the format famous.

    That doesn’t mean you should ignore them. It means you need to understand exactly what you’re buying, how to measure it honestly, and when — for your specific catalog, category, and funnel — off-platform video makes financial sense. This article covers all of it, without the hype.

    What “Off-Amazon Placements” Actually Means for Sponsored Brand Video

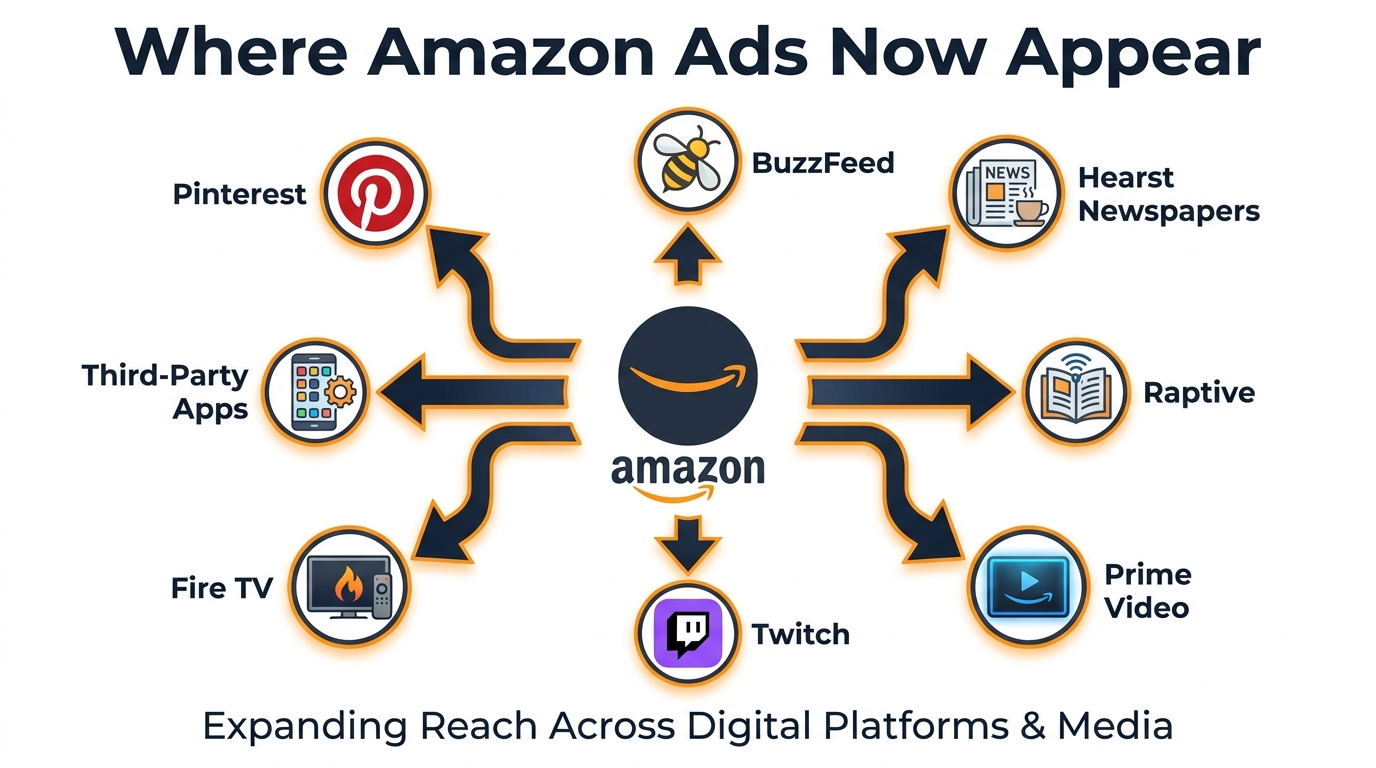
    Diagram of Amazon's expanding advertising network showing connections to Pinterest, BuzzFeed, Hearst, Raptive, Prime Video, Twitch, and Fire TV

    Before discussing performance, you need a clear map of what “off-Amazon” actually encompasses in 2026. The term covers substantially different inventory types, with different audiences, different intent signals, and different attribution mechanics. Treating them as a single category is where most advertisers make their first analytical mistake.

    The Three Distinct Off-Amazon Contexts

    Amazon-owned off-Amazon properties. This is the largest and most measurable segment. It includes Fire TV, Fire Tablet, IMDb, Twitch, and Alexa-adjacent surfaces. These are technically “off Amazon.com” but still within Amazon’s walled garden, meaning first-party audience data remains intact and attribution is relatively clean. Sponsored Brands Video does not natively run here — that’s primarily Amazon DSP and Streaming TV territory — but understanding this segment matters because it represents the gold standard of off-Amazon intent quality that purely external placements can’t replicate.

    Amazon’s third-party publisher network. This is where Sponsored Products off-Amazon placements live, and where the most practitioner confusion originates. Amazon serves ads on premium publishers including Pinterest, BuzzFeed, Hearst Newspapers, Raptive, Lifehacker, Mashable, and a growing list of Ziff Davis properties. The rollout began in 2023 for Sponsored Products. By 2026, this network has expanded considerably, though the extent to which Sponsored Brands Video — as opposed to Sponsored Products — flows through this publisher network is a question Amazon has not fully answered in public documentation.

    Browser and app-level remnant inventory. Through programmatic delivery and the broader reach of Amazon DSP, video can reach users on thousands of apps and websites outside Amazon’s premium network. This is distinct from SBV proper but forms part of the “off-Amazon video” conversation for advertisers thinking about cross-channel strategy.

    What SBV’s Official Spec Sheet Actually Says

    Amazon’s official Sponsored Brands Video documentation describes the format primarily as a search-results ad. The standard placement is top-of-search on Amazon, where intent is highest and the format genuinely earns its cost-per-click premium. However, placement reports available in the Amazon Ads console do surface an “Off Amazon” line item for some campaigns, indicating that budget is occasionally being allocated to placements beyond Amazon.com — even when advertisers haven’t explicitly chosen to go there.

    This is the central tension for most advertisers: off-Amazon placements for SBV are not always a deliberate strategic choice. Sometimes they’re a default, and the budget allocation to them can quietly erode campaign efficiency if placement reports aren’t reviewed regularly. The first practical step for any SBV advertiser is simply knowing whether their campaigns are serving off-Amazon at all — and at what share of spend.

    The Architecture of Amazon’s Expanding Ad Network

    To understand why off-Amazon placements exist and why Amazon is aggressively expanding them, you need to understand Amazon’s competitive position in digital advertising circa 2026. Amazon is now the third-largest digital advertising platform globally, trailing only Google and Meta. Its core advantage has always been purchase-intent data — no other platform can tie an ad impression directly to a product purchase with first-party data at scale. But there’s a ceiling on how much ad inventory Amazon.com itself can generate. The search results page has finite real estate. The product detail page has competing formats fighting for attention.

    Why Amazon Needs Off-Platform Reach

    Off-Amazon inventory solves a structural problem: Amazon has more advertising demand than its own platform can absorb at the CPCs and CPMs advertisers are willing to pay at the margin. Expanding to external publishers creates new inventory, new reach, and a rationale for advertisers to consolidate more of their media budget within Amazon’s ecosystem rather than splitting it between Amazon, Google Shopping, and paid social.

    The pitch to advertisers is compelling in theory: Amazon’s shopper purchase-intent data, applied to audiences on third-party sites, should produce better targeting than a generic programmatic buy. When a user who searched for “insulated water bottle” on Amazon in the last 30 days sees your SBV unit on a Hearst lifestyle article, they are, in theory, a higher-value prospect than someone reached via a lookalike audience on a demand-side platform with no purchase-signal backbone.

    The Publisher Network’s Current Reality

    In practice, the rollout of Amazon’s off-Amazon ad network through third-party publishers has been uneven. The early evidence from Sponsored Products off-Amazon placements — which expanded before SBV — showed that conversion rates drop sharply when shoppers are reached outside the purchase-intent context of Amazon search. A user browsing a BuzzFeed article about summer recipes and encountering a product ad is in a fundamentally different mental state than the same user typing a specific query into Amazon’s search bar. The purchase signal that makes Amazon inventory so valuable comes precisely from active shopping behavior. Off-platform, that signal dilutes significantly.

    Some practitioners running Sponsored Products campaigns have reported off-Amazon ACoS running at two to four times their on-Amazon benchmarks, with conversion rates that are a fraction of search-result placements. Sponsored Brand Video, with its heavier creative requirements and slightly longer engagement window, may perform better than static product ads in off-Amazon contexts — but the fundamental intent-gap problem doesn’t disappear because the ad has motion.

    Why SBV Was Built for On-Amazon — And What That Means Off-Platform

    Side-by-side performance comparison of Sponsored Brand Video on-Amazon vs off-Amazon showing CTR, CVR, ACoS, and intent levels

    Sponsored Brand Video was designed around a very specific user behavior: a shopper who has typed a keyword into Amazon’s search bar, scrolled past the top organic result, and encountered an autoplay video that — if the creative is done right — answers the implicit question behind their search query before they’ve had to read a single word of product copy.

    That interaction model is extraordinarily efficient. The shopper has already self-selected into purchase consideration. The video doesn’t need to create desire from scratch; it just needs to confirm relevance and differentiate the product. This is why SBV’s on-Amazon performance metrics — typically CTR in the 0.8–1.2% range, conversion rates of 8–12% for well-structured campaigns, and ACoS targets achievable in the 20–35% range for most categories — are so strong relative to other video formats.

    The Intent Architecture That Makes On-Amazon SBV Work

    Consider what the on-Amazon SBV placement actually captures. The shopper has expressed category intent through their search query. They’re actively evaluating options. The product display around the video ad reinforces the shopping context. The click goes directly to a product detail page or Brand Store, where purchase infrastructure — Prime shipping badging, reviews, A+ content, Buy Box — all works to complete the conversion. Every element of that chain is optimized for the transaction. Remove the shopper from Amazon’s context and that entire infrastructure disappears.

    Off-platform, even with Amazon’s audience targeting applied, the journey looks different. The shopper may have expressed purchase intent earlier — perhaps they did search on Amazon weeks ago, and Amazon’s retargeting machinery has identified them as an in-market audience. But “in-market” is not the same as “in-session.” A shopper reading the news has a much higher re-engagement cost than one already in the shopping funnel. The video has to do more work, and clicking an ad means leaving the current browsing context, navigating to Amazon, and reorienting to a purchase decision — a significant drop in probability at each step.

    Creative Requirements Change Off-Platform

    Amazon’s official best practices for SBV creative — product visible within the first two seconds, function demonstrated within five seconds, sound-off optimized, strong text overlay, 15–30 seconds total with 20 seconds or less strongly recommended — are calibrated for an audience in active purchase mode. Off-platform audiences need a different creative approach: more storytelling context, a clearer reason to click away from their current content, and a value proposition strong enough to interrupt browsing behavior rather than complement it.

    This is a genuine creative divergence. The best-performing on-Amazon SBV often features tight product shots, feature-forward editing, and a direct CTA to “Shop Now.” That creative, served to someone halfway through a recipe article on a lifestyle site, may not generate the response rate the placement report suggests it should. If you’re going to run video off-Amazon deliberately, you need to think about whether your current creative assets are built for that audience context — or whether you’re running on-Amazon creative in a context it wasn’t designed for.

    The Off-Amazon Placement Data Problem: What You Can and Can’t Measure

    One of the most significant barriers to making rational decisions about off-Amazon SBV placements is the data gap. Amazon’s placement reports do surface off-Amazon spend data, and the Amazon Ads console has improved its reporting significantly in 2025–2026. But the granularity that would allow advertisers to make truly informed allocation decisions — which specific publishers are receiving budget, what the completion rate of video is on those placements, what the post-click behavior looks like by external domain — remains largely unavailable in self-serve reporting.

    What Your Placement Report Actually Shows You

    In the Amazon Ads console, the placement report for Sponsored Brands campaigns breaks performance into broad buckets: top of search, other on-Amazon placements, and off-Amazon. The off-Amazon bucket aggregates all external placement performance into a single row. You can see spend, clicks, orders, CPC, and ACoS for that aggregate off-Amazon pool — but you cannot see which individual publishers drove which clicks, which placements had the highest view-through rates, or how the traffic from off-Amazon placements differed in downstream behavior from on-Amazon clickers.

    This aggregation makes optimization difficult. You know the total off-Amazon ACoS — if it’s 80% while your on-Amazon ACoS is 25%, you know something is wrong. But you don’t have the data to surgically fix it at the placement level the way you might exclude poorly performing keywords from a search campaign.

    The Placement Modifier Limitation

    Amazon does allow bid modifiers for different placement types, including the ability to set specific bid adjustments for top-of-search versus other placements. However, the control options for specifically reducing or eliminating off-Amazon delivery have historically been blunt. Advertisers who want to effectively exclude off-Amazon placements often need to use workarounds, including setting very low or zero bid modifiers for non-search placements, and monitoring placement reports weekly to detect any drift in off-Amazon spend share. This is not the kind of surgical placement control that, say, Meta’s Advantage+ or Google’s Performance Max campaign types now offer with their exclusion tools.

    Amazon Marketing Cloud Fills Some Gaps

    For advertisers with access to Amazon Marketing Cloud (AMC) — which requires either a managed service relationship or a direct AMC setup — the picture improves considerably. AMC allows you to run custom SQL queries across your full Amazon advertising dataset, including path-to-purchase analysis that can distinguish the contribution of off-Amazon placements versus on-Amazon touch points in multi-touch conversion journeys. You can run incrementality analyses to assess whether off-Amazon SBV impressions are generating sales lift above what would have occurred organically. AMC won’t tell you which publisher showed your ad, but it will tell you whether the population of users exposed to off-Amazon placements converted at rates meaningfully different from unexposed users — which is the question that actually matters for budget allocation.

    DSP Video vs. Sponsored Brand Video Off-Amazon: Picking the Right Tool

    Comparison diagram showing Sponsored Brand Video vs Amazon DSP Video formats, pricing models, and placement types across the advertising funnel

    If you want Amazon’s audience data applied to video inventory beyond Amazon.com, you have two fundamentally different tools available. Understanding why they’re different — and which one is actually appropriate for your objective — is critical before spending a dollar on off-Amazon video.

    Sponsored Brand Video: The Self-Serve CPC Format

    SBV operates on a cost-per-click model, is available to any seller or vendor enrolled in Brand Registry, requires no minimum spend, and is managed entirely within the Amazon Ads console. Its native habitat is Amazon search results. When SBV budget spills into off-Amazon placements, it is typically via Amazon’s automated delivery — the algorithm deciding that external inventory represents an opportunity to spend your budget at a favorable CPC before returning to on-Amazon inventory. You’re still paying cost-per-click, but the conversion rate on that click is likely materially lower than on-Amazon, which is why ACoS tends to run higher in the off-Amazon placement bucket.

    For advertisers primarily focused on efficient, last-click conversion, SBV’s off-Amazon delivery is more likely a problem to manage than an opportunity to pursue. The format wasn’t designed for off-site prospecting, and its CPC pricing model doesn’t account for the lower purchase probability of external traffic.

    Amazon DSP Video: The Purpose-Built Off-Amazon Format

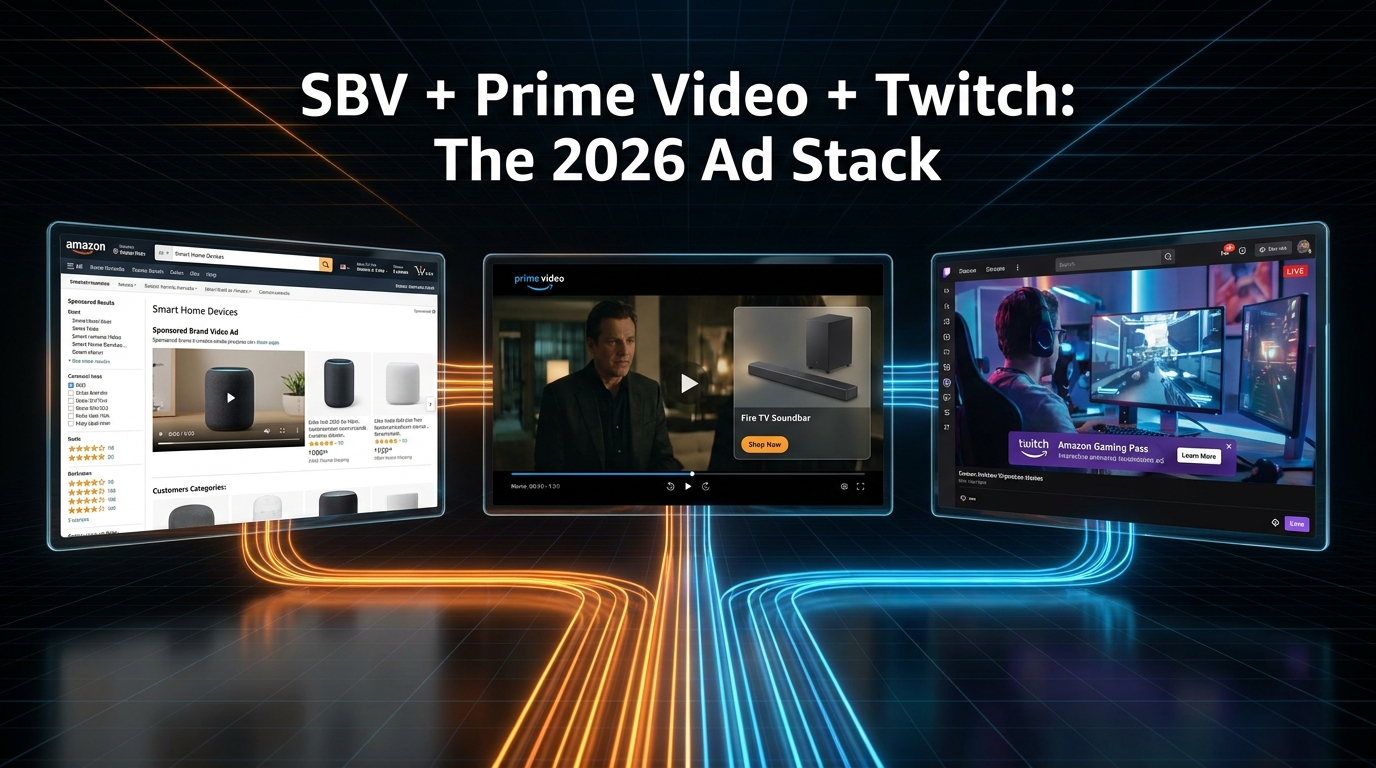
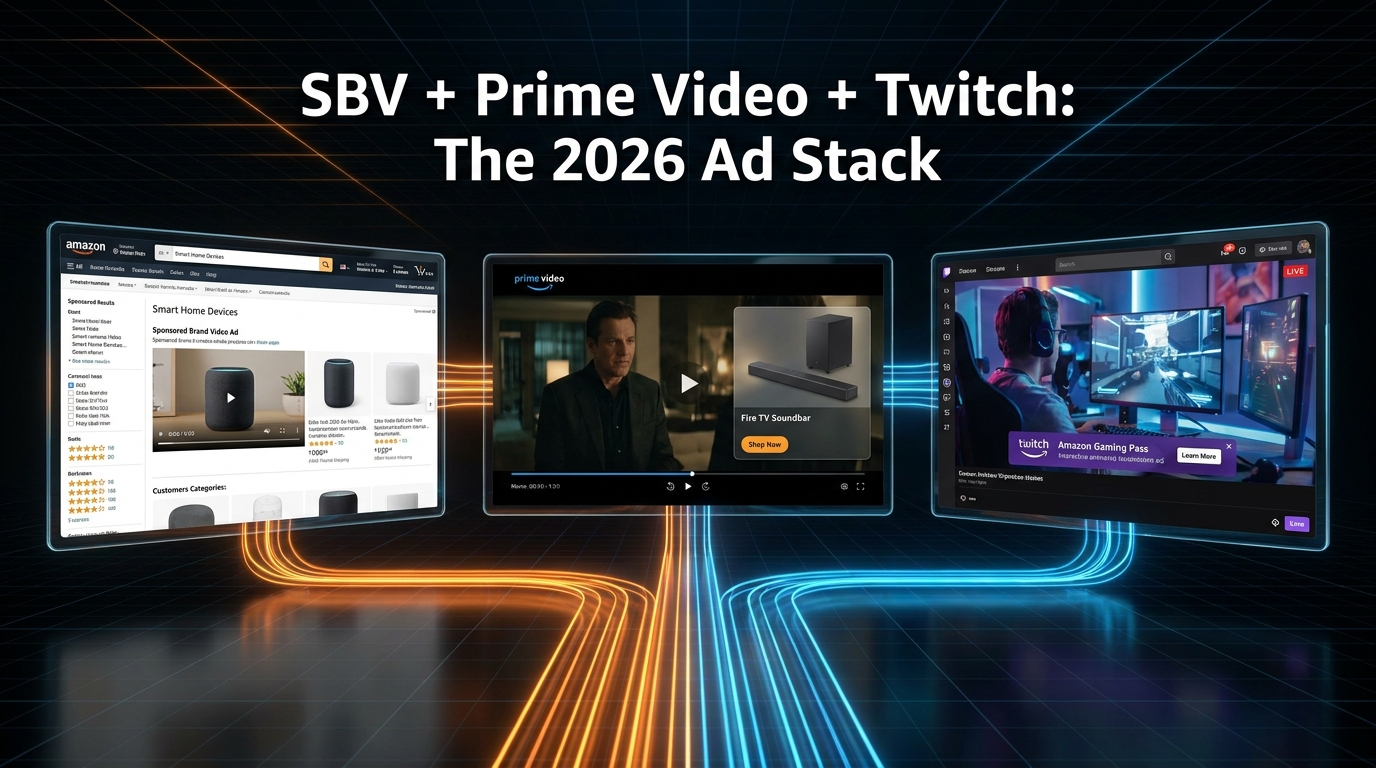
    Amazon DSP video — including Online Video (OLV) on third-party sites and Streaming TV on Prime Video, Twitch, IMDb, and Fire TV — was specifically designed for off-Amazon delivery. It operates on a CPM basis, is priced and optimized for reach and awareness objectives, and gives advertisers far more placement control than self-serve SBV. Minimum spend thresholds apply (typically $10,000 or more for self-service DSP, higher for managed), making it inaccessible to smaller advertisers but meaningful for mid-to-large brands.

    DSP video with Amazon audience segments — in-market shoppers, lifestyle segments, competitive ASIN retargeting — is the correct vehicle for off-Amazon video reach when reach is actually the objective. Typical ROAS benchmarks for DSP video prospecting run in the 2–3x range; retargeting campaigns that hit audiences who have already visited product pages or add-to-cart audiences can deliver 4–8x ROAS. These numbers don’t match on-Amazon SBV’s lower-funnel efficiency, but they’re measuring a different objective: incremental reach to audiences who may not yet be in-market, rather than harvesting intent from shoppers already in the purchase funnel.

    The Practical Decision Framework

    The cleanest way to think about the choice: if your objective is conversion, maximize on-Amazon SBV and minimize or eliminate off-Amazon SBV delivery. If your objective is awareness and upper-funnel reach, use Amazon DSP video with the inventory targeting and audience segments it was built for. The mistake is using SBV as an off-Amazon awareness play because it’s cheaper to set up — it’s measuring success with ACoS when the actual goal is reach and brand recall, and it’s running bottom-funnel creative in a top-funnel context. That mismatch produces disappointing results and misleading data.

    Creative Strategy for Video That Works Across Contexts

    Whether you’re managing SBV placement spill or deliberately building off-Amazon video strategy via DSP, the creative decisions you make will have a larger impact on off-platform performance than any bid adjustment or targeting parameter. On-Amazon, a mediocre video with strong keyword targeting will still convert reasonably well because the intent context carries it. Off-Amazon, where the surrounding environment is providing no purchase signal reinforcement, the creative has to carry the full load.

    The On-Amazon Creative Checklist (Baseline)

    For SBV running in its primary habitat — top of Amazon search results — the evidence-backed creative approach is well-established. Show the product within the first two seconds; demonstrate its key function within five seconds; assume no audio (studies consistently show the majority of users browsing Amazon are in sound-off environments or using the app in public); include text overlays for every key message; end with a clear call to action. At 15–30 seconds total length, with Amazon’s own recommendation capping at 20 seconds for highest performance, this is a tight format that rewards ruthless clarity over creative ambition.

    Brands that have documented strong SBV performance — including HP’s 224% year-over-year impression growth in SBV placements and Loftie achieving 5.66 ROAS on SBV campaigns — consistently cite product-first creative execution as the common thread. These are not brand films. They are demonstration videos with a buy button attached.

    Adapting Creative for Off-Amazon Contexts

    Off-Amazon audiences need more. They haven’t signaled purchase intent, so your video needs to create it. That means a slightly longer tolerated introduction — you may need two to three seconds of context before the product reveal, because the viewer doesn’t know they’re looking at a shopping ad. Emotional or aspirational hooks work better in external browsing environments than pure feature lists; you’re interrupting content consumption, not complementing search behavior.

    Consider a two-creative approach if you’re running any significant budget off-Amazon: a tight, conversion-focused version for on-Amazon placements (15–20 seconds, product-first, feature overlay) and a slightly richer awareness version for off-Amazon (25–35 seconds, problem-solution narrative, softer CTA). Amazon’s creative serving doesn’t natively separate these by placement type in SBV campaigns, which is another argument for separating off-Amazon spend into DSP campaigns where you have full creative control by placement.

    Technical Specs That Matter

    For SBV, Amazon’s current technical requirements call for a 16:9 or 1:1 aspect ratio, minimum resolution of 1280×720 pixels, MP4 or MOV file format, maximum file size of 500MB, and audio mix optimized for both playback and mute scenarios. Closed captions are now effectively mandatory for any ad serving on mobile environments; the completion rate improvement from properly captioned video relative to uncaptioned is significant across all Amazon video formats. For DSP video, specs vary by placement type, with Streaming TV requiring a 16:9 aspect ratio and professional broadcast-quality audio since it’s playing on connected TVs where users are more likely to have sound enabled.

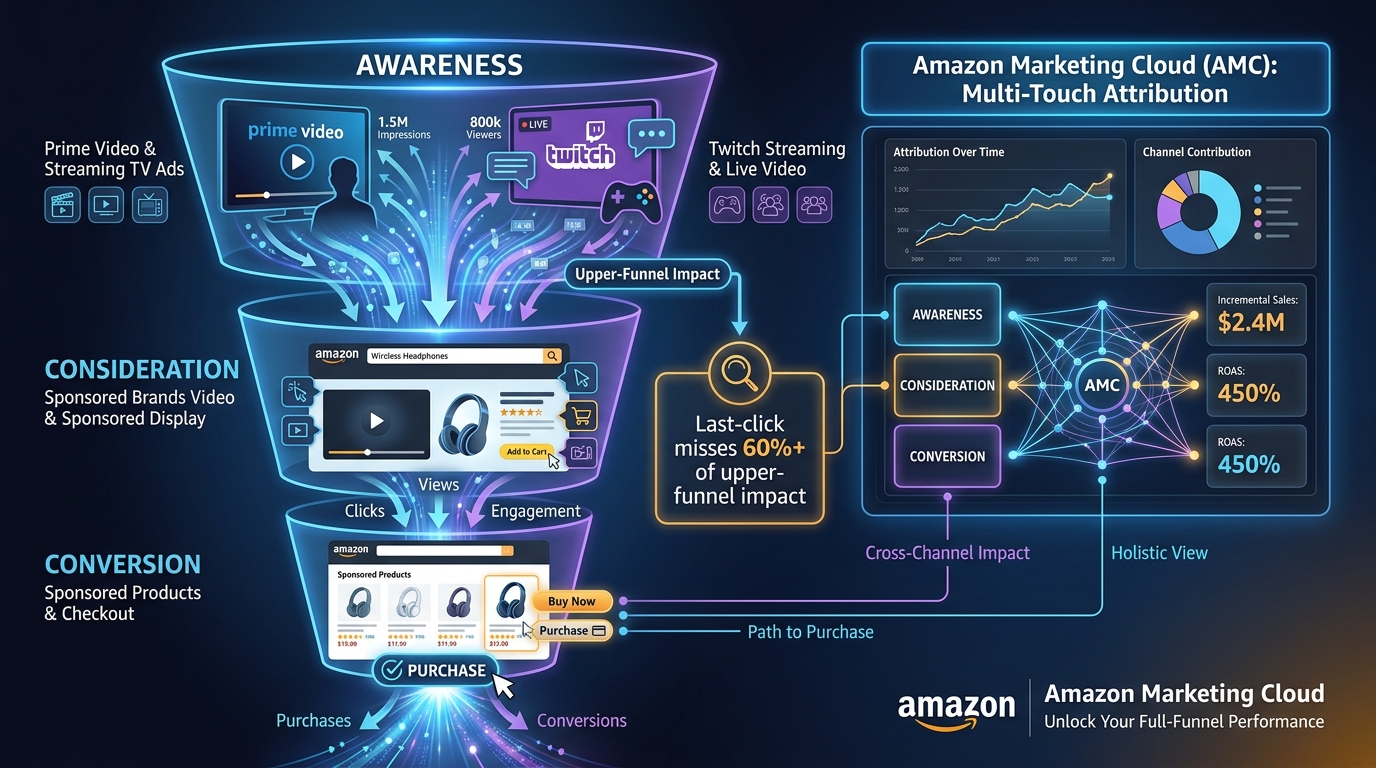
    Amazon Marketing Cloud: The Missing Link in Cross-Channel Attribution

    Amazon Marketing Cloud as a data hub connecting Sponsored Brand Video, DSP video, external traffic, and conversion data into unified attribution reports

    The single biggest shift in how sophisticated Amazon advertisers think about off-Amazon video in 2026 is the maturation of Amazon Marketing Cloud as a measurement infrastructure. For years, the attribution challenge with off-Amazon video was fundamental: you could see the impressions on one side and the Amazon sales on the other, but connecting them required either trusting Amazon’s own last-click attribution model (which undersells upper-funnel touchpoints) or running external incrementality studies that were expensive and slow.

    AMC changes that equation materially — for advertisers with the technical capability to use it.

    What AMC Actually Enables

    Amazon Marketing Cloud is a privacy-safe clean room environment that holds event-level Amazon Ads data. Advertisers can submit SQL queries against this dataset to surface insights not available in the standard reporting console. For off-Amazon video measurement, the key use cases are:

    • Path-to-purchase analysis: Understanding how many converting customers were exposed to off-Amazon video touch points before their on-Amazon purchase, and how that exposure affected time-to-conversion and average order value.
    • Reach and frequency reporting: Measuring the incremental audience reach delivered by off-Amazon video versus on-Amazon formats, identifying how much of the off-Amazon delivery was reaching net-new audiences versus retargeting shoppers already in the funnel.
    • Incrementality measurement: Comparing conversion rates between exposed and unexposed audience cohorts to isolate the actual sales lift attributable to off-Amazon placements, separate from organic purchase behavior.
    • Cross-channel overlap analysis: Identifying what percentage of SBV-exposed audiences were also reached by DSP video, Streaming TV, or external traffic sources, enabling frequency cap management across channels.

    The AMC Access Problem

    The limitation with AMC is access. Setting up an AMC instance requires either working through Amazon’s managed service team or an Amazon Ads-verified partner, and extracting meaningful insights requires SQL fluency or a tool built on top of the AMC API. For the majority of Amazon sellers — particularly those in the sub-$1M annual ad spend tier — this capability is either unavailable or economically impractical without agency support. The practical implication is that smaller advertisers making off-Amazon placement decisions are flying largely on aggregate placement report data, while larger competitors are making those same decisions with multi-touch attribution data three levels deeper. That’s a meaningful information asymmetry.

    Workarounds for Advertisers Without AMC

    For brands that can’t yet leverage AMC, Amazon Attribution tags offer a partial solution. Attribution tags let you track external traffic sources — including any media you’re buying outside Amazon — and measure the downstream Amazon conversion events (detail page views, add-to-carts, purchases) driven by that external source. This doesn’t give you the path-to-purchase granularity of AMC, but it does allow you to quantify the conversion value of off-Amazon media buys in a way that goes beyond impression counting. Combined with careful monitoring of Brand Store analytics — which show referral traffic sources and their conversion behavior — Amazon Attribution can provide a directional picture of off-Amazon video ROI even without full AMC access.

    Campaign Structure for Off-Amazon Video Reach

    If you’ve decided that off-Amazon video delivery is a deliberate part of your strategy rather than a byproduct of your SBV budget, the way you structure campaigns significantly affects both performance and your ability to measure it accurately. Running off-Amazon video objectives through the same campaigns as your on-Amazon SBV conflates metrics in ways that make optimization difficult and give false readings on both sets of placements.

    Separating Campaigns by Objective and Placement

    The most defensible structure is to run dedicated campaigns for distinct placement objectives:

    • Campaign 1: SBV Top-of-Search (Conversion Focus). Keyword-targeted, bid aggressively on top-of-search placement, monitor ACoS weekly. Placement modifier for “other placements” set to reduce or eliminate budget flowing to non-search positions. This campaign’s success metric is ACoS and ROAS.
    • Campaign 2: SBV Detail Page (Retargeting / Defense). Product-targeted or category-targeted, running on detail pages of your own ASINs and potentially competitor pages. ACoS target slightly higher than top-of-search given lower conversion rates, but still primarily a conversion-focused placement.
    • Campaign 3: DSP Online Video (Prospecting). For deliberate off-Amazon reach, run this as a separate DSP line item with audience segments (in-market, lifestyle) and CPM bidding. Success metrics are reach, frequency, video completion rate, and view-through conversion rate — not last-click ACoS.
    • Campaign 4: DSP Streaming TV (Brand Awareness). Prime Video, Twitch, IMDb, Fire TV placements. Evaluated on reach, frequency, brand search lift, and AMC-based halo analysis.

    This structure keeps metrics meaningful. When SBV and off-Amazon DSP are lumped together, a spike in DSP prospecting impressions can make the blended ROAS look weaker than it is — causing premature cuts to a strategy that may actually be driving incremental revenue when measured with appropriate attribution windows.

    Budget Allocation Guidance

    There’s no universal rule for how much budget belongs in off-Amazon video versus on-Amazon SBV, but the general principle is that off-Amazon should be additive — funded from incremental budget, not redirected from on-Amazon spend that’s already performing well. A common approach among experienced Amazon advertisers is to allocate 70–80% of video budget to on-Amazon SBV (where intent is highest and measurement is cleanest), 10–15% to DSP online video for prospecting and retargeting, and 5–10% to Streaming TV for upper-funnel brand work. These ratios shift based on category competitiveness, brand awareness stage, and whether the business is in growth mode versus efficiency mode.

    When Off-Amazon SBV Placements Are Worth It (And When They Aren’t)

    Decision flowchart for whether to opt out of off-Amazon Sponsored Brand Video placements based on ACoS thresholds and placement report data

    Rather than a blanket recommendation to embrace or avoid off-Amazon SBV delivery, the more useful framework is a conditional one: certain business conditions make off-Amazon placements a reasonable experiment, while others make them a straightforward drain on an otherwise efficient campaign.

    Scenarios Where Off-Amazon Delivery May Add Value

    High-consideration purchases with long research cycles. If your product category involves significant pre-purchase research — home appliances, premium fitness equipment, supplements with specific health claims — shoppers often leave Amazon during their research phase, consult review sites, watch YouTube comparisons, and read editorial content. Being visible during that research journey, even at lower conversion rates than on-Amazon, can influence the final purchase decision. Off-Amazon reach in these categories has a legitimate role in the purchase journey.

    New product launches before organic ranking is established. A product with no ranking history, few reviews, and low organic visibility struggles to compete for top-of-search SBV impressions on competitive keywords at an efficient ACoS. Off-Amazon awareness building — driving early traffic and brand searches that can feed back into Amazon’s relevance signals — can support a launch strategy, provided you’re measuring success by downstream signals (brand search volume, detail page view rate, conversion rate from traffic) rather than immediate last-click ROAS.

    Competitive displacement in saturated categories. If a competitor dominates top-of-search in your category with aggressive SBV spend, their bid may make efficient on-Amazon impressions expensive. Reaching potential customers earlier in their journey, before they’ve anchored on a competitor, can shift category consideration. This is harder to prove with standard reporting but measurable via AMC brand consideration studies.

    Scenarios Where Off-Amazon SBV Is Simply Leaking Budget

    Tight ACoS targets in competitive categories. If your campaign operates with an ACoS target below 30% and you’re in a category with aggressive on-Amazon competition, off-Amazon placement spill is typically adding spend at ACoS levels that would get any keyword paused in a properly managed search campaign. The appropriate action is placement report monitoring and bid adjustments that limit off-Amazon budget allocation.

    Commoditized or impulse-purchase products. Products bought on impulse — inexpensive consumables, accessories, trending items — don’t benefit from pre-funnel off-Amazon exposure the way high-consideration purchases do. The shopper who needs another set of USB cables isn’t spending time on a Hearst lifestyle site researching their options. Off-Amazon reach for these products is unlikely to change purchase behavior; it’s just impressions on audiences who would either find your product through search anyway or wouldn’t buy it regardless.

    Limited creative assets. Running SBV off-Amazon with on-Amazon creative assets — tight, feature-focused, no emotional hook — in external browsing contexts is likely to generate low engagement rates that may eventually impact how Amazon’s algorithm values your creative quality. If you don’t have the budget or capability to develop context-appropriate creative for off-Amazon audiences, that’s a signal to concentrate on on-Amazon placements where your existing assets are optimized.

    Measuring What Actually Matters: A Metrics Framework

    The mistake most advertisers make when evaluating off-Amazon video placements is applying on-Amazon success metrics to a fundamentally different audience context. ACoS — advertising cost of sale — is the right primary metric for on-Amazon SBV because you’re directly harvesting purchase intent. Off-Amazon, where the objective is reach and upper-funnel influence, ACoS as a primary metric will always look terrible, because you’re measuring a bottom-funnel metric against a top-funnel activity.

    The Metrics Hierarchy for Off-Amazon Video

    Primary metrics (did the ad reach the right audience?):

    • Unique reach and frequency — how many net-new users did your video reach, and how often?
    • Video completion rate (VCR) — what percentage of viewers watched to or near the end? For a 15–30 second video, rates above 60% indicate the creative is holding attention in the external context.
    • Viewability — was the video actually in-view when it played, or was it below the fold and auto-playing unseen?

    Secondary metrics (did reach generate meaningful engagement?):

    • Branded search lift — after running off-Amazon video, did branded search volume on Amazon increase for your brand name or product category terms? This is measurable through Brand Analytics and AMC.
    • Detail page view rate — are users who were exposed to off-Amazon video visiting your product pages at a higher rate than unexposed audiences? AMC path-to-purchase queries can answer this.
    • New-to-brand (NTB) customer rate — what percentage of conversions attributed to off-Amazon-exposed audiences are first-time buyers? NTB rate is available in Sponsored Brands reporting and helps distinguish whether off-Amazon placements are actually expanding your customer base or just retargeting existing buyers.

    Efficiency metrics (are you spending sustainably?):

    • Total advertising cost of sale (TACoS) — blended across all ad spend against total revenue, including organic. Off-Amazon activity that drives organic search rank improvement or brand awareness will show up in improved TACoS even if SBV placement-level ACoS looks weak.
    • Customer acquisition cost (CAC) — for NTB customers specifically, what are you paying to acquire them through off-Amazon video versus your best on-Amazon new-customer channel? If off-Amazon is bringing in NTB customers at a comparable or better CAC, it’s justifiable even with weak ACoS.

    Setting Realistic Time Horizons

    Off-Amazon video influence on Amazon purchase behavior doesn’t happen instantly or show up in weekly ACoS reports. A reasonable measurement window for evaluating upper-funnel video impact is 30–90 days, with AMC analyses comparing conversion behavior before and after a sustained off-Amazon video push. Evaluating a two-week off-Amazon campaign by its in-period ACoS and shutting it down is like judging a billboard campaign by the next day’s web traffic. The effects accumulate over time and across touchpoints — which is both the strength of the approach and the challenge of proving its value to stakeholders who think in weekly ROAS reports.

    The Road Ahead: Where Amazon’s Off-Platform Video Is Heading

    Timeline roadmap showing evolution of Amazon off-platform video advertising from 2023 through 2027 and beyond

    Amazon’s advertising strategy makes its direction clear enough to plan around, even where specific product announcements haven’t materialized. The trend lines running through 2023 to 2026 — Sponsored Products off-Amazon expansion, Prime Video ad-supported tier, DSP premium publisher network growth, AMC measurement infrastructure maturation — all point in the same direction: Amazon wants to be a full-funnel advertising platform that reaches shoppers across the entire digital ecosystem, not just on its own properties.

    Prime Video as the Premium Off-Amazon Canvas

    The most significant development in Amazon’s off-Amazon video story isn’t what’s happening with SBV — it’s what’s happening with Prime Video. The introduction of an ad-supported tier on Prime Video in 2024, which by 2026 has significantly grown its advertising inventory, gives Amazon a premium CTV environment with first-party audience data that neither Google nor Meta can match in the shopping-intent domain. This is where Amazon’s off-Amazon video ambitions are most fully realized: a large screen, captive attention, household-level audience data, and a direct path from ad exposure to Amazon purchase attribution.

    For advertisers who want off-Amazon video reach with Amazon’s data advantage, Prime Video advertising via DSP is now the highest-quality expression of that strategy. It has the attention quality of traditional TV (completion rates on CTV average well above 90%), the purchase-attribution capability of digital, and the audience precision of Amazon’s shopper data stack. Brands that have historically allocated TV budgets to reach and awareness objectives are finding that Prime Video as a DSP buy now offers a more measurable, commerce-attributable alternative.

    Retail Media Network Interoperability

    Longer term, the conversation around off-Amazon video advertising connects to a broader trend in retail media network interoperability. Multiple retail media standards bodies and industry initiatives are working toward cross-network audience matching that would allow, for example, a CPG brand to reach Amazon-identified in-market audiences through Walmart’s media network inventory, or vice versa. Amazon’s participation in these discussions — and the extent to which it opens its first-party audience data to external activation — will significantly shape what “off-Amazon video” means in 2027 and beyond.

    For now, Amazon keeps its most valuable audience signals within its own ecosystem. Off-Amazon reach through Amazon-sourced audience segments is available only through Amazon DSP — not through independent programmatic pipes or third-party demand-side platforms. That walled-garden approach limits adoption among advertisers who prefer open-web programmatic buying, but it protects the data advantage that makes Amazon’s off-Amazon targeting proposition meaningful in the first place.

    AI-Driven Placement Optimization

    Amazon’s advertising AI is increasingly taking an active role in where budget flows across placement types. The Performance+ and related automated campaign types Amazon has been building into its console are designed to find the most efficient placement mix across on- and off-Amazon inventory automatically, without advertisers specifying placement strategies in advance. For efficiency-focused campaigns, this automation can be beneficial — the machine will find high-converting off-Amazon placements and avoid poor-performing ones faster than manual placement report analysis allows.

    The tension is that automation optimizes for the objective you specify (typically ROAS or ACoS), which can be short-sighted for full-funnel strategy. If the algorithm sees off-Amazon placements converting at lower efficiency and pulls budget back to on-Amazon, it may be making the right last-click decision while leaving incremental reach and brand-building value on the table. Understanding what the automation is doing — and when to override it with manual placement controls — will be an increasingly important skill for Amazon advertising practitioners as these automated systems become more prevalent.

    Key Takeaways for Advertisers in 2026

    The honest summary on Sponsored Brand Video in off-Amazon placements is that the format’s core performance advantage — the ability to intercept high-intent shoppers at the moment of active search — is intrinsically tied to being on Amazon. Off-Amazon, that advantage diminishes because the intent context that makes top-of-search SBV so efficient disappears. But that doesn’t make off-Amazon video worthless. It makes it a different tool for a different objective — one that requires a different creative approach, a different metrics framework, and a different seat in the budget allocation conversation.

    Here’s what the evidence actually supports:

    • Audit your placement reports now. If you’re running SBV campaigns without checking the “Off Amazon” placement row, you may be allocating budget to external placements at ACoS levels that would justify pausing any keyword in your search campaigns. This is the most immediate action item and costs nothing but time.
    • Don’t use SBV as your off-Amazon awareness vehicle. If off-Amazon reach is genuinely a strategic objective, Amazon DSP video is the purpose-built format — it has the placement controls, the CPM pricing model, and the inventory quality that SBV campaigns don’t deliver in off-site contexts.
    • Match creative to context. On-Amazon SBV creative — product-first, sound-off, 15–20 seconds — is optimized for intent harvesting. Off-Amazon audiences browsing editorial content need a different hook, a different pacing, and a different CTA that acknowledges they’re not currently in a shopping mindset.
    • Invest in AMC if your spend justifies it. The brands winning at off-Amazon video measurement in 2026 are the ones using AMC to run path-to-purchase analysis, incrementality studies, and branded search lift measurement. Without that infrastructure, you’re making off-Amazon budget decisions with dangerously incomplete information.
    • Use the right success metrics by placement type. ACoS is the right metric for on-Amazon SBV. New-to-brand rate, branded search lift, detail page view rate, and video completion rate are the right metrics for off-Amazon video. Applying ACoS to an awareness placement is like measuring a billboard by its click-through rate — technically possible, practically meaningless.
    • Watch Prime Video ad inventory closely. For brands with budgets that can access DSP, Prime Video is currently the highest-quality off-Amazon video environment in Amazon’s ecosystem — premium attention, first-party audience data, and measurable commerce attribution. It’s where Amazon’s off-platform video ambitions are most fully delivered today.

    Off-Amazon placements for Sponsored Brand Video are neither the growth lever some vendors will tell you they are, nor the budget black hole that a single bad placement report might suggest. They’re a contextual tool — valuable in the right conditions, for the right objectives, with the right creative and measurement infrastructure in place. Getting that context right is what separates advertisers who build durable Amazon advertising programs from those who chase placements and question why the numbers never add up.

  • Why SBV’s Biggest Targeting Shift in 2026 Has Nothing to Do With Keywords

    Why SBV’s Biggest Targeting Shift in 2026 Has Nothing to Do With Keywords

    2026 SBV Targeting Shift: Broad Match, Category Targeting, and Audience Bid Adjustments converge as the new SBV sweet spot

    For most of SBV’s short history, the playbook was simple: build a list of high-intent keywords, set bids, attach a video, and let the format’s inherently higher CTR do the heavy lifting. Exact match for control. Phrase match for scale. Broad match as a last resort when you needed to fill volume gaps.

    That approach worked reasonably well when Sponsored Brands Video was a niche placement and competition was thin. In 2026, neither of those things is true anymore.

    SBV inventory has expanded dramatically across search results and product detail pages. Video CPCs have risen 10–20% above Sponsored Products averages. And Amazon has been quietly adding new layers — audience bid adjustments, richer category targeting controls, and behavioral signals that weren’t available two years ago — that change what good SBV management actually looks like.

    The advertisers who are still running SBV like it’s a keyword-only format are paying more for less. The ones adapting to the three-part targeting stack — broad match for discovery, category targeting for shelf-level precision, and audience bid adjustments as a conversion-intent layer — are pulling sharply better results, including ROAS figures in the 6–7x range on well-structured campaigns.

    This article breaks down what that shift actually means in practice: why each layer exists, what role it plays in the purchase funnel, how to structure campaigns around all three, and what to measure when the standard ROAS number doesn’t tell the whole story. No recycled keyword tactics. No vague “use video” advice. Just a detailed look at how the format’s targeting logic has evolved — and how to use that evolution to your advantage.

    What SBV Actually Is in 2026 (And Why Its Reach Has Grown)

    Amazon Sponsored Brands Video ad placement at top of search results with 2.6x higher CTR than static Sponsored Brands

    Sponsored Brands Video is Amazon’s autoplay video ad unit, available to brand-registered sellers and vendors running Sponsored Brands campaigns. Unlike Sponsored Products, SBV campaigns can drive traffic to either a product detail page or a Brand Store, giving advertisers more flexibility over the landing experience depending on campaign goals.

    Where SBV Appears

    In 2026, SBV runs across three distinct placement types: top of search, inline within search results (sometimes called “rest of search”), and on product detail pages. The top-of-search position is the most prominent — a full-width video unit that autoplays when the shopper scrolls past it — and typically delivers the strongest CTR due to its visual dominance on the results page.

    Product detail page placement has expanded meaningfully over the past 18 months. SBV ads now appear in the “related products” and sponsored video carousels lower on PDPs, which opens up a different type of targeting opportunity: you’re reaching shoppers who are already in active evaluation mode on a competitor’s or complementary product’s page, not just searching for a category term.

    The Performance Numbers That Explain the Format’s Growth

    The raw performance data explains why SBV now makes up a substantial and growing share of Sponsored Brands spend across the marketplace. Current 2026 benchmarks show SBV delivering an average CTR of 0.89–1.0% — approximately 2.6 times higher than static Sponsored Brands image ads. Average conversion rates sit around 11.2%, roughly 13% above their image-based counterparts.

    CPCs are higher — typically $1.10–$2.50 depending on category, compared to Sponsored Products averages — but the math tends to work in SBV’s favor when creative quality is strong, because the higher CTR and CVR compress cost-per-acquisition even as the cost-per-click rises. Average video watch time runs around 18 seconds, with completion rates near 60% for 15–30 second creatives.

    Why Creative Length Still Matters

    Those completion rates deserve attention because they partly explain the format’s targeting shift. When a shopper watches 18 seconds of a 20-second product video, they’ve absorbed significantly more purchase intent signal than a shopper who glanced at a static image ad. Amazon’s algorithm reads that engagement data. It feeds back into how your targeting performs — particularly when you’re running broad or category-based targeting where relevance signals matter more than they do on exact-match keyword campaigns.

    Short, product-first creatives (showing the product in the first two seconds, communicating the core benefit within five) continue to outperform longer, brand-narrative styles in most categories. The video itself is a targeting asset as much as a creative one: a high-completion-rate video earns more algorithm trust, which matters disproportionately when you’re asking Amazon’s system to serve your ad broadly.

    The Three-Part Targeting Stack: Broad, Category, and Audiences Defined

    SBV targeting stack comparison: broad match vs category targeting vs audience bid adjustments showing reach vs precision tradeoffs

    The clearest way to understand the current SBV targeting landscape is to stop thinking about broad match, category targeting, and audiences as three competing options — and start treating them as three layers in a single targeting architecture. Each layer operates on different shopper signals, serves different strategic purposes, and should be evaluated against different performance metrics.

    Layer One: Broad Match Keywords

    Broad match in Sponsored Brands Video works the same way it does in Sponsored Products: Amazon’s system matches your keyword to search queries that contain related terms, synonyms, plural variations, and adjacent concepts. If you’re selling a stainless steel insulated water bottle and you bid broad on “water bottle,” your ad might serve on queries like “hydration flask,” “gym bottle,” or “large reusable water container.”

    The historical knock against broad match was waste. You’d burn budget on irrelevant or low-intent queries, and the search term report would fill up with noise. That criticism remains valid when broad match is used without guardrails. But in 2026, two things have changed that make broad match more viable than it was before.

    First, Amazon’s matching logic has become more sophisticated. The system is better at reading purchase intent signals within a query, not just surface-level keyword similarity. A broad match on “protein powder” is less likely to serve on a completely unrelated fitness query than it would have been two or three years ago. Second, broad match has become the primary discovery mechanism for surfacing queries you don’t already know about — and with SBV’s strong CTR acting as a relevance signal, the algorithm gets feedback faster on which matched queries are actually generating engagement.

    The functional role of broad match in a mature SBV account is not to drive efficient conversions directly. It’s to generate data — to discover which search terms your video creative resonates with — that you then harvest into tighter, higher-confidence campaigns. Think of broad match SBV as a paid research tool with a video creative attached.

    Layer Two: Category Targeting

    Category targeting in SBV lets you serve your video ad to shoppers browsing within specific Amazon product categories or subcategories, as well as on product detail pages of competing or complementary products within those categories. This is fundamentally different from keyword targeting because it decouples placement from what the shopper typed.

    A shopper browsing the “Insulated Water Bottles” subcategory without having typed a specific search query is still a high-intent prospect — they’re actively evaluating products at the shelf level. Category targeting puts your video ad in front of that shopper in a way that keyword targeting, by definition, cannot.

    The most effective category targeting in 2026 is tightly constrained to your own product subcategory rather than broad parent categories. Targeting the “Sports & Outdoors” parent category with an insulated water bottle video will likely produce poor ROAS because the audience is too diffuse. Targeting the “Insulated Water Bottles” or “Hydration & Water Bottles” subcategory keeps the audience relevant and the cost-per-click justifiable.

    Layer Three: Audience Bid Adjustments

    This is the layer most advertisers haven’t fully integrated yet, and it’s where some of the most meaningful 2026 performance gains are showing up. Amazon has expanded Sponsored Brands’ audience bid adjustment capabilities to include behavioral segments based on shopper activity: people who viewed your brand’s products, people who added your products to cart, people who purchased your brand, and — importantly for prospecting — new-to-brand shoppers who have no prior purchase history with you.

    Audience bid adjustments don’t replace your underlying targeting type. You still choose keywords or categories as the base targeting mechanism. The audience bid adjustment then layers on top, telling the system to bid higher (or lower) when the shopper triggering the ad matches a specific behavioral profile. It’s a bid modifier, not a targeting swap.

    The practical effect is significant: a category-targeted SBV campaign running at a $1.50 base bid might apply a 50% positive bid adjustment for shoppers who have previously viewed your brand’s products, pushing effective bids to $2.25 for that audience segment. You’re buying the same placements, but concentrating spend toward the shoppers most likely to convert.

    Why Broad Match Is Performing Again — And What Changed

    It’s worth spending time on why broad match fell out of favor for SBV in the first place, because understanding that history explains the conditions under which it’s now working better.

    The Original Problem With Broad SBV

    When SBV first became widely available, most advertisers treated it like a straightforward extension of their existing Sponsored Brands keyword campaigns. They copied keyword lists, set match types, and pointed the video at a product page. Broad match, in that context, was genuinely problematic: SBV CPCs were high relative to Sponsored Products, the format was relatively new (and therefore more expensive to experiment with), and the matching logic wasn’t refined enough to reliably find high-intent adjacent queries.

    The result was that broad match SBV campaigns frequently bloated ACoS because they were serving on poorly matched queries with no negative keyword hygiene. The format got a reputation for being “hard to control” on broad targeting — which pushed most advertisers toward exact or phrase match as the safe default.

    What’s Different Now

    Several things have shifted the equation. Amazon’s matching algorithm improvements have increased the relevance of broad match serving — the system is now better at inferring purchase intent from query context, not just lexical similarity. This directly reduces the “irrelevant serving” problem that made broad match expensive to run.

    Equally important: the video completion rate feedback loop. When a shopper watches 85% of your video, Amazon’s system registers that as a strong positive engagement signal. On broad match, that completion signal tells the algorithm that this shopper — and shoppers like them — are receptive to your ad. Over time, broad match serving gradually self-optimizes toward the query types that generate strong completion rates, not just clicks. This is a dynamic that didn’t exist (or wasn’t as pronounced) in earlier SBV campaign structures.

    Practitioners running broad match SBV with rigorous negative keyword management are now reporting that the format surfaces genuinely valuable queries they wouldn’t have thought to bid on directly. The discovery value has risen as Amazon’s matching has improved, and the cost of that discovery has become more manageable as negative keyword workflows have matured.

    The Non-Negotiable: Negative Keywords

    Broad match SBV without a structured negative keyword process is still a budget leak. The workflow that’s working in 2026 looks like this: run broad match campaigns for two to three weeks, pull the search term report, identify irrelevant or wasteful query patterns, and add negatives at the campaign or ad group level before the next review cycle. Do this on a consistent 7–14 day cadence, and broad match SBV becomes a systematic discovery engine rather than a scatter-gun spend category.

    One specific pattern to watch: broad match will sometimes serve your SBV on branded queries for competitors. That’s occasionally useful for conquesting, but it drives up CPC and often converts poorly unless your creative is explicitly positioned as a comparison or alternative. Most advertisers add competitor branded terms as negatives unless they’re running a deliberate conquesting strategy with appropriate creative.

    Category Targeting: Precision at the Shelf Level

    Category targeting for SBV operates on a fundamentally different logic from keyword targeting, and that difference matters for how you structure campaigns, set bids, and interpret performance data.

    The Shelf-Level Intent Signal

    When a shopper types a search query, they’re signaling what they’re looking for in that moment. When a shopper is browsing a product subcategory on Amazon — scrolling through the “Insulated Water Bottles” results, comparing products on detail pages, reading reviews — they’re signaling something deeper: they’re actively in a consideration and comparison phase, evaluating options against each other.

    That’s a more advanced purchase stage than a cold keyword search, and it’s the core reason category targeting has become such a strong SBV lever. Your video ad appears to a shopper who is already in buy-mode for your category, not one who is tangentially related to it by query association.

    Category Targeting vs. Product Targeting in SBV

    It’s useful to distinguish category targeting (targeting a subcategory or parent category) from product targeting (targeting specific ASINs). Both are available in Sponsored Brands Video. Product targeting — pointing your SBV ad at specific competitor ASINs or complementary products — tends to be more precise and often delivers stronger ROAS on well-chosen targets, but it requires more active management as competitor product pages change.

    Category targeting requires less ongoing curation but produces wider variance in performance. The targeting logic here is: invest time upfront in selecting the right subcategory, then let the category targeting run with bid optimization while you monitor ACoS trends. Practitioners report that keeping category targeting in SBV restricted to your own primary subcategory — rather than adjacent or parent categories — is the single biggest structural choice that separates efficient category campaigns from wasteful ones.

    Using Category Targeting for Competitive Defense and Expansion

    Two specific use cases stand out. First, defensive category targeting: bidding on your own subcategory ensures that when a shopper is browsing your category and a competitor’s SBV ad might otherwise dominate, you have a presence in the video placement. This is particularly important in categories where a few large competitors have significant brand recognition — their video ads can crowd out smaller brands entirely if those brands aren’t running category-targeted SBV defensively.

    Second, expansion targeting: once you’ve established strong performance in your primary subcategory, testing adjacent subcategories can surface demand from shoppers who might solve the same problem with a different product type. A blender brand targeting the “Food Processors” subcategory, for example, might reach shoppers who are evaluating both options and would switch to the blender if presented with a compelling video demonstration. The key is starting narrow and expanding based on data, not pre-emptively going broad across adjacent categories.

    Audience Bid Adjustments: The Layer Most SBV Campaigns Are Missing

    Purchase funnel showing broad match at top, category targeting in middle, and audience bid adjustments at bottom with conversion rates by stage

    Audience bid adjustments in Sponsored Brands have expanded significantly in 2026, and most advertisers are either unaware of them or treating them as an afterthought rather than a core bid strategy lever. That’s a gap worth closing, because the performance differential between campaigns that use audience bid adjustments intelligently and those that don’t is material.

    What Amazon Has Added

    Amazon now supports several audience bid adjustment segments inside Sponsored Brands (including SBV) campaigns. The most recently expanded options include:

    • New-to-brand shoppers: Shoppers who have not purchased from your brand in the past 12 months. Bidding up for this segment supports new customer acquisition and is directly tied to new-to-brand metrics in your reporting.
    • Viewed your brand’s products: Shoppers who have visited your product detail pages but not yet purchased. These are warm prospects who have already shown interest — bidding up here recaptures consideration-stage shoppers through video.
    • Added to cart: Shoppers who added your product to their cart but didn’t complete a purchase. This is a high-intent retargeting signal; a bid uplift here puts your video in front of shoppers who are very close to conversion.
    • Purchased your brand’s product: Existing customers. Bidding up or down on this segment depending on whether your goal is retention/upsell or acquisition shapes your campaign’s customer mix.

    The mechanics work as a percentage bid modifier. If your base bid is $1.50 and you apply a +40% adjustment for “viewed your brand’s products,” the effective bid for that shopper segment becomes $2.10. You can apply both an audience bid adjustment and a placement bid adjustment simultaneously in the same campaign, layering both signals onto your base targeting bid.

    Why This Changes Campaign Logic

    Before audience bid adjustments were available in Sponsored Brands, your only levers were the keyword or category bid itself and the placement bid modifier. That meant you were essentially treating all shoppers who triggered your targeting equally — whether they’d never heard of your brand or had been to your product page three times in the past week.

    Audience bid adjustments break that uniformity in a way that has direct, measurable impact on conversion rates. A shopper who has previously viewed your product page and then sees your SBV ad on a broad match or category-triggered impression is in a fundamentally different conversion position than a cold shopper. Paying more to serve that shopper isn’t waste — it’s a rational bid premium for a higher-probability conversion.

    New-to-Brand Bidding as a Strategic Lever

    The new-to-brand bid adjustment deserves particular attention because it connects SBV to one of the most strategically important metrics in Amazon advertising: new-to-brand rate. Brands with strong organic share and repeat purchase businesses often find that their overall Amazon PPC spend is heavily weighted toward re-purchasing existing customers — efficient in the short term, but not building brand equity or market share.

    Bidding up specifically for new-to-brand shoppers in SBV campaigns creates a deliberate customer acquisition mechanism that sits separately from your broader ROAS optimization. You’re paying a premium to reach people who have never bought from you before, with a video format that can introduce your brand story and product value proposition in a way that a static ad cannot. Track NTB rate and NTB revenue separately from total campaign revenue, because the economics of new customer acquisition are different — and often worth accepting a lower blended ROAS to sustain.

    The Funnel Logic: Where Each Targeting Type Actually Lives

    The most common SBV targeting mistake in 2026 isn’t using the wrong match type — it’s applying the wrong success metrics to the wrong targeting layer. Broad match SBV at the top of the funnel should not be judged by the same ROAS threshold as an exact-match branded keyword campaign. Category targeting at the mid-funnel should not be optimized purely for last-click conversions. Audience bid adjustments at the lower funnel should not be compared against awareness-stage CPV metrics.

    Top of Funnel: Broad Match as Discovery

    Broad match SBV campaigns play a top-of-funnel role. They serve on the widest range of relevant queries, exposing your brand and product to shoppers who may not have been actively searching for your specific product but whose query context suggests they might be receptive to it. The primary metrics at this layer are: impressions, reach (unique shoppers exposed), video completion rate, and new-to-brand impressions. Direct conversion rate at this layer will typically be lower than at the other two, and that’s expected.

    A common error is turning off broad match SBV campaigns because their standalone ROAS looks weak. If the same campaign is driving significant new-to-brand impressions, high completion rates, and surfacing high-intent search terms that you can harvest into tighter targeting, it’s producing real value — it’s just value that doesn’t show up cleanly in a single-campaign ROAS number.

    Mid Funnel: Category Targeting for Consideration

    Category targeting SBV sits at the mid-funnel, reaching shoppers who are already browsing your subcategory. These shoppers are further along in the purchase process than cold keyword searchers — they’ve committed to exploring options in the category, which means the bar for persuasion is lower. The right success metrics here are conversion rate, ACoS, and category impression share. You want to understand what percentage of category browsing sessions your brand is visible in, not just whether you converted on a given impression.

    Lower Funnel: Audience Adjustments for Intent

    Audience bid adjustments on viewed-product and add-to-cart segments operate at the lower funnel. These shoppers have demonstrated concrete purchase intent — they’ve seen your product and didn’t immediately buy. A video ad at this stage functions as a reminder and reinforcement, addressing potential objections and maintaining brand presence during the final evaluation stage. Conversion rate and ROAS at this layer should be materially higher than at the broad match or cold category layer, and your bids should reflect that.

    The discipline of keeping these three layers analytically separate — not just structurally separate in your campaign setup — is what allows you to make good budget allocation decisions across the full SBV account.

    Campaign Architecture: How to Actually Structure This

    SBV campaign architecture diagram showing three parallel campaign tracks for broad discovery, category targeting, and audience layers with data flow between them

    Theory is useful, but the architecture question — how do you actually build this in your Amazon Ads account — is where most advertisers struggle. The following structure reflects what’s working across mid-to-large SBV spenders in 2026.

    Campaign Track 1: Broad Discovery

    Build a dedicated SBV campaign with broad match keywords targeting your primary category terms and problem-solution phrases (not just product terms). Keep the keyword list focused — 15 to 25 broad match terms is sufficient for most product lines. Set bids at the lower end of your category’s competitive range, because broad match will drive volume without aggressive bidding. Apply a new-to-brand audience bid adjustment of +20–30% to bias this campaign toward first-time brand exposures. Set a fixed budget that you’re comfortable spending on discovery, not conversion.

    Pull the search term report every 7–14 days. Identify any terms that have spent without converting over 30+ days and negate them. Identify any terms that have driven multiple conversions and consider migrating them to a separate, tighter phrase or exact match campaign where you can bid more aggressively and measure conversion efficiency cleanly.

    Campaign Track 2: Category Targeting

    Build a separate SBV campaign targeting your primary subcategory. If your category has multiple relevant subcategories, split them into separate ad groups rather than stacking them — this gives you clean performance data per subcategory and the ability to bid each independently. Run at competitive CPCs for your category. Apply a “viewed your brand’s products” bid adjustment of +30–50% to this campaign, since category browsers who’ve previously seen your product are significantly more likely to convert.

    Consider running two variants of this campaign: one targeting your own subcategory (for defensive presence and loyal-browser conversion) and one targeting 2–3 close competitor subcategories or individual competitor ASINs (for conquesting). Keep the creative the same or very similar — this isn’t the place for major creative experimentation, because the audience and intent are defined by the targeting, not the creative.

    Campaign Track 3: Audience-Led Remarketing

    Build a third SBV campaign specifically designed to capture lower-funnel, high-intent shoppers. Use phrase or exact match keywords as your base targeting — you want these impressions on high-relevance queries. Layer add-to-cart and viewed-product audience bid adjustments at +40–60%. This campaign will serve less volume than the other two but at meaningfully higher conversion rates. ROAS here should be the highest of the three tracks.

    If your brand has enough purchase history, also test a loyalty-oriented variant: same structure, but with a bid adjustment for existing customers and a creative that leads with a new product, a bundle, or a subscription offer. The landing destination here matters more than in discovery campaigns — drive to a targeted product page or a Brand Store page organized around the repeat-purchase use case.

    Connecting the Tracks With Data Flow

    The three-track structure only delivers its full value when you’re actively using data from the broad match track to inform the other two. The search terms that perform in broad match campaigns are signals about where real demand lives. When a broad match term consistently converts at acceptable ACoS, promote it: add it as phrase or exact match to your category or remarketing campaigns where you can apply higher bids and tighter audience controls. When a category target is consistently underperforming on ROAS but overperforming on NTB rate, don’t cut it — recategorize it in your measurement as an acquisition campaign and evaluate it against NTB metrics instead.

    Measurement: What to Actually Track When ROAS Doesn’t Tell the Full Story

    SBV measurement dashboard showing CTR 0.89%, CVR 11.2%, NTB Rate 68%, and average watch time 18 seconds with warning that ROAS alone misses the story

    ROAS is not wrong as a metric for SBV. It’s just incomplete — and using it as the only yardstick for a multi-layer targeting structure built around different funnel stages produces systematically bad optimization decisions.

    The Core SBV Metric Set

    Running a comprehensive SBV account in 2026 requires tracking at least five distinct metric categories, and you should understand what each is actually measuring:

    • ROAS / ACoS: Still relevant for efficiency evaluation, especially on lower-funnel and category campaigns. But set different thresholds per campaign track — your broad match discovery campaign should have a higher ACoS tolerance than your remarketing campaign.
    • New-to-brand rate and NTB revenue: The percentage and absolute value of orders from shoppers who haven’t purchased your brand in the past 12 months. This is the primary measure of brand growth, not just advertising efficiency. Sponsored Brands reporting surfaces this data at the campaign level.
    • Cost-per-view (CPV) and 5-second view rate: Amazon added standardized video metrics to Sponsored Brands reporting in early 2026. CPV tells you how much you’re paying per video view, while 5-second view rate tells you what percentage of impressions result in a shopper watching at least 5 seconds — a proxy for creative engagement. A declining 5-second view rate on a broad match campaign is often a signal that the targeting has drifted toward low-relevance queries.
    • Video completion rate: The percentage of views where the shopper watches the full video (or at least 75–80% of it). High completion rate on a broad match campaign validates that the audience the algorithm is finding is genuinely interested. Low completion rate suggests creative-audience mismatch.
    • Category impression share: Available through the Sponsored Brands impression share reports. This tells you what percentage of impressions in your category your ads are capturing relative to the total available. It’s the most direct measure of competitive visibility at the category level — and it’s the metric that category targeting campaigns should be optimized against most directly.

    Building a Reporting Framework That Matches Your Campaign Structure

    The three-track campaign structure described earlier maps cleanly onto a three-tier reporting framework. For the broad match discovery track, lead with NTB impressions, 5-second view rate, video completion rate, and search term discovery velocity (how many new high-intent terms you’re finding per reporting period). For the category targeting track, lead with category impression share, ACoS, and NTB rate. For the audience-led remarketing track, lead with conversion rate, ROAS, and add-to-cart recapture rate.

    When you present SBV performance to internal stakeholders or clients, don’t collapse all three tracks into a single blended ROAS number and call it a day. That approach systematically undervalues the top-of-funnel work and overattributes results to the lower-funnel campaigns that are capturing demand created by the broader targeting layers. Build your reports to show the contribution of each layer separately.

    The Attribution Complexity

    Amazon’s default 14-day attribution window means that a shopper who sees your broad match SBV ad today and purchases 10 days later from an organic search gets partially credited to the SBV campaign. This is both a feature and a complication. It means SBV’s reported ROAS tends to be higher than pure last-click attribution would produce, but it also means some of the “ROAS” in your SBV campaigns is really capturing organic-assisted conversions from shoppers who were in the funnel already.

    The cleanest way to handle this is to compare NTB rate across your campaigns alongside total ROAS. A broad match SBV campaign with a 65–70% NTB rate and a 3.5x ROAS is doing something meaningfully different from a remarketing campaign with a 15% NTB rate and a 7x ROAS — and both might be justified at the right budget allocation.

    What This Looks Like in Practice: Patterns From Real Account Data

    Abstract frameworks only go so far. Here’s what the broad-category-audience SBV targeting structure produces in practice, based on the types of results practitioners are reporting in 2026.

    The “Category Domination” Pattern

    A mid-sized supplement brand running SBV exclusively on exact-match keywords was seeing solid direct ROAS (around 4.5x) but flat category impression share and declining new-to-brand rates. The brand’s existing customer base was being retargeted efficiently, but it was barely reaching category browsers who hadn’t yet encountered the brand.

    The fix was to add a category-targeted SBV campaign alongside the existing keyword campaigns, targeting two specific subcategories at competitive CPCs. Category impression share jumped from roughly 8% to about 23% over 60 days. The category-targeted campaigns ran at lower direct ROAS (around 3.2x) but drove NTB revenue that the keyword campaigns weren’t capturing. Blended account ROAS across both campaign types was slightly lower — but total revenue was up, and new customer acquisition was accelerating.

    The “Broad-to-Harvest” Pattern

    A home goods brand was running SBV on a tight list of exact and phrase match keywords, leaving significant search query discovery on the table. They added a broad match SBV campaign targeting 20 core category terms with a bi-weekly search term harvest workflow. Within 90 days, they had identified 14 high-converting query patterns they hadn’t previously bid on, all of which were subsequently added as phrase match keywords across both SBV and Sponsored Products campaigns. Those 14 queries collectively added meaningful incremental volume to the account — queries the brand would not have found any other way given their existing tight-match structure.

    The “Audience Premium” Pattern

    A consumer electronics brand added “viewed brand’s products” bid adjustments to their category-targeted SBV campaigns at a +45% premium. The audience-adjusted impressions represented about 18% of total category campaign impressions but accounted for 37% of the campaign’s conversions — a conversion rate roughly 2.4x higher than unadjusted category impressions. The effective CPC on audience-adjusted impressions was higher, but CPA was lower because the conversion rate premium more than offset the bid premium. The brand subsequently increased the audience bid adjustment to +60% and shifted budget toward the category campaign to capture more of that high-converting audience mix.

    The Negatives Problem: Keeping Broad Match From Bleeding Budget

    No discussion of broad match SBV is complete without addressing the structural challenge that has historically made it expensive to run: irrelevant serving and the resulting budget leakage. The 2026 approach to negative keywords in SBV is more systematic than it was two to three years ago, and that systematization is partly what’s made broad match viable again at scale.

    Building a Negative Keyword Infrastructure

    The most effective SBV negative keyword practice in 2026 starts with a “seed negative” list before launching the broad match campaign — a list of obviously irrelevant terms you know you don’t want to serve on based on your product category. For a premium kitchen knife brand, this list would include queries related to cheap or disposable cutlery, toy knives, or unrelated “sharp object” contexts. Seeding these negatives before the campaign goes live prevents early budget waste on clearly irrelevant queries during the initial learning phase.

    After launch, the 7–14 day search term review cycle adds negatives based on actual serving data. The most important patterns to negate early are: queries with zero purchase intent (informational searches), branded competitor terms you’re not intentionally conquesting, and category-adjacent queries where your product is unlikely to be a relevant substitute.

    Match Type for Negatives

    Use negative phrase match rather than negative exact match for most exclusions. Negative exact match is too narrow — it only blocks the precise query — while negative phrase match blocks any query containing the phrase, which prevents the same irrelevant pattern from appearing in dozens of slightly different query variations. Save negative exact match for cases where you want to block a specific term but keep closely related variants available for serving.

    Sharing Negatives Across Campaign Tracks

    One underused practice: sharing validated negative keyword lists across your three SBV campaign tracks. If your broad match campaign identifies a specific query pattern as consistently irrelevant, that same pattern should probably be negated in your category targeting campaign too — it might be appearing there as well if a shopper conducted that query on a category page. A shared negative keyword list (or a structured process for propagating negatives across campaigns) prevents you from having to rediscover the same irrelevant terms in each campaign independently.

    Where the Targeting Shift Is Heading Next

    The broad-category-audience targeting stack described in this article reflects where SBV is right now in 2026. But the trajectory of Amazon’s product development suggests where it’s going, and advertisers who understand the direction can position their account structures accordingly.

    Deeper Audience Segmentation

    Amazon’s audience capabilities inside Sponsored Brands are still relatively simple compared to what’s available in Sponsored Display and DSP. The four bid adjustment segments currently available (NTB, viewed, cart, purchased) are the beginning of a more granular audience taxonomy that Amazon will likely continue expanding. Advertisers who build the habit of using and measuring audience bid adjustments now will have a structural advantage when more sophisticated segments — lifestyle audiences, in-market intent signals, lookalike-style audiences — become available in the Sponsored Brands environment.

    Video Creative as a Targeting Signal

    Amazon is increasingly using creative engagement signals — completion rate, 5-second views, view-through behavior — as inputs into ad serving decisions. As these signals become more integral to the algorithm, the quality and relevance of your video creative becomes a de facto targeting input. A video with a 75% completion rate serving on broad match terms will get better algorithm treatment than a video with a 30% completion rate, even at the same bid level. This means investing in creative quality isn’t separable from investing in targeting efficiency — they’re the same investment expressed through different execution paths.

    Integration With Streaming and Off-Amazon Signals

    Amazon’s expansion of Prime Video ads and its broader media network means that, over time, off-Amazon viewing behavior and cross-channel audience data will become more accessible inside Amazon Ads campaign targeting. For SBV specifically, this opens the possibility of serving video ads to shoppers who have shown relevant interest through streaming viewing patterns — an audience signal that has no analogue in the current keyword or category targeting stack. The groundwork for this integration is being built now in Amazon’s audience data infrastructure, even if the product-facing features aren’t fully available yet in standard Sponsored Brands campaigns.

    The Actionable Framework: Getting Started With the Three-Layer Stack

    If you’re currently running SBV on a primarily keyword-only basis, transitioning to the three-layer targeting structure doesn’t require rebuilding your account from scratch. The following sequence gives you a practical path to incorporating broad match, category targeting, and audience bid adjustments without disrupting your existing campaigns.

    Phase 1: Audit and Baseline (Week 1–2)

    Before adding new targeting layers, establish clear performance baselines for your existing SBV campaigns. Pull 90-day data on ROAS, ACoS, CTR, CVR, NTB rate, and CPV (if available). Note which campaigns are keyword-only versus those using any category or product targeting. Identify gaps: Are you capturing category impression share? Do you know your NTB rate? Are you currently using any audience bid adjustments? This audit tells you where the biggest structural gaps are and which layer to add first.

    Phase 2: Add Category Targeting (Week 3–4)

    Launch one new SBV campaign targeting your primary product subcategory. Keep the creative the same as your best-performing existing SBV ad — this is a targeting test, not a creative test. Set a modest daily budget (equivalent to 10–15% of your existing SBV spend) and let it run for 3–4 weeks before evaluating. Compare ACoS, NTB rate, and CPV to your existing keyword campaigns. The category campaign will likely show a different performance profile — possibly lower direct ROAS but higher NTB rate — and that difference is the data you need to make budget allocation decisions.

    Phase 3: Activate Audience Bid Adjustments (Week 5–6)

    Apply audience bid adjustments to your existing best-performing SBV campaigns first — don’t start with the new category campaign. Choose the “viewed your brand’s products” segment and set a conservative +25–30% adjustment. Monitor for two weeks. If the adjustment is improving conversion rate without driving CPA above your threshold, increase it to +40–50%. Then layer in the NTB adjustment for your broad match or prospecting campaigns at +20–25%.

    Phase 4: Launch Broad Match Discovery (Week 7–8)

    Add the broad match discovery campaign last, after you’ve established the infrastructure for negative keyword management and the reporting framework to evaluate it correctly. Set it up with a seed negative list, a modest daily budget, and a clear review cadence from day one. Give it 4–6 weeks of data before making significant structural changes — broad match needs time to accumulate enough search term data to be worth harvesting from.

    By the end of this 8-week ramp, you’ll have all three targeting layers active, with baselines established for each, and a clear measurement framework that evaluates each layer against funnel-appropriate metrics rather than a single blended ROAS number. That’s the structural foundation for scaling SBV in 2026 — not more keywords, not bigger bids, but a targeting architecture that matches the complexity of how Amazon shoppers actually move through the purchase process.

    Conclusion

    The shift happening in Sponsored Brands Video targeting in 2026 isn’t dramatic from the outside. Amazon didn’t remove keyword targeting. The format didn’t change fundamentally. What changed is the ecosystem around it: more competition, expanded placements, more sophisticated audience tools, and a better-tuned matching algorithm that makes broader targeting types more viable and more rewarding than they were before.

    The advertisers who are ahead of this shift understand something simple but consequential: SBV is no longer a keyword-management exercise. It’s a three-layer targeting system that operates across the full purchase funnel — broad match for discovery and demand intelligence, category targeting for shelf-level competitive presence, and audience bid adjustments for conversion intent amplification. Each layer has its own metrics, its own bidding logic, and its own role in the account.

    Running all three layers together, with data flowing between them through a structured harvest-and-negate workflow, produces results that keyword-only SBV simply can’t replicate: better NTB rates, stronger category impression share, higher conversion rates on warm audiences, and a systematic process for continuously discovering new demand rather than recycling the same keyword list.

    The format’s performance potential — 2.6x the CTR of static Sponsored Brands, 11.2% average conversion rates, meaningful NTB lift for brands willing to measure it — is real. Reaching that potential in a competitive 2026 marketplace requires using the full targeting toolkit, not just the keyword-shaped corner of it.