Tag: amazon fba

  • Why Your Amazon Images Are Silently Killing Your Conversion Rate (And How to Fix Every Slot)

    Why Your Amazon Images Are Silently Killing Your Conversion Rate (And How to Fix Every Slot)

    Split-screen Amazon listing comparison showing low vs high converting product images with CVR data

    There are two kinds of Amazon sellers who read articles about listing images. The first kind has genuinely poor images — blurry supplier photos, non-white backgrounds, mismatched lighting. They know something is wrong because their conversion numbers tell them so. The second kind has done the homework: they have a clean hero shot on pure white, they’ve filled all seven image slots, their infographics are tidy, and their listing looks professional. And yet, their conversion rate is still underwhelming.

    This article is mostly for the second group. Because the gap between compliant images and compelling images is where most Amazon sellers are leaving the most money on the table in 2026.

    Compliance is table stakes. Following Amazon’s technical specifications gets your listing visible. It does not, by itself, get your listing clicked. It does not move a browsing shopper from passive interest to genuine purchase intent. That shift — from compliant to compelling — requires a completely different mental model. You’re not just satisfying a checklist. You’re constructing a visual sales argument, slot by slot, that answers every doubt a buyer might have before they ever read a single word of your bullet points.

    The data backs this up. Professional photography drives 2–3x higher conversion rates compared to listings with amateur or generic visuals. A+ Content with optimized images can increase sales by up to 20% over standard listings. A single main image test can move CTR from 2.1% to 3.4% — a 62% increase — without changing a single word of copy. These are not small numbers in a competitive marketplace.

    What follows is a ground-level examination of every image slot, the psychology driving buyer behavior, the specific mistakes that sabotage otherwise solid listings, and the testing infrastructure you need to keep improving. Let’s start at the very beginning: what happens in the buyer’s brain before they’ve consciously decided anything.

    The Psychology of 50 Milliseconds: How Buyers Decide Before They Think

    Infographic showing the 50ms buyer psychology principle — buyers judge products before reading any copy

    Research on visual perception consistently shows that humans form first impressions of visual stimuli in approximately 50 milliseconds. On Amazon, that means a shopper scrolling through search results has already begun evaluating your product — assessing quality, trustworthiness, and relevance — before their conscious brain has processed a single character of your title.

    This is not a metaphor. It’s the literal neurological reality of your marketplace. And it has profound practical implications for how you think about your hero image.

    The Trust Signal Problem

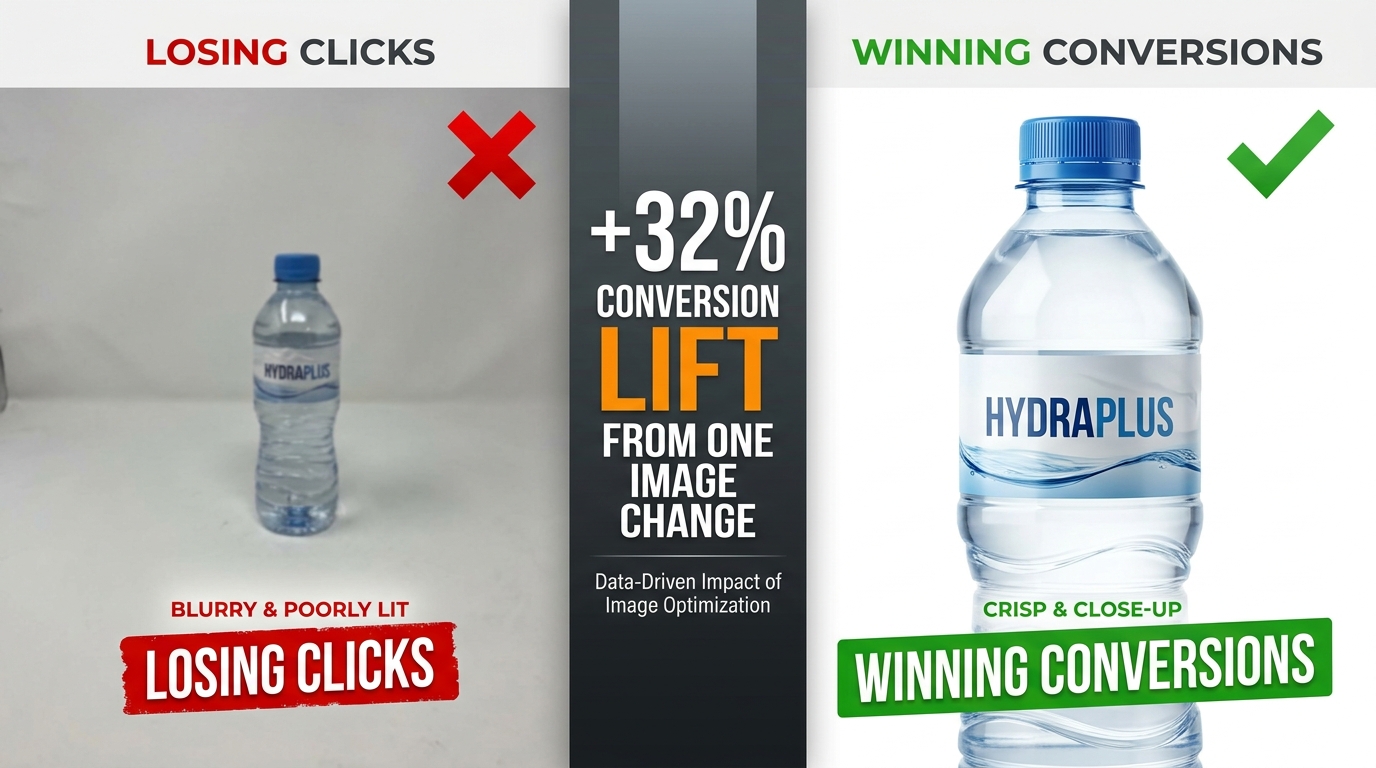
    When a buyer sees a product image, their brain isn’t asking “does this look nice?” It’s running a much more primal calculus: can I trust this? Sharp focus, accurate color reproduction, professional lighting, and a product that fills the frame all function as unconscious trust signals. They communicate that the seller is serious, the product is real, and the brand has invested in quality presentation.

    Conversely, a dark photo, an off-white background, a product that looks small and lost in an oversized frame, or any hint of blurriness triggers an equally automatic suspicion response. Shoppers don’t consciously think “this seller looks unprofessional.” They just feel reluctant — and they click somewhere else.

    Images as Sensory Substitutes

    In a physical retail environment, customers pick things up. They feel the weight, test the texture, open the packaging, press the buttons. Online shopping strips all of that away. The only sensory information available to a potential buyer is what your images provide. This means your image set isn’t just a gallery — it’s a substitute for the in-store experience.

    The most effective Amazon image stacks understand this implicitly. They anticipate the specific sensory questions a customer would ask if they were holding the product. How big is this, really? What does the material feel like? How does it work? What does it look like when someone my age uses it? Every image slot is an opportunity to answer one of those questions before the customer has to ask it — or worse, leaves to find the answer on a competitor’s listing.

    The Risk Reduction Imperative

    Behavioral economics research consistently demonstrates that loss aversion — the fear of making a bad purchase — is a more powerful motivator than the anticipation of gain. Applied to Amazon shopping, this means buyers aren’t just looking for reasons to buy your product. They’re actively scanning for reasons not to buy it. Every unanswered question, every ambiguous image, every detail left to the imagination increases the perceived risk of the purchase.

    Your image set’s job is to systematically eliminate that risk. Show the product from every relevant angle. Demonstrate scale unambiguously. Show it in use in a realistic context. Answer the “but what about…” questions before they’re asked. The listing that eliminates the most purchase-blocking doubts wins the conversion.

    Your Hero Image: The Click-or-Skip Decision

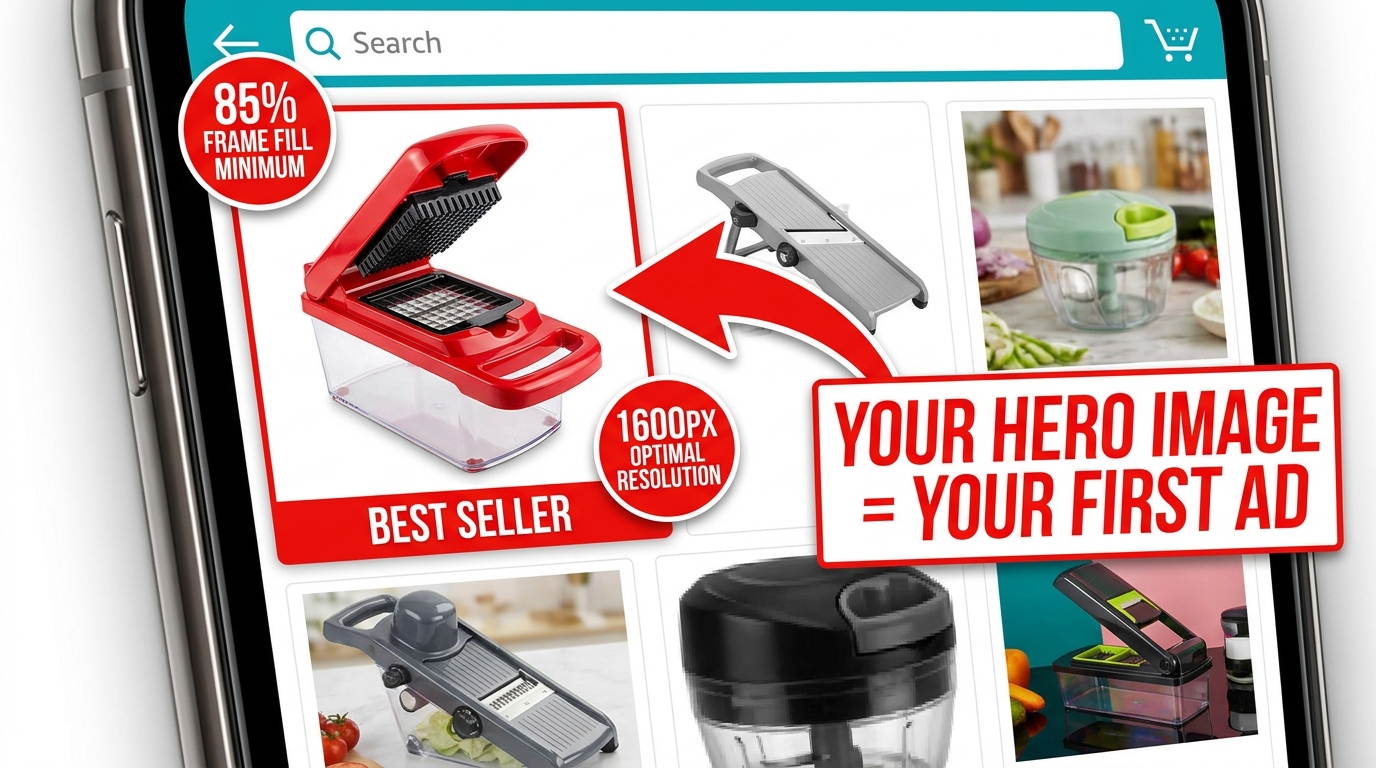
    The hero image — the first image, the one that appears in search results — is functionally a different animal from all your other images. Its job is not to convince. Its job is to get the click. Everything else on your listing handles the convincing. The hero image is purely responsible for getting the shopper off the search results page and onto yours.

    This is an important distinction that many sellers blur. They design their hero image to communicate features, highlight benefits, or establish brand identity. Those are all valuable objectives — for images two through seven. The hero image has one objective: click-through rate.

    Technical Requirements Are Not Optional

    Amazon’s requirements for the main image are strict and actively enforced:

    • Background must be pure white at RGB 255, 255, 255. Not off-white. Not light gray. Not 254, 255, 255. Amazon’s image processing bots check pixel values, and deviations — even imperceptible ones to the human eye — can trigger automatic listing suppression.
    • The product must occupy at least 85% of the image frame. Images where the product looks small, distant, or surrounded by negative space fail to communicate quality and have reduced thumbnails in search results, where space is already at a premium.
    • Minimum resolution of 1,000 pixels on the longest side, with 1,600–2,000+ pixels strongly recommended. Below 1,000 pixels, Amazon’s zoom feature is disabled. Since 66% of shoppers use the zoom feature to inspect products, disabling it is a significant conversion handicap.
    • No text, logos, badges, watermarks, or promotional graphics. No “Best Seller” banners, no discount callouts, no lifestyle props. The main image must show the product — and nothing but the product — on that pure white background.

    Differentiation Within the Rules

    Given that every seller in your category is operating under the same constraints — white background, no text, full product — how do you differentiate? Several levers remain within compliance:

    Angle. The default supplier photo usually shows the product from a straight-on, slightly elevated three-quarter angle. Most competitors are using this same perspective. Testing a different angle — a direct front view, a slightly lower perspective that creates more presence, a slightly overhead angle for flat products — can make your thumbnail visually distinct in a sea of identically-shot competitors.

    Fill ratio. Aim for maximum allowable product fill. A product that takes up 90%+ of the frame looks more imposing and premium than one at 86%. In a small search result thumbnail, this difference is immediately visible.

    Lighting. Subtle shadows and three-dimensional lighting create depth and weight. Flat, shadowless product images often look like PNG cutouts. Careful studio lighting that reveals the product’s form and texture — without adding non-white elements — creates a more premium visual impression.

    Variant selection. If your product comes in multiple colors or sizes, your hero image should feature the variant most likely to appeal to your target buyer first. Showing your least-differentiated version in the hero wastes the first impression.

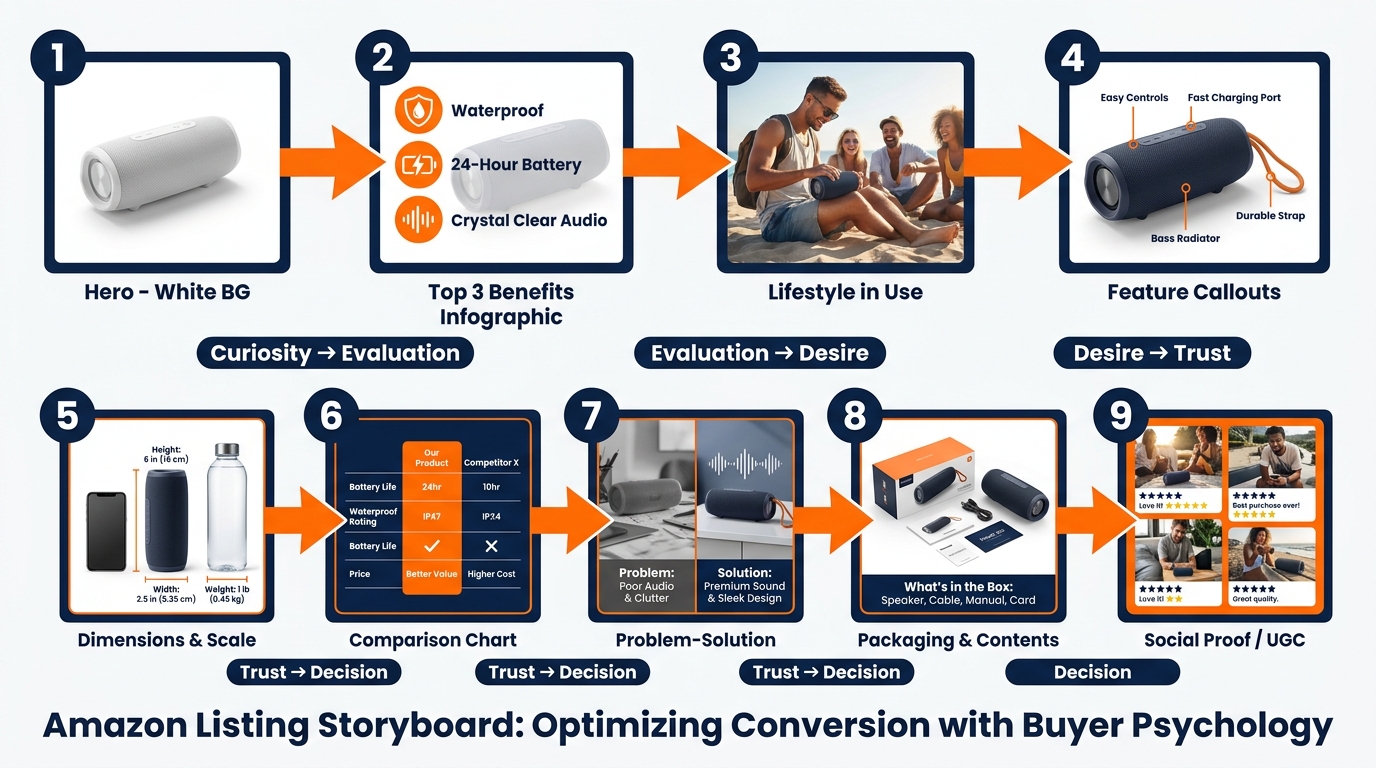
    The 7-Slot Framework: Mapping Your Images to the Buyer Journey

    Infographic diagram showing Amazon's 7-image slot strategy mapped to the buyer journey

    Amazon allows up to nine product images, plus a video. Most successful sellers use all seven primary image slots at minimum. But using all seven slots isn’t the same as using them strategically. The sequence matters. Each image should answer the next logical question a buyer has after viewing the previous one.

    Think of the image stack as a visual sales conversation. You’ve captured attention with the hero. Now you have a shopper on your product page who wants to be convinced. Walk them through that journey deliberately.

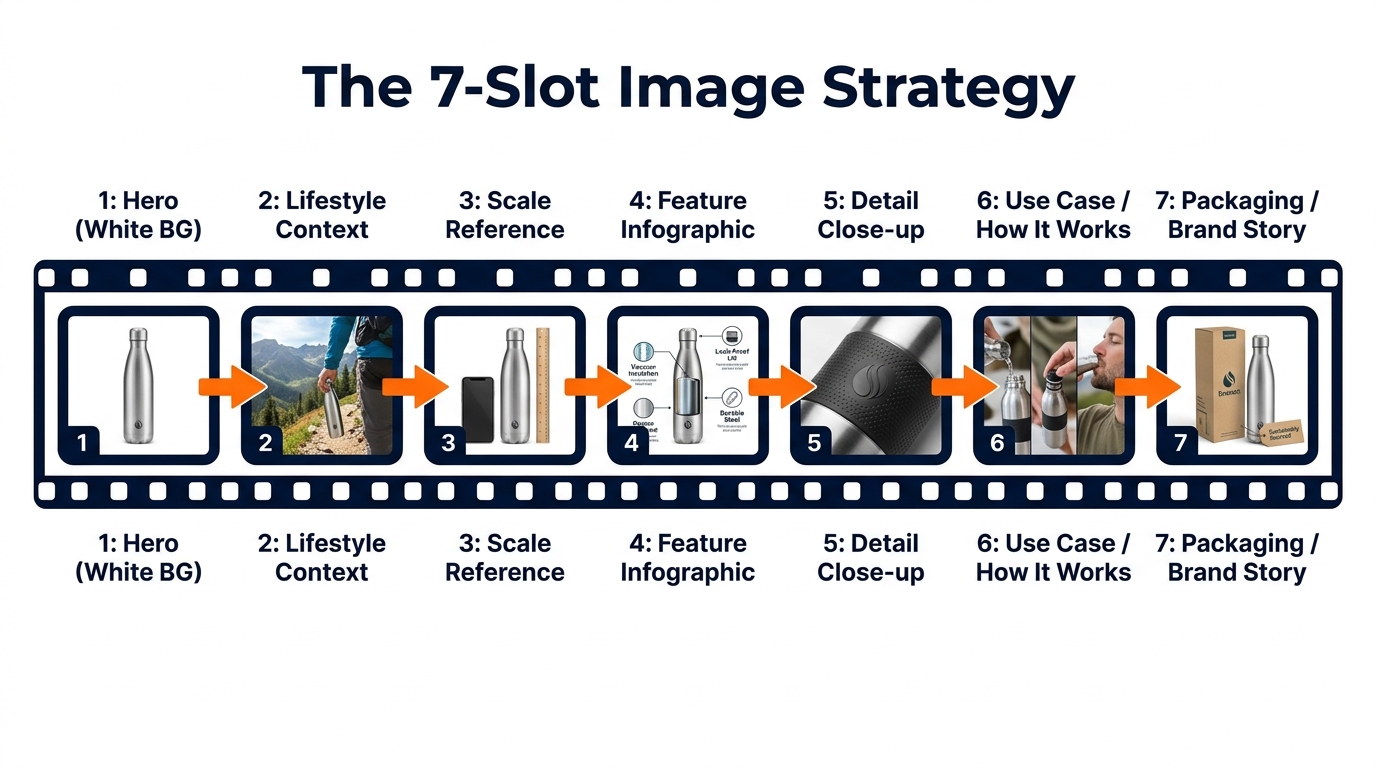
    Slot 1: The Hero (White Background)

    As covered above: pure white, 85%+ fill, high resolution, no graphics. Optimized for search result thumbnails and first-impression quality signals.

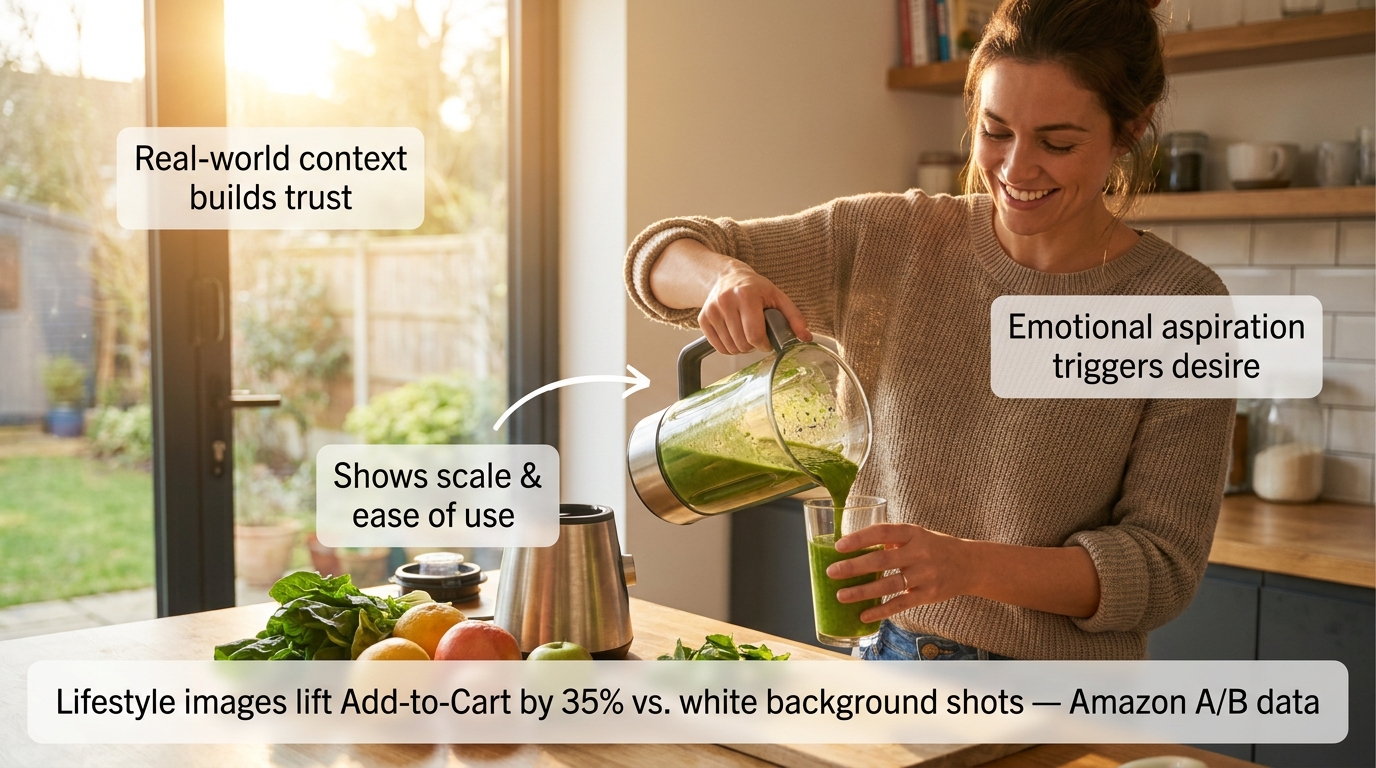
    Slot 2: Lifestyle Context

    The first secondary image should immediately answer “what does this look like in the real world?” Show the product being used by a person or placed in an environment that reflects your target customer’s life. This image performs a critical emotional function: it invites the buyer to project themselves into the scene. They stop evaluating the product abstractly and start imagining themselves owning it. Research from Amazon’s own data suggests that contextual images correlate with up to 40% higher conversion rates compared to product-only secondary images.

    Slot 3: Scale Reference

    Ambiguous size is one of the most common reasons shoppers abandon Amazon purchases and leave negative reviews. Slot 3 should establish scale unambiguously, by showing the product next to a familiar reference object (a hand, a coin, a standard household item) or against a measuring tape. Dimension infographics — the product with labeled measurements overlaid — also work well here. The goal is that after seeing this image, the buyer has zero doubt about how large or small this product actually is.

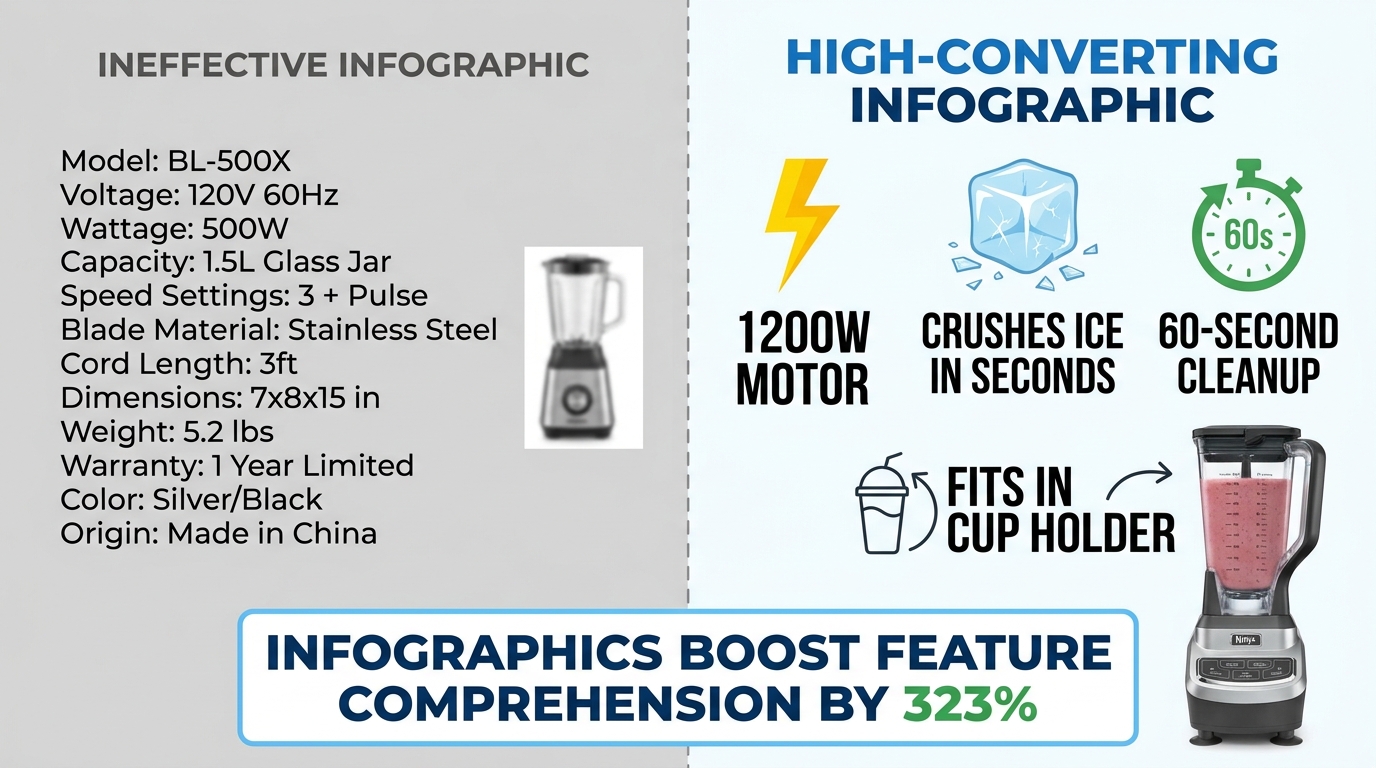
    Slot 4: Feature Infographic

    This is where you make the product’s key benefits legible at a glance. Feature callouts, labeled arrows, material specifications, compatibility information. Unlike slots 2 and 3 which build emotional connection and practical understanding, slot 4 speaks to the analytical buyer who wants to verify that the specifications match their needs. Well-designed infographics here can preempt the most common questions and answers submitted on your listing.

    Slot 5: Detail Close-up

    What is the one detail of your product that competitors can’t match — or that looks significantly better up close than it does at full size? This slot exists to show that detail in its best possible form. Stitching on a bag. The grain of a wood surface. The mechanism of a clasp. The texture of a material. Whatever makes your product worth more than the cheaper version, show it at maximum zoom.

    Slot 6: Use Case / How It Works

    For products where usage isn’t immediately obvious, or where the purchase decision hinges on whether the product will work for a specific scenario, slot 6 demonstrates the product in action. Before-and-after comparisons work well here if your product solves a problem. Step-by-step visual instructions for products with a learning curve also reduce friction by preempting “will I be able to figure this out?” anxiety.

    Slot 7: Packaging / Brand Story

    The final slot is where you complete the experience and reduce post-purchase anxiety. Show the product packaging clearly. If the product is frequently gifted, show it gift-ready. If it’s sold with accessories, show the full contents of what arrives. This image answers the final question: “What exactly am I going to receive?” Buyers who know exactly what’s in the box have lower return rates, fewer negative reviews, and higher likelihood of leaving positive feedback.

    Infographics That Actually Convert (Not Just Look Good)

    Comparison of weak vs strong Amazon product infographics showing clarity and text legibility differences

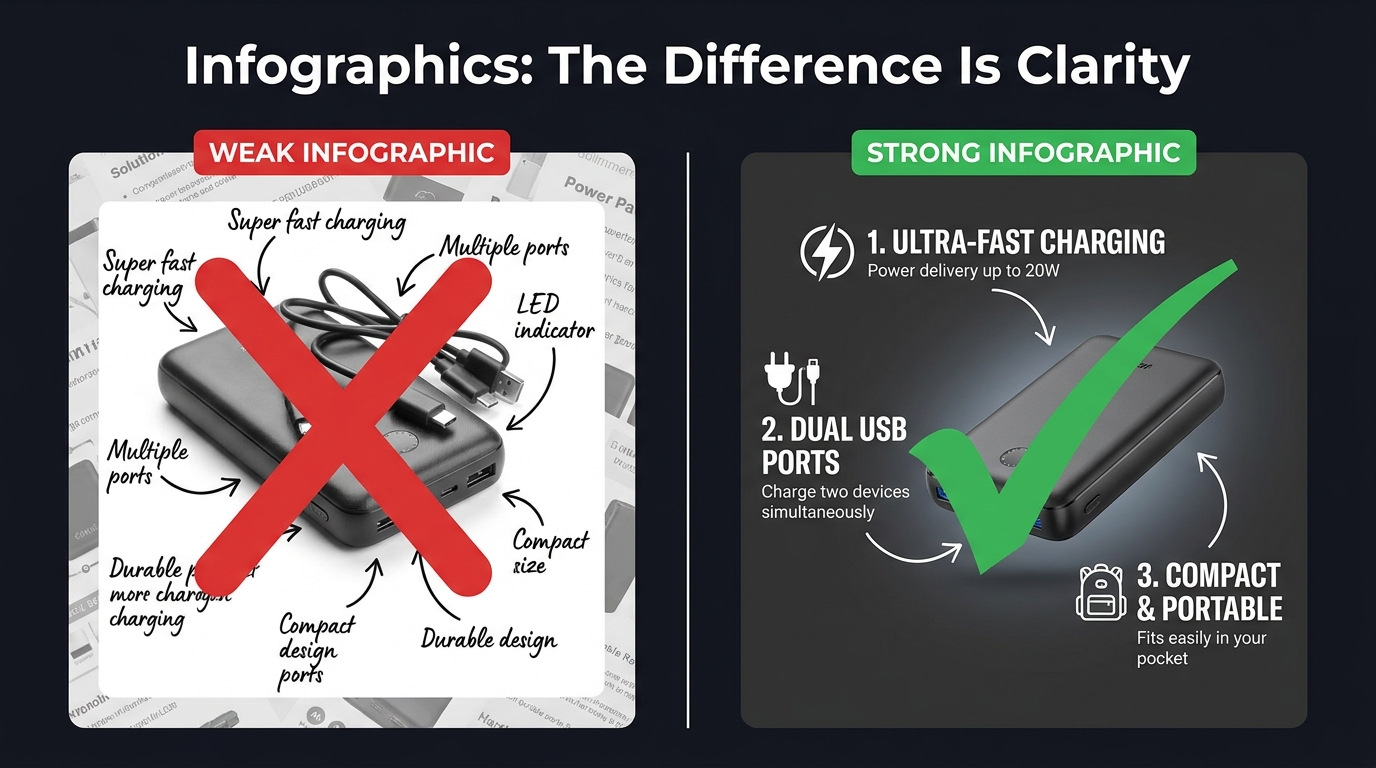
    Product infographics have become near-universal among serious Amazon sellers. The problem is that most of them are designed to look comprehensive rather than communicate clearly. They’re cluttered with feature callouts, competing visual elements, decorative design choices that obscure rather than illuminate, and fonts that look beautiful at desktop scale but become completely illegible as a mobile thumbnail.

    An infographic that can’t be read is worse than no infographic at all. It signals effort without delivering information — a combination that reads as noise rather than signal.

    The Legibility Hierarchy

    Effective infographics follow a strict visual hierarchy. The product image itself occupies 50–60% of the frame. Feature callouts are limited to four to six maximum — not because you don’t have more features, but because each additional callout competes for attention with every other callout. When everything is highlighted, nothing is highlighted.

    Font size matters more than most sellers realize. At minimum, your largest text elements should be readable when the image is displayed at 100 pixels wide — the approximate size of a mobile search thumbnail. Use clean, geometric sans-serif typefaces. Script and decorative fonts look elegant at full size; they become illegible marks at small sizes.

    Rufus AI and Image Text Recognition

    There’s a functional reason to optimize infographic legibility beyond human readers. Amazon’s AI assistant Rufus, which handles an increasing share of on-platform product discovery queries, uses OCR (optical character recognition) to read text from listing images. Well-designed infographics with clear, legible text give Rufus more data to index about your product — which can positively influence visibility in AI-driven search results. Cursive fonts, overly decorative typography, and low-contrast text-on-background combinations are invisible to OCR systems. Clean, high-contrast, sans-serif text is fully readable.

    “Us vs. Them” Comparison Charts

    One of the highest-performing infographic formats on Amazon is the product comparison chart — a table that compares your product against a generic “standard alternative” across a series of features. You cannot name competitors directly, but you can compare against “similar products” or “the competition” using feature checkboxes.

    These charts work because they reframe the buying decision. Instead of evaluating your product in isolation, the buyer is now evaluating it against a weaker alternative. The comparison does the persuasion work so your bullet points don’t have to. The most effective versions of these charts are selective: they highlight the specific dimensions on which your product wins, not a comprehensive feature list where your product might be neutral or weaker.

    Before-and-After as Proof

    For problem-solution products — cleaning supplies, skincare, organization tools, fitness equipment — before-and-after images embedded within an infographic are among the most persuasive visual formats available. They make the benefit concrete. Shoppers don’t have to imagine the outcome; they can see it. The key is that the “after” image needs to be genuinely dramatic enough to justify the format. A subtle improvement shown as a before-and-after signals that the improvement isn’t actually that meaningful.

    Lifestyle Images: What Separates Scroll-Stoppers from Stock Photo Clones

    Lifestyle photography is arguably the most frequently misunderstood element of an Amazon image stack. Many sellers treat it as decoration — a nice-to-have that makes the listing look more professional. The reality is that lifestyle images perform specific, measurable psychological work, and when that work is done poorly, they actively hurt conversions.

    The Aspiration Alignment Problem

    The function of a lifestyle image is to allow a shopper to see themselves in the scene. This only works if the scene accurately reflects the aspirational self-image of your actual target customer. Generic lifestyle photography — stock models who don’t look like your buyer, environments that feel staged rather than real, scenarios that don’t match how your customer actually uses the product — creates a psychological disconnect rather than a connection.

    A kitchen gadget marketed to home cooks needs lifestyle images that feel like a real kitchen, not a photoshoot kitchen. A travel bag needs lifestyle images from actual travel contexts, not a model posing with a bag in front of a white backdrop. The gap between “this feels like my life” and “this looks like an advertisement” is the gap between a lifestyle image that converts and one that doesn’t.

    People in the Frame Increase Conversions

    Multiple studies on e-commerce photography have confirmed that images including human subjects — hands, faces, full figures in context — consistently outperform product-only images in secondary listing slots. There are several reasons for this. Human faces direct attention and create emotional resonance. Hands holding or using a product provide unconscious scale reference. People in context model the usage scenario, reducing ambiguity. And humans are simply neurologically interesting to other humans in a way that isolated objects are not.

    The key is that the person in your lifestyle image should match your buyer’s demographic as closely as possible. A product targeting middle-aged women that features exclusively 25-year-old male models is producing cognitive friction, not connection.

    Environment as a Trust Signal

    The background and environment of your lifestyle images communicate as much as the product itself. A clean, well-lit kitchen tells the buyer that your product belongs in quality households. A cramped, cluttered background with poor lighting signals that the product is a budget purchase. The production quality of your lifestyle photography sets a price anchor in the buyer’s mind before they’ve seen the price. Premium environments justify premium pricing.

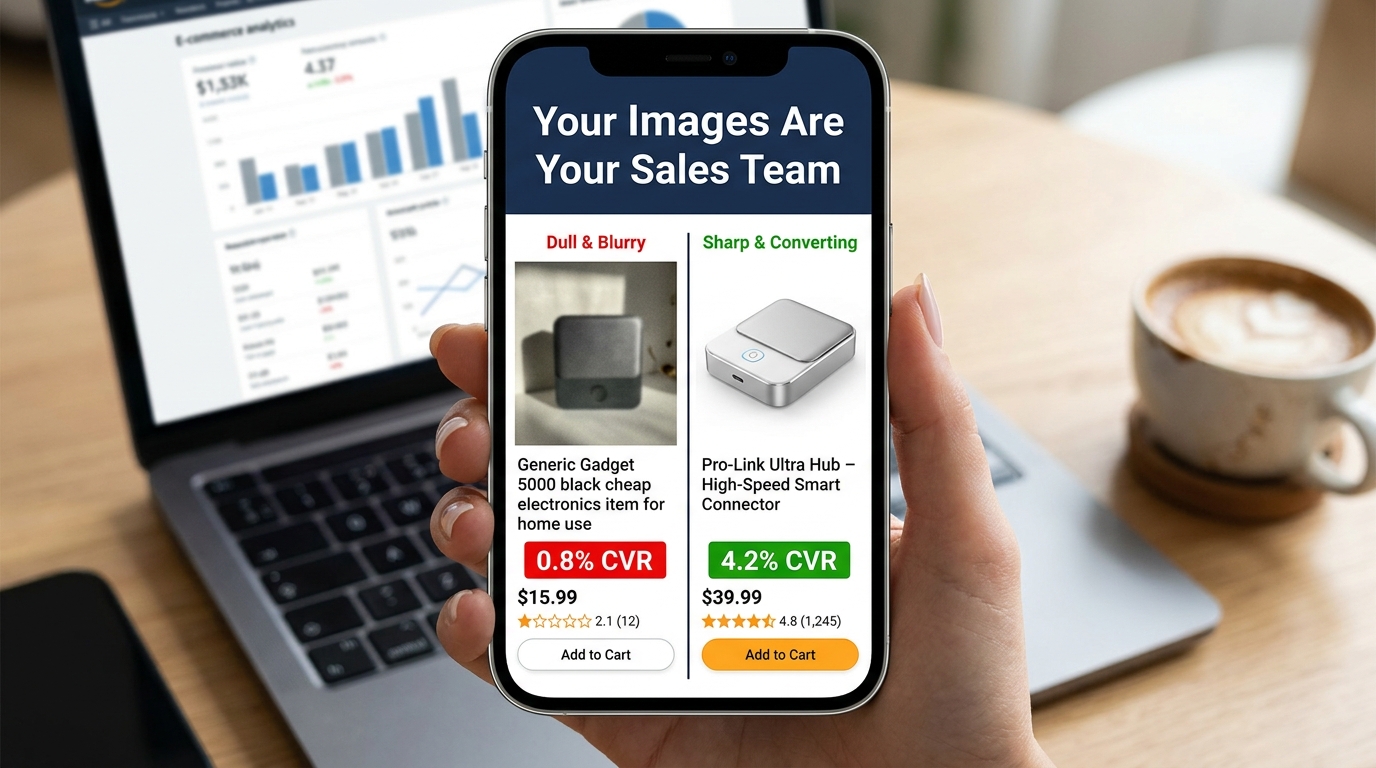
    The Supplier Photo Trap: Why Generic Images Force You Into Price Wars

    There is a specific and painful competitive dynamic that happens to sellers who rely on supplier-provided photos. Because supplier photos are typically distributed to every reseller who purchases that product, multiple listings in the same category are showing identical images. The buyer sees the same photo three or four times across different listings. At that point, the only visible differentiator is price.

    This is the supplier photo trap: using generic images doesn’t just fail to differentiate you — it actively positions you as a commodity, a price-per-unit proposition. You become interchangeable with every other seller offering the same product. Your only competitive lever is margin erosion.

    The Investment Calculation

    Professional product photography is frequently cited by sellers as an expensive upfront investment that they’d rather defer. The math, however, rarely supports deferral. A professional product photography session for a single ASIN typically costs between $300 and $800 for a full image set including hero, lifestyle, and infographic components. For a product generating $5,000 in monthly revenue at a 15% conversion rate, a 1 percentage point improvement in conversion rate (from 15% to 16%) — well within the range that professional photography routinely delivers — generates roughly $333 in additional monthly revenue. The photography pays for itself in under three months.

    The cost of not investing in professional images — sustained below-market conversion rates, depressed organic ranking (which responds to conversion signals), and the race to the bottom on pricing — compounds indefinitely.

    What to Look for in a Product Photographer

    Not all product photographers are equally suited for Amazon. The criteria that matter for Amazon specifically are somewhat different from those that matter for brand lookbooks or editorial photography:

    • Amazon compliance knowledge. A photographer who knows the RGB 255, 255, 255 rule and how to achieve it reliably in post-processing is worth significantly more than one who doesn’t. Some photographers charge extra to “clean up” backgrounds in editing; others build it into their standard workflow.
    • Experience with mobile thumbnail optimization. Ask to see examples of their work in Amazon search results. How does the product look as a small thumbnail? Does the product fill the frame?
    • Lifestyle photography capability. Separate from hero shots, lifestyle photography requires scouting or building appropriate sets, coordinating with models, and understanding how to direct “real use” scenarios. Not all product photographers have this skill set.
    • Turnaround and revision policy. Listing optimization is iterative. You may need to update images as you gather conversion data. A photographer who charges full rate for every revision is going to slow your optimization cycle.

    Mobile-First Image Design: The 6-Inch Screen Test

    Mobile phone mockup showing Amazon product listing optimization for mobile shoppers with 79% mobile stat

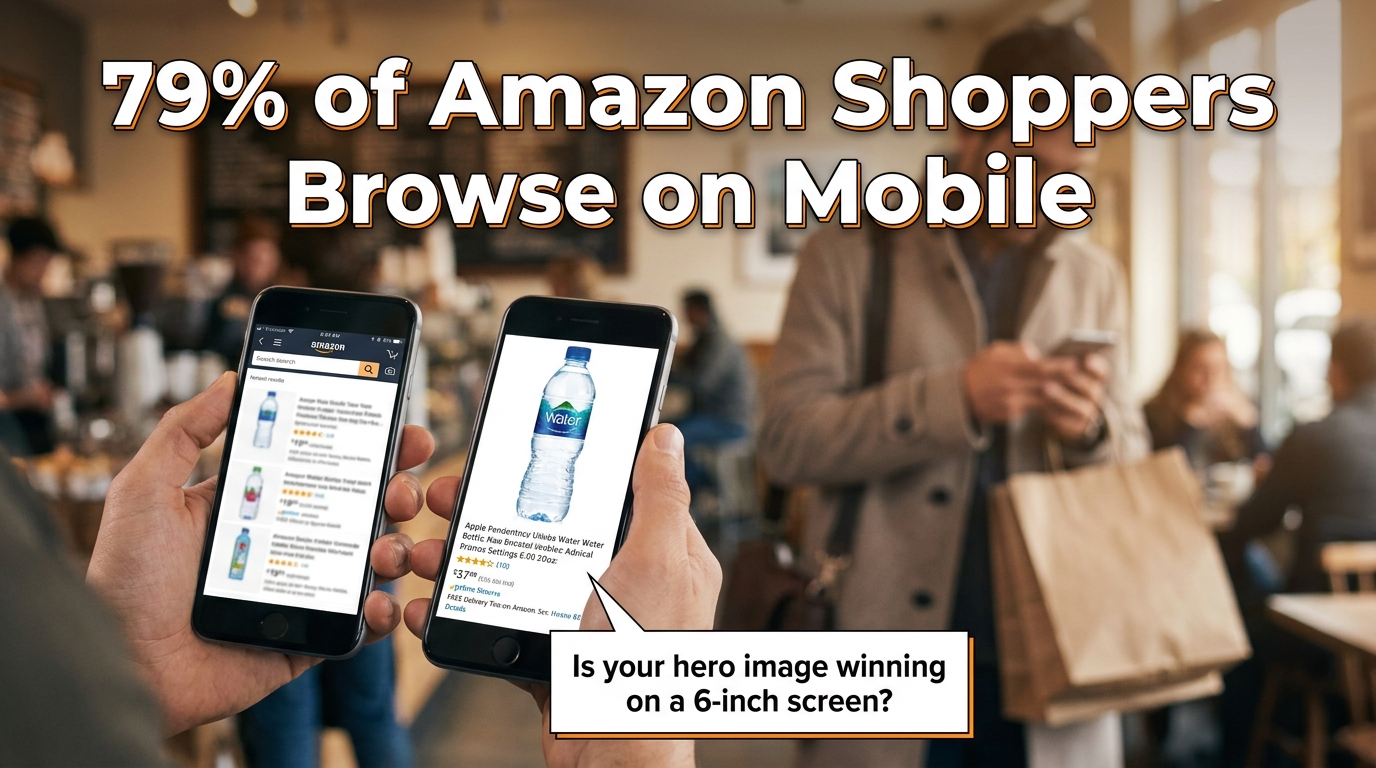
    The majority of Amazon traffic in 2026 arrives on mobile devices. Depending on the category, mobile browsing accounts for somewhere between 60% and 79% of Amazon sessions. This isn’t a trend that’s still emerging — it’s been the dominant channel for several years. And yet, a significant number of Amazon sellers are still designing and evaluating their listing images on desktop monitors.

    The result is image sets that look excellent on a 27-inch display and are borderline unusable on a 6-inch phone screen. This is a fixable problem, but fixing it requires changing how you evaluate your work.

    The Thumbnail Test

    Before finalizing any hero image, run what photographers and Amazon optimization specialists call the thumbnail test. Reduce your proposed hero image to 200 pixels wide and evaluate it at that size. Does the product still read clearly? Is it identifiable at a glance? Does it look sharp or pixelated? Does it look larger and more premium than the thumbnails around it in a mock search results grid?

    If the product is hard to identify at thumbnail size, or if it looks smaller and less impressive than competitors’ thumbnails, the hero image needs to be reworked regardless of how it looks at full resolution. The hero image will first be seen as a thumbnail. Optimize for the format it will actually appear in.

    Text Legibility on Mobile

    Infographic text that’s readable at 1,500 pixels wide may become completely illegible at the 400-pixel width of a mobile product image display. The practical rule of thumb: if you cannot read the text when the image is displayed at the width of a typical smartphone screen (roughly 375 to 414 pixels), the text will not be read by most of your buyers.

    This has real consequences. An infographic designed to communicate five key benefits actually communicates zero if the text is illegible on the device your buyers are using. The solution is to be ruthless about text size, to limit the amount of text per image, and to rely more heavily on iconography — which scales better than text — for secondary information delivery.

    Vertical vs. Horizontal Framing

    Amazon’s standard product image ratio is a square (1:1). On mobile, the product detail page displays the main image as a square occupying the full width of the screen. This is actually favorable for product photography — the square format is generous, and a product photographed to fill it well will look impressive on mobile. Where sellers run into trouble is with secondary images that are composed with wide horizontal elements that lose impact when constrained to the square format. Design all secondary images to work within the square frame, with the most important visual information concentrated in the center of the frame where mobile cropping is least likely to affect it.

    A/B Testing Your Way to Better CTR with Manage Your Experiments

    Amazon Seller Central Manage Your Experiments A/B testing dashboard showing Version B winning with 62% higher CTR

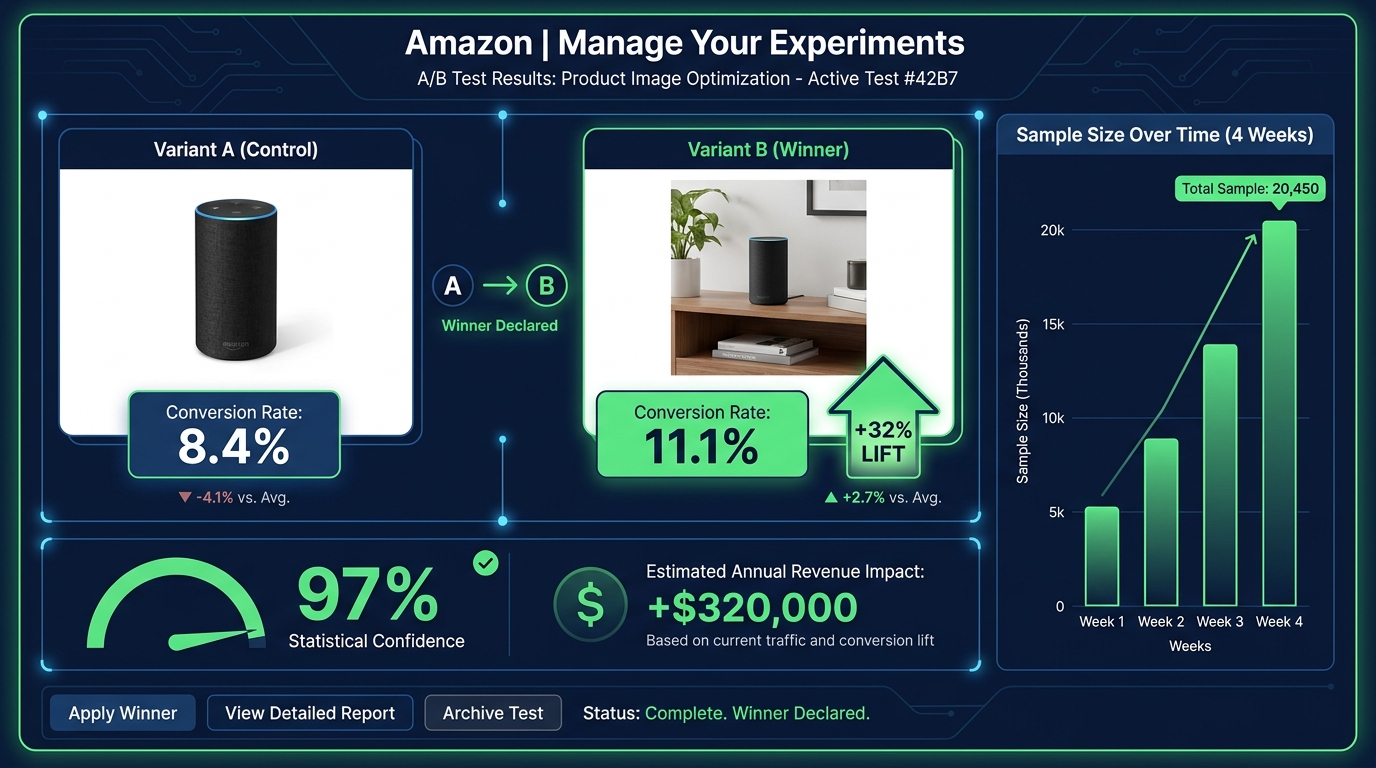
    Most Amazon sellers optimize their images once at launch and leave them alone. The highest-performing sellers treat images as a continuously iterated variable — something to test, measure, and improve on a regular cadence. Amazon’s native A/B testing tool, Manage Your Experiments, makes this process accessible to brand-registered sellers without requiring any third-party tools.

    What Manage Your Experiments Actually Tests

    Manage Your Experiments allows brand-registered sellers to run controlled split tests on several listing elements including main images, A+ Content, titles, and product descriptions. For image testing specifically, you create two versions of the element you want to test, Amazon splits your traffic between the two versions, and after a statistically significant sample period (typically four to eight weeks), the tool reports which version performed better on key metrics including click-through rate, conversion rate, and revenue per visitor.

    The main image is the highest-priority element to test first, because it directly affects CTR from search results — the metric that controls how much organic traffic your listing receives. A CTR improvement is not just a revenue increase; it’s an input into Amazon’s A10 ranking algorithm. A listing that gets clicked more often ranks higher, which generates more traffic, which generates more clicks. The compounding effect of CTR improvement is significantly larger than the immediate revenue impact.

    What to Test First

    The most productive main image tests focus on variables with the highest potential for differentiation:

    Angle and orientation. Test your current standard angle against an alternative perspective. A three-quarter view against a straight front view. An elevated view against an eye-level view. Angle changes often produce the largest CTR differences because they affect how the product appears in thumbnail comparison with competitors.

    Single item vs. multi-item context. For some products, showing a single clean unit on white background beats showing the product alongside related accessories. For others, context props (a glass of water next to a supplement bottle, a cutting board next to a knife set) perform better. Without testing, you’re guessing.

    Packaging on vs. packaging off. For products where unboxed and boxed presentations are both plausible, test both. Some categories reward the “ready to use” unboxed appearance. Others benefit from the retail packaging shot that signals the product makes a good gift.

    Reading the Results Correctly

    Manage Your Experiments provides statistical confidence scores along with the performance data. Do not make decisions based on preliminary data before statistical significance is reached. It is extremely common for one variation to appear to be winning decisively after two weeks, then for the results to normalize or reverse as the sample size grows. Wait for Amazon’s confidence threshold — they recommend at least 90% statistical confidence — before treating any result as conclusive.

    Also important: document your tests. Keep a running record of what you tested, what won, and by how much. Over time, this record reveals patterns — perhaps angles consistently outperform flat presentations for your product type, or lifestyle contexts in your hero image consistently underperform clean white backgrounds even though conventional wisdom says otherwise. Your accumulated test data is genuinely proprietary competitive intelligence.

    A+ Content: Extending the Visual Story Below the Fold

    For brand-registered sellers, A+ Content (formerly Enhanced Brand Content) extends the visual real estate of your product listing beyond the seven standard image slots. A+ modules appear below the product description and bullet points, occupying a significant portion of the page before reviews begin. They’re widely treated as secondary to the main image stack, but the data suggests that’s a mistake.

    Amazon’s own reporting indicates that Basic A+ Content increases sales by up to 8% on average. Premium A+ Content — available to sellers who have published A+ on a qualifying number of ASINs — can lift sales by up to 20%. Those are meaningful numbers on any ASIN with established revenue, and they’re achievable purely through optimizing content that many sellers either haven’t published or haven’t updated since their initial listing launch.

    Treating A+ as Continuation, Not Repetition

    The most common mistake sellers make with A+ Content is repeating information already communicated in the main image stack. If your slot 4 infographic already covers the key features, restating those same features in your A+ modules adds length without adding value. Shoppers who scroll to A+ Content have already seen your main images. They’re looking for something new — deeper information, greater detail, reassurance on a point the main images couldn’t fully address.

    Effective A+ Content strategies use the expanded visual space for:

    • Brand narrative. Who makes this product, why does it exist, what’s the philosophy behind it? A+ is where brand story can be told with enough visual depth to feel authentic rather than promotional.
    • Comparison tables. Product comparison modules within A+ allow structured comparison of multiple SKUs in your line, or comparisons against non-specific generic alternatives. These are particularly valuable for product lines where buyers commonly ask “which version should I buy?”
    • Deep feature explainers. Technical products, products with unique mechanisms, or products with complex usage protocols benefit from the expanded space A+ provides for detailed explanation. Where a main image infographic is limited to four or five bullet points, A+ can support a full feature breakdown with larger imagery and richer detail.
    • Social proof integration. Some A+ templates allow the incorporation of quote-style testimonials or user scenario imagery that reinforces the lifestyle messaging from your main image stack.

    Premium A+ Content: When It’s Worth It

    Premium A+ Content unlocks interactive modules including video embeds, interactive hotspot images (where buyers can click areas of a product image to reveal feature details), and larger format imagery. The interactive hotspot module in particular represents a meaningful evolution in on-page conversion tools — it transforms a static product image into an exploratory experience that keeps buyers engaged on your listing longer.

    Longer time-on-page is a positive signal in Amazon’s ranking algorithm. A listing that holds buyer attention — through interactive A+ modules, video, and a compelling image sequence — will rank above an identical listing with lower engagement metrics. The relationship between listing quality and organic visibility is circular: better content drives better engagement, better engagement drives better ranking, better ranking drives more traffic.

    Image Mistakes That Trigger Suppression, Cost Rankings, and Kill Sales

    Beyond the strategic considerations, there are specific technical and compliance errors that do immediate, measurable damage to listing performance. Some of these trigger automatic suppression — Amazon removes your listing from search results until the issue is corrected. Others are more subtle, degrading conversion rates without triggering any alerts.

    Immediate Suppression Triggers

    • Non-white backgrounds on the main image. Even a background that appears white to the human eye can be slightly off the required RGB 255, 255, 255 value. Always verify the background color value in image editing software, not by visual inspection.
    • Promotional text on the main image. “Sale,” “Best Seller,” discount percentages, “Free Shipping” badges — any of these on the primary image will trigger suppression.
    • Images below 1,000 pixels on the longest side. This is the minimum for display; in practice, images below this threshold may not trigger immediate suppression but will degrade zoom functionality and perceived quality.
    • Showing products not included in the listing. If your listing is for a single item and your main image shows two items, that’s a suppression trigger. The main image must accurately represent what the buyer will receive.

    Non-Suppression Errors That Still Cost Sales

    • Using supplier stock photos. As discussed, not a compliance violation but a serious strategic mistake that commoditizes your listing.
    • Insufficient image variety. Running five images when nine are available is leaving persuasion tools on the table.
    • Misaligned lifestyle imagery. Lifestyle images that don’t reflect your actual target demographic create psychological friction rather than connection.
    • No video. Amazon allows one video on standard listings and multiple videos for Brand Registry members. Listings with product videos have meaningfully lower return rates — some sources cite up to 30% reduction in returns for categories where product mechanics are demonstrated — and higher conversion rates because video is the closest simulation of actually using the product before purchase.
    • Infographics with low-contrast or decorative fonts. Illegible infographics don’t communicate features — they communicate visual noise, and they’re invisible to Rufus AI’s OCR indexing.
    • Ignoring image order. The sequence in which Amazon displays secondary images is controlled by the seller. Many sellers upload images in whatever order they happened to be processed, rather than the strategic sequence that follows the buyer journey. Audit your current image order and resequence if necessary.

    The “Newly Updated” Image Risk

    A less-discussed hazard: updating images on a high-performing listing without testing the new version first. Sellers who redesign their entire image stack and replace it wholesale — without A/B testing — frequently experience conversion rate drops from perfectly compliant, professionally produced new images that simply communicate less effectively than the previous version. The old images had accumulated organic performance data. The new images, whatever their aesthetic quality, are unproven.

    The correct protocol for image updates on existing listings is: test the new version against the existing one using Manage Your Experiments before replacing anything. Only replace the existing images if the test data confirms the new version performs better.

    The Amazon Image Audit: A Section-by-Section Checklist

    Amazon listing image audit checklist showing all required image optimization criteria with green checkmarks

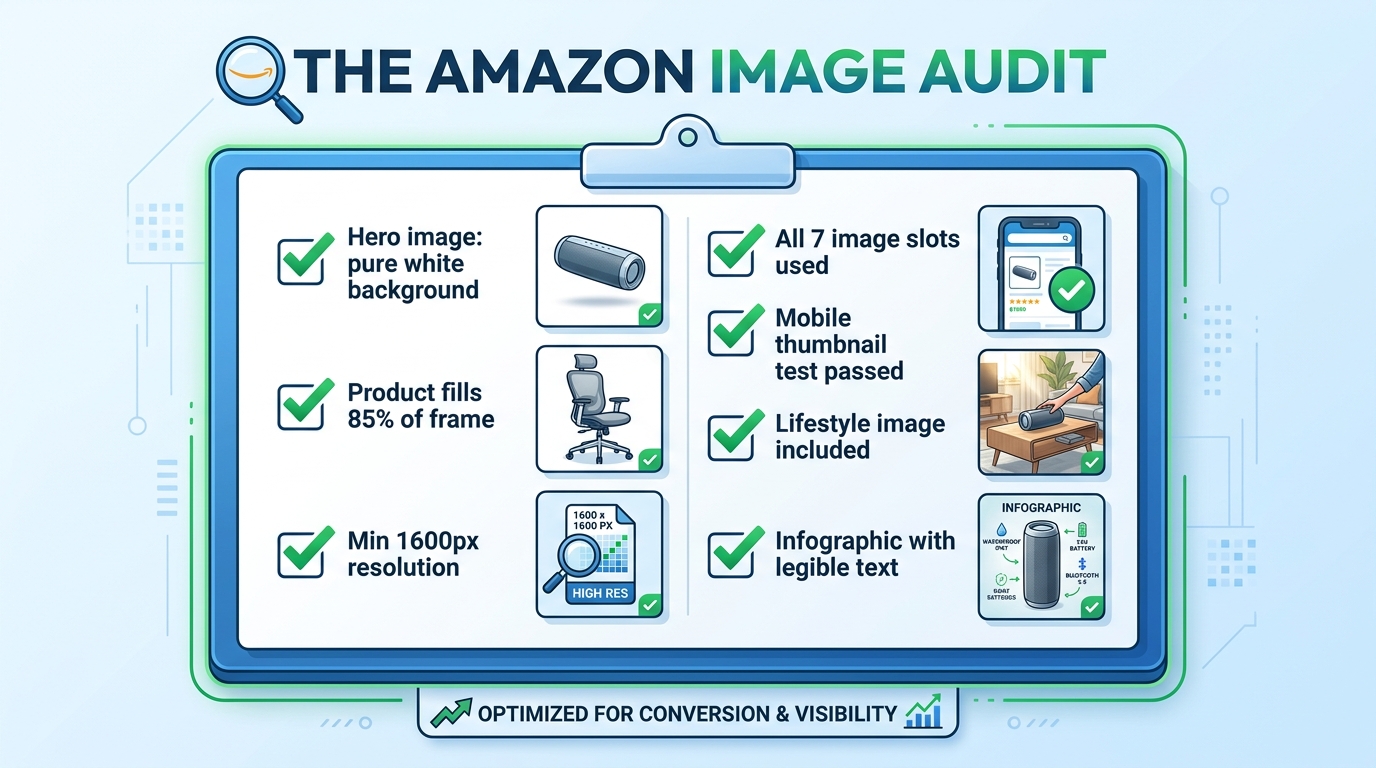
    Rather than leaving the “what to do next” question abstract, here is a practical audit framework to assess the current state of any listing’s image set. Work through this systematically on every ASIN in your catalog.

    Hero Image Audit

    • Verify background RGB value is exactly 255, 255, 255 in image editing software
    • Measure product fill ratio — is the product occupying at least 85% of the frame?
    • Check image dimensions — is the longest side at least 1,600 pixels?
    • Confirm no text, watermarks, props, or logos are present
    • Run the thumbnail test — reduce to 200px wide and evaluate clarity
    • Compare your thumbnail against the top three competitors in your search result — are you visually distinct?

    Secondary Image Audit

    • Count your current images — are you using all available slots?
    • Evaluate the sequence — does the order follow a logical buyer journey progression?
    • Assess lifestyle image demographic match — does the person/environment reflect your actual target buyer?
    • Check scale reference — is there an image that unambiguously communicates product size?
    • Review infographic text legibility — display at 400px wide and verify all text is readable
    • Check for video — is at least one product video uploaded?

    A+ Content Audit

    • Is A+ Content published on this ASIN?
    • Does the A+ Content add new information not already in the main image stack?
    • Is the A+ imagery consistent in style and quality with the main images?
    • Are comparison modules present to help buyers choose between variants or understand relative value?
    • Have Premium A+ modules been evaluated for eligibility?

    Testing Cadence

    • Is an active Manage Your Experiments test currently running on the hero image?
    • Are test results documented and archived?
    • Is there a scheduled review date for secondary image performance?

    Work through this audit once per quarter at minimum. High-volume ASINs — those generating significant revenue or ad spend — merit more frequent review, especially when competitive dynamics in the category change. A competitor launching with a dramatically better image set is a signal to accelerate your own testing cadence.

    Bringing It All Together: Your Images Are a System, Not a Collection

    The most important conceptual shift in this entire article is this: your Amazon listing images are not seven separate photographs. They are a single, sequenced visual argument for why a buyer should choose your product over every alternative available to them in that moment.

    Every slot has a defined job. The hero image earns the click. The lifestyle image earns the emotional connection. The scale reference removes a common purchase blocker. The infographic validates the analytical buyer. The close-up justifies the price premium. The use-case demonstration eliminates usage anxiety. The packaging shot completes the transaction mentally before the buyer has added to cart.

    When any slot is absent, or when it’s doing a job that belongs to a different slot, the system breaks down. Buyers fall through the gaps — they reach the end of your image stack with an unanswered question, and they go find the answer on a competitor’s listing. Often, they buy there instead.

    The sellers who understand this — who approach every image as a strategic tool within a larger system — convert at rates that make their competitors wonder what they’re doing differently. The answer is usually not that they have better products. It’s that they’ve built a visual argument systematic enough to close the sale before the buyer even gets to the bullet points.

    Start with the audit. Fix the compliance issues first. Then address the strategic gaps. Then test. Then improve. The compound effect of iterating through that cycle — audit, fix, test, improve — is the only sustainable path to conversion rates that hold up regardless of what competitors do next.

  • What Your Amazon Images Are Really Costing You (And How to Fix It, Section by Section)

    What Your Amazon Images Are Really Costing You (And How to Fix It, Section by Section)

    Split-screen comparison: poor Amazon product image losing clicks vs. optimized image winning conversions with +32% conversion lift stat

    Most Amazon sellers focus their optimization energy in the wrong places. They obsess over keyword density in bullet points, fiddle with PPC bid adjustments, and chase backend search terms — while the single most powerful lever for clicks and conversions sits right at the top of every listing, doing damage no one is measuring.

    Their images.

    Here’s the uncomfortable reality: a shopper who lands on your listing will form a visual impression in roughly 50 milliseconds. Before they’ve read your title, before they’ve scrolled to your bullet points, before they’ve checked your reviews — they’ve already decided whether this product looks worth their time. That snap judgment is made entirely by your images.

    And yet most Amazon listings are built with images that were assembled quickly, tested never, and optimized for desktop in a world where more than 70% of Amazon traffic is now mobile. The result is a silent, invisible tax on every impression your listing receives — lower click-through rates, higher bounce rates, more abandoned carts, and ultimately, margin that quietly bleeds out without a clear culprit on your dashboard.

    This isn’t another post about making sure your main image has a white background. You know that already. This is a detailed, section-by-section breakdown of what truly high-performing Amazon image stacks look like in 2026 — covering the science of sequencing, the specific mistakes that cost sellers real money, what Amazon’s Rufus AI is now extracting from your images, and how to build a testing loop that turns your image gallery into a compounding asset.

    Let’s start at the beginning — with why images aren’t just a creative decision, but an economic one.

    The Visual First Impression: Why Images Decide the Sale Before Buyers Read a Word

    Amazon selling is, at its core, a conversion rate business. Traffic matters — but what you do with that traffic is what separates profitable listings from expensive ones. And the evidence is increasingly clear that images are the single biggest driver of whether a visitor converts or walks.

    JungleScout research ranks product images as the second most critical purchase factor for Amazon buyers, sitting just behind price. That’s ahead of reviews, shipping speed, and brand reputation. When you factor in that images directly influence price perception — a professional image makes a product look premium, justifying higher prices — the argument for treating image optimization as a top-tier business activity becomes overwhelming.

    The 50-Millisecond Window

    Research on visual processing consistently shows that human brains form first impressions of visual content in approximately 50 milliseconds. For Amazon shoppers, that 50-millisecond window happens in the search results grid, where your hero image thumbnail competes against every other product on the page.

    In that instant, a shopper’s brain is running a rapid-fire filter: Does this look professional? Does this look like what I’m searching for? Does this look worth clicking? If the answer to any of those questions is “not sure,” they scroll past. There’s no second chance in the search results — your hero image gets one shot.

    Professional, high-quality images have been shown to produce conversion rates 2-3x higher than amateur or low-quality shots, according to Statista data. That’s not a marginal gain. A listing converting at 6% instead of 3% on the same traffic doubles revenue without a dollar more in ad spend.

    Images as Your Silent Sales Team

    The 65-70% of purchase decisions that are driven by images aren’t just about aesthetics. Images answer the questions a buyer would otherwise have to dig through text to find: What does this actually look like? How big is it? How do I use it? What’s in the box? Will it fit my life?

    Every image slot in your gallery is an opportunity to answer one of those questions before doubt can take root and send the shopper elsewhere. The sellers who treat their image stack like a sales team — each image with a specific job, answering a specific objection, advancing a specific conversation — are the ones whose conversion rates hold up even in crowded categories.

    The sellers who upload seven vaguely similar product photos and call it done are running a listing that’s working against them every single day.

    The Hero Image: Engineering a Thumbnail That Commands the Click

    Amazon mobile search grid showing one optimized product thumbnail standing out with 85% frame fill vs. competitors with dead space

    Your hero image — the main product shot shown in search results — is functionally an advertisement. It’s the creative that runs every time someone searches a keyword you rank for, and its job is a single, specific one: get the click. Not sell the product. Not explain the features. Get. The. Click.

    Everything else in your listing exists downstream of that click. The bullet points, the A+ content, the reviews, the video — none of it matters if the hero image doesn’t earn the visit. That’s why the hero deserves a level of attention and investment that most sellers reserve for their PPC campaigns.

    Amazon’s Non-Negotiable Technical Requirements

    Amazon’s requirements for the main image are strict, and violating them risks listing suppression. The rules are worth internalizing, not just bookmarking:

    • Pure white background: RGB 255, 255, 255 — not off-white, not light gray, not cream. Pure white.
    • Product fills at least 85% of the frame. This is a minimum. 90-95% is better.
    • No text, logos, graphics, watermarks, or borders overlaid on the product or background.
    • Minimum 1,000px on the longest side for the site; 1,600px to enable zoom (which improves conversion); up to 10,000px maximum.
    • Product must be shown outside packaging in most categories. No props or excluded accessories.
    • No multiple views of the same product in the main image.

    Amazon’s optimal specification is 1,600px or larger specifically because zoom functionality — the ability to hover and enlarge the image — has been shown to measurably improve sales. Don’t meet the minimum. Aim for 2,000px or higher for maximum quality at all display sizes.

    What “Commanding the Click” Actually Looks Like

    Within Amazon’s rules, there’s still significant room to differentiate. The best hero images share a few characteristics that go beyond technical compliance:

    Angle matters more than you think. The front-facing, flat product shot is the default — and for most categories, it’s what works. But the best angle is the one that makes your product’s most compelling feature immediately visible in a 200×200 pixel thumbnail. For a travel mug, that might be the lip-seal lid. For a knife, the blade profile. Test angles if you’re unsure.

    Contrast against the white background. White backgrounds make all products equal at a technical level — but visually, a product with natural contrast (dark colors, distinct edges, strong silhouette) pops far better than a light-colored product that blends into the white. If your product is white or light-colored, consider how professional lighting and shadow can create separation.

    Perceived quality through photography. The difference between a $200 professional product shoot and a phone photo isn’t just resolution — it’s lighting, shadows, reflections, and depth that signal to a buyer’s brain whether this is a premium product or a cheap knockoff. Professional photography for your hero image isn’t a nice-to-have. In most categories with competitive imagery, it’s table stakes.

    Dead Pixel Real Estate: The Hidden CTR Killer Most Sellers Ignore

    “Dead pixel real estate” is the term used among image optimization practitioners for the empty, unused space around a product in a hero image. It’s the blank white space that surrounds a product when the shot is taken from too far away, or when the original photography dimensions weren’t optimized for Amazon’s thumbnail format.

    In full desktop view, dead pixel space looks acceptable. But in Amazon’s search result grid — particularly on mobile — thumbnails are small and the competition for visual attention is fierce. Every pixel of empty white space is a pixel your product isn’t using. At thumbnail scale, a product that fills 65% of the frame looks noticeably smaller and less substantial than a competitor’s product filling 90%.

    Why This Matters at the Search Results Level

    At any given time on Amazon, your product thumbnail is displayed alongside 15-48 other thumbnails on a search results page. The cognitive load of choosing what to click is real — and shoppers make those micro-decisions based almost entirely on visual prominence and perceived quality.

    A product with significant dead pixel space around it reads as smaller, cheaper, and less important than its neighbors. It doesn’t matter if the product is actually premium — the thumbnail is the first impression, and perception is reality in the 50-millisecond window of a search results scroll.

    Optimizing for zero dead pixel space means cropping your image so the product fills 90-95% of the frame. If your original photography didn’t achieve this, it can often be corrected in post-production without a reshoot. The fix is frequently cheap. The cost of not fixing it compounds daily.

    The “Dead Pixel” Opportunity in Secondary Images

    The dead pixel concept also applies inversely to secondary images — where blank space can be deliberately used as “real estate” for value propositions. In infographic slots, sellers have used the white space around a product to place specification callouts, measurement indicators, and benefit bullets that technically don’t “overlay” the product itself.

    This approach threads the needle between Amazon’s rules (which prohibit text overlays on the main image) and the desire to communicate quickly in the secondary slots. It’s one of the more nuanced tactics available and, when executed cleanly, can make secondary images significantly more informative at a glance.

    The 9-Slot Image Sequence and the Psychology Behind Each Position

    Amazon 9-image slot storyboard sequence showing psychological buyer journey from curiosity through trust to purchase decision

    Amazon allows up to nine image slots plus a video slot for most categories. The vast majority of sellers use fewer than seven, and the ones who do use all nine frequently upload images in whatever order they happen to be ready — not in a deliberate sequence designed to move a buyer through a purchase decision.

    That’s a structural mistake. The image gallery is a sales funnel. Each slot corresponds to a different stage of the buyer’s cognitive journey, and a well-sequenced gallery moves shoppers from initial curiosity through evaluation, desire, objection-handling, and ultimately to the “Add to Cart” button. A randomly ordered gallery just gives shoppers more chances to find a reason to leave.

    The Nine-Slot Framework

    Here’s how high-converting sellers approach the 9-slot sequence:

    Slot 1 — The Hero: Pure white background, maximum frame fill, professional photography. Drives the click from search results. No information beyond the product’s visual quality and form factor.

    Slot 2 — The Top-3 Benefits Infographic: The buyer has clicked and is evaluating whether to stay. This slot answers: “Why this product?” Three bold, benefit-driven callouts with clean iconography. Not features — benefits. Not “1200W motor” — “Crushes ice in under 10 seconds.” This is where you address the emotional purchase driver immediately.

    Slot 3 — Lifestyle in Context: Show the product being used by a person in a real environment. This slot triggers aspiration and belonging. The buyer thinks: “That could be me.” It also communicates scale, ease of use, and the product’s fit into the buyer’s life — all without a word of text.

    Slot 4 — Feature Callouts with Close-Ups: Now the buyer is warming up and wants details. This slot goes deep on the product’s most important physical features — materials, components, specific design choices — with annotated close-up photography and short explanatory labels.

    Slot 5 — Dimensions and Scale Reference: One of the most common causes of returns is size mismatch. Buyers imagined the product was bigger or smaller than it actually is. A dedicated dimensions image — showing the product next to a recognizable scale reference (a hand, a common household item) alongside actual measurements — prevents this objection before it becomes a return or a negative review.

    Slot 6 — Comparison or Differentiation: If you have a legitimate advantage over the category standard — better capacity, more durable materials, more certifications, longer warranty — this is where to present it visually. A clean comparison chart (your product vs. “typical” competitor, not naming brands) addresses the “why not just buy the cheaper one?” objection directly.

    Slot 7 — Problem-Solution Narrative: Address the specific pain point your target buyer arrived with. “Tired of blenders that can’t handle frozen fruit?” This slot validates the buyer’s frustration and positions your product as the resolution. It’s the slot most sellers skip and the one that often moves the most hesitant buyers.

    Slot 8 — What’s in the Box: Show the full product contents laid out cleanly. This eliminates uncertainty (one of the primary drivers of abandoned carts) and creates positive surprise when the unboxing matches the image. It also signals quality packaging and attention to detail.

    Slot 9 — Social Proof or Trust Signal: Aggregate review ratings, certification badges, sustainability credentials, or user-generated content integrated into a clean graphic. This is the final reassurance before the purchase — the “others trust this, you can too” signal that closes hesitant buyers.

    Why Sequence Matters as Much as Content

    The same nine images in a different order perform differently. An image that works brilliantly in slot 3 can underperform in slot 7 because it’s answering a question the buyer hasn’t asked yet. The sequence mirrors the natural progression of a buyer’s internal monologue, and disrupting that progression creates friction. Friction kills conversions.

    Infographics That Actually Convert: Designing for the 3-Second Mobile Scan

    Side-by-side comparison of ineffective cluttered Amazon infographic vs. clean high-converting infographic with 323% comprehension stat

    Infographic images — the secondary images that overlay text, icons, and callouts on or around product shots — have become a standard part of Amazon listing optimization. But “having infographics” and “having infographics that convert” are two very different things. The Amazon search results pages in most competitive categories are now full of infographic images. Many of them don’t work.

    The data on infographics is compelling: adding infographic and scale images with text to a listing can improve customer understanding of product features by up to 323%, according to aggregated Amazon listing data. That’s a dramatic number. But that uplift requires the infographic to actually be readable and scannable — conditions that a surprising number of infographics fail to meet.

    The Mobile Rendering Problem

    Here is the core design mistake sellers make with infographics: they design them on a large desktop monitor at 1:1 scale, where text looks clear and readable, then upload them without checking how the image renders at mobile thumbnail size.

    On mobile — where over 70% of Amazon shopping occurs — an image designed at 2000×2000 pixels is rendered in a space roughly 350-450 pixels wide. Text that looked fine at desktop scale becomes illegible at that compression ratio. A six-point callout font becomes microscopic. A ten-bullet feature list becomes a gray blur.

    The result is an infographic that registers as “busy” or “complicated” rather than informative. Buyers swipe past it. The 323% comprehension uplift assumes the buyer can actually read the infographic — and on mobile, they often can’t.

    The 3-Second Scan Principle

    High-converting infographics are designed around a single constraint: a mobile shopper should be able to understand the core message within three seconds. Not absorb every detail — just get the point.

    That constraint leads to several specific design rules:

    • Maximum three focal points per image. One image, one message. If you’re trying to communicate five things in one infographic, you’re communicating zero of them clearly.
    • Font size of at least 30-40pt on the original image file so text remains readable at mobile compression ratios. Test by shrinking your image to 400px wide before uploading and checking legibility.
    • High-contrast text on a contrasting background. White text on a white product doesn’t work. Dark text on a light background or light text on a dark element — with clear visual separation — is the standard that survives mobile compression.
    • Icons over text where possible. A lightning bolt icon communicates “fast” instantly. Three words of text do not. Iconographic communication is faster and more mobile-resilient than text-heavy designs.
    • Benefit language, not feature language. “Fits in any standard car cup holder” beats “6.5cm diameter base.” The first is a benefit the buyer can instantly relate to their life; the second requires mental translation.

    The “One Infographic Per Pain Point” Rule

    Each infographic in your image stack should address exactly one buyer question or objection. Not a collection of facts about the product — one clear answer to one specific concern. “Will it last?” “How hard is it to clean?” “Is it the right size for my needs?” When an infographic tries to answer three questions at once, it answers none of them convincingly.

    This single-focus discipline also makes A/B testing infographics much more actionable. When you test two versions of an infographic and one performs better, you know exactly what variable moved the needle — because each image only had one variable to begin with.

    Lifestyle Photography: The Emotional Trigger That Turns Browsers Into Buyers

    Cinematic lifestyle product photo of woman using blender in bright kitchen with annotation callouts about trust, scale, and emotional aspiration triggers

    Amazon A/B testing data shows lifestyle images outperform standard white-background secondary shots by approximately 35% in Add-to-Cart actions. That’s a measurable, repeatable finding across multiple categories — and it makes intuitive sense once you understand what lifestyle images actually do psychologically.

    A white-background product image answers the question: “What does this look like?” A lifestyle image answers a fundamentally different — and far more powerful — question: “What will my life look like with this in it?”

    That shift from product-centric to life-centric framing triggers what psychologists call “mental simulation.” When a buyer sees a person using a product in a context they can relate to, their brain automatically begins simulating the experience of owning and using that product. Mental simulation is a key driver of desire — and desire is what converts browsers into buyers.

    What Makes a Lifestyle Image Work

    Not all lifestyle images trigger mental simulation effectively. The ones that do share specific characteristics:

    The model reflects the target buyer. A lifestyle image of a 22-year-old fitness influencer using a blender doesn’t resonate with a 45-year-old parent buying it for family meal prep. The most effective lifestyle images feature people whose demographics, environment, and life context mirror the target customer. This requires actually knowing your buyer — not just photographing whoever was available on shoot day.

    The environment is aspirationally realistic. “Aspirationally realistic” means the setting is attainable and relatable, not fantasy. A kitchen that’s beautiful but clearly someone’s actual kitchen. An office that’s clean and organized but recognizably an office. The aspiration is in the quality and atmosphere; the realism is in the believability. Pure fantasy settings (private yachts, penthouses for a $30 product) create cognitive dissonance that undermines trust.

    The product is shown in active use, not posed. A product sitting on a table with a person standing next to it is a prop photo. A product being actively used — hands on the handle, product in motion, someone mid-action — is a lifestyle photo. The distinction is the difference between showing what a product is and showing what a product does.

    The scale and ease of use are implicit. A lifestyle image should communicate “this is easy to use” and “this fits naturally into daily life” without stating either of those things. If the image requires the viewer to work to understand how the product is being used, it’s failing.

    Mobile-Testing Your Lifestyle Images Before Publishing

    68% of Amazon cart abandonments happen within 90 seconds of the first click, with mobile shoppers abandoning 2.1x faster than desktop users when images fail to communicate clearly. Before publishing any lifestyle image, view it on an actual mobile device at the size it will appear in the listing carousel. If the product isn’t immediately identifiable, if the scene reads as cluttered, or if the emotional message doesn’t land within two seconds — the image needs revision.

    This test takes 60 seconds and is skipped by almost every seller. Don’t skip it.

    What Rufus AI Reads in Your Images (And Why Most Sellers Are Missing It)

    Amazon’s Rufus AI — the conversational shopping assistant integrated into the Amazon app and website — represents a significant shift in how product discovery works. Rufus doesn’t just match keywords. It interprets product listings holistically, including the visual content, to answer natural-language shopper queries like “What’s a good blender for someone who makes smoothies every morning?” or “Show me a water bottle that fits in a car cup holder.”

    What most sellers don’t know is that Rufus uses optical character recognition (OCR) and computer vision to actively read and interpret the text and visual elements in your product images. Your infographics aren’t just for human eyes. Rufus is reading them too.

    How Rufus Extracts Image Data

    Through OCR, Rufus can read text overlaid on your secondary images — spec callouts, feature labels, dimension indicators, certifications. Through computer vision, it can analyze the visual content itself — identifying objects, contexts, and use cases depicted in lifestyle imagery.

    This means an infographic that reads “Holds 64 oz — Fits Standard Car Cup Holders” isn’t just communicating with a human buyer scanning your gallery. It’s feeding Rufus structured attribute data that can surface your product in response to the query “What’s a large water bottle that fits in my car?” — even if those exact words don’t appear anywhere in your title or bullet points.

    The implications are significant. For sellers competing in categories where listing text is already keyword-saturated, the image stack has become an additional indexable surface. The attributes you communicate visually are now functionally part of your product’s discoverable data set.

    Optimizing Images for Rufus Readability

    Several specific practices improve the quality of data Rufus can extract from your images:

    • Use large, high-contrast, readable fonts in infographics. If Rufus’s OCR can’t parse your text — because it’s in a stylized script font, at low contrast, or rendered too small — those attributes aren’t being captured. Clean, sans-serif fonts at adequate size are the most OCR-friendly choice.
    • Be specific in your callout text. “Large capacity” is vague and provides Rufus with limited searchable data. “Holds 64 oz — Fits standard cup holders” is specific and creates structured attributes that match specific queries. The more precise your callout language, the more useful it is to both Rufus and the buyer.
    • Use lifestyle images that clearly depict use cases. Rufus’s computer vision interprets visual contexts. An image of your water bottle in a gym bag tells Rufus this is a gym product. An image of it in a home office tells it this is a desk product. Diversity of lifestyle contexts — multiple use scenarios across your image stack — expands the range of queries your listing can surface for.
    • Include alt text on A+ Content images. A+ Content images support alt text, and Rufus reads those too. A descriptive alt text like “Woman using 1200-watt blender to make green smoothie in modern kitchen” provides far more contextual data than “product image 3.”

    The Competitive Advantage Window

    Awareness of Rufus’s image-reading capabilities among Amazon sellers remains low. Most listing optimization advice still focuses exclusively on keyword text. The sellers who begin optimizing their image stacks for AI readability now — while the majority of competitors haven’t — will build a structural advantage that compounds over time as Rufus’s role in product discovery continues to grow.

    A/B Testing Your Images: The Data-Driven Loop That Separates Growing Listings From Stagnant Ones

    Amazon Manage Your Experiments A/B test dashboard showing variant B winning with +32% conversion lift, 97% statistical confidence, $320K annual revenue impact

    The difference between an image stack that was optimized once and an image stack that is continuously optimized is enormous — and it’s measurable. The documented case studies on Amazon image A/B testing are some of the most compelling data in the seller ecosystem.

    A single image change on an eight-figure client’s listing produced a 32% conversion increase with no change in traffic. On a $1 million annual revenue baseline, that test generated an estimated $320,000 in additional revenue — from one image change. Tested to 97% statistical confidence over four weeks.

    A separate test of lifestyle versus plain background images across a three-week window produced a consistent 15% conversion lift. An 18% conversion rate increase was documented in another test involving both image and title keyword adjustments.

    These aren’t marketing claims. They’re documented A/B test results from Amazon’s own experiment infrastructure. The methodology is rigorous. The results are real.

    Amazon’s “Manage Your Experiments” Tool

    For brand-registered sellers, Amazon’s native A/B testing tool — Manage Your Experiments — is available through Seller Central. It enables you to test two versions of a main image (or other content elements) against each other simultaneously, splitting traffic between the variants and measuring conversion rate, click-through rate, and projected annual revenue impact.

    The tool handles sample size and statistical significance, giving you a confidence score that indicates how reliable the result is. Tests typically require 4-6 weeks to reach meaningful confidence levels — longer for lower-traffic listings, shorter for high-volume ones.

    The key best practice: test one variable at a time. If you change the main image and the background color and the badge in the same test, and conversions improve, you won’t know which change drove it. Isolating variables makes each test actionable, not just informative.

    What to Test and In What Order

    A rational image testing roadmap prioritizes by potential impact:

    1. Main image angle and composition — highest impact, directly affects CTR from search results. Test your current hero image against a version with tighter crop, different angle, or stronger visual contrast.
    2. Slot 2 infographic versus lifestyle — determines whether the “Why this product?” question is best answered with data or emotion for your specific buyer. Category and product type influence the answer differently.
    3. Lifestyle image subject demographics — test a lifestyle image featuring a buyer who matches your target demographic vs. a more generic model. The specificity uplift can be significant in niche categories.
    4. Infographic design variations — test a text-heavy infographic against an icon-forward one for the same content. Mobile rendering often favors icons.
    5. Slot order permutations — once content is optimized, test whether reordering slots improves flow. Slide the comparison chart from slot 6 to slot 3 and measure the effect.

    The Continuous Testing Mindset

    The most important shift isn’t tactical — it’s cultural. Image testing shouldn’t be a one-time project. High-performing sellers run image experiments every 3-4 weeks, rotating through their image slots systematically. The result isn’t a single 32% uplift; it’s a compounding series of 5-15% improvements that, over 12 months, can double a listing’s conversion rate.

    That’s not hypothetical. It’s what continuous testing looks like at scale.

    Video in the Image Stack: Why It’s No Longer Optional

    Amazon provides a dedicated video slot alongside the image gallery on product detail pages. For most categories, this slot can host a product video in the main image carousel — visible before the listing’s A+ content, before reviews, before anything below the fold.

    Video is no longer a differentiator in 2026. It’s expected. Listings with videos see higher engagement metrics across the board: more time on page, lower bounce rates, and conversion rates that consistently outperform video-absent listings in the same category. The aggregated data on listings using at least six images plus video shows conversion lifts in the range of 20-50% compared to image-only listings.

    What Type of Video Converts

    Not all product videos are equal. The videos that perform best on Amazon share a clear structure that mirrors the psychological image sequence described earlier: problem → product introduction → demonstration → result → call to action.

    Amazon video best practices for 2026:

    • Keep it under 60 seconds. The median attention span for an Amazon product video is under 45 seconds. Videos longer than 90 seconds see significantly higher drop-off rates before the key demonstration moments. Front-load your strongest content.
    • Design for silent viewing. A large portion of mobile shoppers view videos without sound. Captions and on-screen text should convey the full message without audio dependency. Key selling points should appear as text overlays at the moment they’re demonstrated.
    • Show the product being used within the first five seconds. Don’t spend time on brand intros, logo animations, or ambient footage before showing the product in action. Five seconds is approximately when mobile viewers make the swipe-or-stay decision.
    • Film in 9:16 vertical format for mobile priority. Amazon’s mobile carousel renders vertical video more effectively than horizontal. Given that mobile represents over 70% of traffic, vertical formatting should be the primary production orientation.

    Video as an Objection-Handling Tool

    The single most valuable function of a product video on Amazon is objection handling. Text and images can describe a product’s ease of use; video can prove it. Text can claim durability; video can demonstrate a stress test. Text can say “easy to assemble”; video can show the assembly completed in 90 seconds by an ordinary person.

    When you identify the top 3 objections holding buyers back from converting on your listing — look at your reviews and Q&A for clues — and build your video around directly addressing those objections with demonstration, you create a video that sells rather than just showing. The difference in conversion impact is substantial.

    The Mobile-First Image Audit: How to Stress-Test Your Listing Right Now

    Everything discussed in this post converges on a single practical starting point: you cannot optimize what you haven’t audited. Most sellers have never actually evaluated their listings the way their buyers experience them — which is on a 6-inch phone screen, in a search results grid, scrolling fast, often in a noisy environment with split attention.

    Here is a systematic mobile-first image audit you can conduct in under 30 minutes, right now, using only your phone and a competitor’s listing for reference.

    The Five-Point Mobile Audit Checklist

    1. The Scroll Test. Open Amazon on your phone and search one of your primary keywords. Scroll the results at normal speed without stopping. Note whether your listing’s thumbnail catches your eye before you scroll past it. If you have to actively look for your product in the grid, your hero image isn’t earning the click from cold traffic.

    2. The Thumbnail Fill Test. Without clicking on your listing, look at your hero image thumbnail in the search results grid. What percentage of the thumbnail space does the product fill? Compare it to the two or three most visible competitor thumbnails. If your product looks smaller or leaves more empty space, you have a dead pixel problem.

    3. The 3-Second Infographic Test. Click into your listing and swipe to your infographic images. Set a timer for three seconds and look at each one. What’s the one thing you understood from it in that window? If you can’t answer that question — if the image required more than three seconds to extract a single clear message — it’s underperforming for mobile buyers.

    4. The Lifestyle Relatability Test. Look at your lifestyle images with fresh eyes. Does the person in the image look like your target buyer? Is the environment recognizable to that buyer? Is the product being used — not just displayed? If any of those answers is no, that image slot is working below its potential.

    5. The Sequence Logic Test. Swipe through your full image gallery as if you’ve never seen the product before. Does each image answer the next logical question in a buying journey? Or do you find yourself confused about why a particular image appears when it does? Note the specific slot where the sequence feels disjointed — that’s your first optimization priority.

    Competitive Benchmarking: What the Category Leaders Are Doing

    For each of the five tests above, repeat them on the top-selling listing in your category. Document what their hero image composition looks like, what their slot 2 image communicates, how they use lifestyle photography, and what their infographic design choices are. Not to copy — to benchmark.

    Understanding where the category standard sits tells you whether you’re above, at, or below the visual baseline buyers expect when they search your category. Being below the baseline means you’re losing conversions to competition passively, every day. Being above it means your images are a competitive moat.

    In most categories, a thorough audit reveals at least three immediately actionable improvements — dead pixel space to close, infographic text to increase, lifestyle images to retarget — that can be addressed without a new photo shoot. Start there.

    The Compounding Effect of a Fully Optimized Image Stack

    Individual image improvements tend to produce individual results. A hero image fix produces a CTR gain. A better slot 2 infographic reduces early bounces. A more targeted lifestyle image improves Add-to-Cart rates. Each gain is real and valuable. But the full value of image optimization isn’t the sum of individual improvements — it’s the compounding effect of all of them working together.

    A listing with a high-converting hero image earns more clicks. More clicks mean more sessions. Better secondary images mean more of those sessions convert. Higher conversion rates improve your organic ranking algorithm, which improves your search placement, which produces still more organic traffic. Better images reduce return rates, which improves your seller metrics, which feeds back into ranking signals. Positive reviews from buyers whose expectations were set accurately by your images reinforce social proof, which improves conversion for future buyers.

    This is the compounding flywheel — and it starts with images, not ads.

    The True Cost of Unoptimized Images

    Every day a listing runs with a dead pixel problem in the hero image, it’s losing a percentage of the clicks it should have earned. Every day an infographic is rendering as unreadable text on mobile, it’s failing to move buyers past the evaluation stage. Every day a lifestyle image features the wrong demographic, it’s failing to trigger the mental simulation that drives desire.

    These aren’t theoretical losses. They’re real buyers who came close, evaluated, and went elsewhere — not because the product was wrong for them, but because the visual presentation didn’t make the case clearly enough at the moment it mattered.

    The cost of a professional product photography session for a full 9-image stack ranges from a few hundred dollars to $2,000 depending on category and complexity. The revenue impact of a 15-32% conversion improvement on a listing doing $100,000 a year is $15,000-$32,000 annually. That math works at almost any traffic level.

    Actionable Takeaways: Where to Start This Week

    If you take nothing else from this piece, start with these five actions:

    1. Run the mobile scroll test on your primary keyword today. If you can’t find your own listing in the first seconds of scrolling, your hero image needs work before anything else.
    2. Check your hero image’s frame fill. Open your main image in an image editor and measure the product’s footprint. If it’s below 85%, crop and reupload. This is a 20-minute fix with measurable CTR impact.
    3. View every infographic image at 400px wide. Screenshot it, shrink it, and read it. What survives? What becomes illegible? Redesign around what remains readable at that size.
    4. Fill every available image slot. If you’re running fewer than seven images, filling the remaining slots with a properly sequenced set of lifestyle, infographic, and detail images should be your first priority. 6+ images consistently outperform shorter galleries across documented data.
    5. Set up one A/B test this month. Brand-registered sellers have access to Manage Your Experiments for free. Start with a hero image variant — the highest-impact single test available. Give it four weeks and let the data decide.

    The sellers who treat their image stack as a living, continuously tested asset — not a one-time creative project — are the ones who build listings that compound in performance over time. In a marketplace where traffic is expensive, margins are compressed, and competition deepens every quarter, that compounding effect isn’t a nice outcome. In 2026, it’s the difference between a listing that grows and one that slowly loses ground.

    Your images are already either earning money or losing it. Now you know which questions to ask to find out which one.

  • How to win amazon buy box: 2026 Strategies to Boost Sales

    How to win amazon buy box: 2026 Strategies to Boost Sales

    If you're serious about growing your Amazon business, there's one goal that stands above all others: winning the Buy Box. With over 82% of all Amazon sales happening through that single button, it's the most direct path to more sales and better visibility.

    Let’s break down what it really takes to get there. It all boils down to excelling in three key areas: your fulfillment method, your landed price, and your overall seller performance.

    Understanding the Buy Box Algorithm

    Laptop displaying data charts, a notebook, pen, and a 'BUY BOX BASICS' sign on a wooden desk.

    The Amazon Buy Box, which Amazon now calls the "Featured Offer," is the holy grail for sellers. It's that prime real estate on a product page with the “Add to Cart” and “Buy Now” buttons. When a shopper clicks, the seller who currently "owns" the Buy Box gets the sale. Simple as that.

    For products with multiple sellers, Amazon’s algorithm doesn't just hand this spot to one person. It rotates the Buy Box among a select group of sellers who meet its demanding standards.

    Think of the algorithm as Amazon's ultimate customer satisfaction tool. Its only job is to give the buyer the best possible experience, and it constantly sifts through seller data to figure out who is most likely to provide that.

    First Things First: Getting Eligible for the Buy Box

    Before you can even compete for the Buy Box, you have to be invited to the game. Not every seller's offer is even considered. Amazon has a set of baseline requirements to weed out new or underperforming accounts.

    Here’s what you need to have in place:

    • A Professional Seller Account: This is non-negotiable. Individual seller accounts simply aren't eligible. You'll need the Professional plan, which runs $39.99 per month.
    • Sufficient Order Volume: Amazon is a bit cagey about the exact number, but you need a solid sales history. The algorithm needs data to analyze your performance, and a handful of orders just won't cut it.
    • Good Account Health: Your account needs to be in good standing. This means keeping your defect rates low and sticking to Amazon’s long list of policies.

    I've seen brand-new sellers get "Buy Box Eligible" status surprisingly fast by jumping straight into Fulfillment by Amazon (FBA). It’s a great way to build a positive track record right from the start.

    Pro Tip: You can quickly check your Buy Box eligibility for any product right in Seller Central. Just go to your "Manage Inventory" page, find the ASIN in question, and look at the "Buy Box Eligible" column. If you see a "Yes," you're officially in the running.

    The Three Pillars of Winning the Buy Box

    Once you're eligible, the real work begins. Amazon's algorithm zooms in on three main areas to decide who gets that coveted "Add to Cart" button. The exact formula is a closely guarded secret, but years of experience have shown these are the variables that move the needle most.

    Factor What It Means for You Why Amazon Cares
    Fulfillment Method How you get products to your customers. FBA and Seller Fulfilled Prime (SFP) get a massive advantage over standard Fulfillment by Merchant (FBM). Amazon trusts its own logistics network (FBA) to provide the fast, reliable shipping that Prime members expect. It's all about customer trust.
    Landed Price The total price the customer pays. This is your item price plus shipping. The algorithm wants to feature a competitive price. It doesn't always have to be the absolute lowest, but it needs to be in the ballpark.
    Seller Performance Your stats on the Account Health dashboard. Think Order Defect Rate, Late Shipment Rate, and customer feedback score. Strong metrics are proof that you're a reliable seller who follows through. This means fewer headaches and support tickets for Amazon.

    Nailing these three elements is the core of any winning Buy Box strategy. A rock-bottom price can't make up for slow shipping, and even the power of FBA can be undermined by an uncompetitive price. The sellers who consistently win are the ones who find a way to excel across all three pillars.

    Mastering Your Pricing Strategy

    A desk with 'SMART PRICING' text, a calculator, a phone, and blank price tags.

    Let's get one thing straight about winning the Buy Box: a competitive price is table stakes, but it’s absolutely not a race to the bottom. I've seen countless sellers destroy their profit margins by blindly slashing prices, thinking the lowest price automatically wins. It doesn't. The real key is to price smarter, not just lower.

    Amazon's algorithm is sophisticated. It doesn't just see your item price; it sees what the customer actually pays. This is the Landed Price—your item price plus any shipping costs. That's the only number that truly matters in its calculation.

    For example, an FBA seller with a product at $24.99 (with free Prime shipping) will almost always beat an FBM seller offering the same item for $19.99 plus $5.00 shipping. The landed price is identical, but the FBA fulfillment advantage gives the first seller a massive edge. Your pricing strategy has to be completely intertwined with your fulfillment choice and your seller metrics.

    Amazon's algorithm rewards the best overall value, not just the lowest price. A seller with superior performance metrics and FBA fulfillment can often win the Buy Box even when their price is slightly higher than a competitor's.

    Automating Your Pricing with Repricers

    If you're managing more than a few SKUs, trying to adjust prices manually is a losing battle. The market moves too fast. This is where automated repricing tools become non-negotiable. They are your 24/7 pricing analyst, monitoring competitors and adjusting your prices based on rules you set to capture the Buy Box at the highest possible profit.

    You’ll generally encounter two kinds of repricers:

    • Rule-Based Repricers: These are the workhorses. You set up direct "if-then" commands. A classic rule is: "If the Buy Box winner is an FBA seller, price my FBA offer $0.01 below them."
    • Algorithmic Repricers: These are the brains of the operation. They use machine learning to look beyond simple rules, analyzing competitor metrics, time of day, your performance stats, and more to make incredibly nuanced pricing moves.

    Both Amazon's own tool and third-party software can get the job done, but they're built for different stages of a seller's journey.

    Amazon Automate Pricing vs. Third-Party Software

    For anyone just starting out, Amazon's built-in Automate Pricing tool is a solid first step. It’s free with a Professional account and lives right inside Seller Central. You can create basic rules to match the Buy Box, beat it by a set amount, or price above other sellers.

    But as you scale, you’ll quickly hit its ceiling. It’s slower and just doesn't have the sophisticated rule options that specialized software provides.

    Feature Amazon Automate Pricing Third-Party Repricer
    Cost Free with Professional Account Monthly Subscription Fee
    Speed Slower (updates every 5-15 mins) Faster (near real-time updates)
    Rule Complexity Basic (match, beat, stay above) Highly advanced and customizable
    Competitor Analysis Limited to price and fulfillment type Analyzes competitor feedback, stock, etc.

    This is where third-party repricers, like those offered by AlgoFuse.ai's partners, really shine. Their main advantage is speed and intelligence. Reacting to a price change in seconds versus 15 minutes can be the difference between winning hundreds of Buy Box rotations or none at all.

    Configuring Your Repricer for Maximum Profit

    A repricer is only as smart as the rules you give it. The most critical step is setting a minimum and maximum price for every single product. Your minimum price is your absolute floor—your break-even cost plus your minimum acceptable profit. Never, ever set it lower. This is your safety net.

    Let's look at how this plays out in two real-world scenarios:

    1. High-Volume Consumable (e.g., Coffee Pods): Competition is brutal here. An aggressive strategy works best. Your rule might be: "Undercut the lowest FBA offer by $0.01, but never go below my floor price of $18.50. If no FBA offers exist, match the current Buy Box price." The goal is pure volume.

    2. Niche, High-Margin Item (e.g., Specialty Camera Lens): Here, you want to protect your margin, not give it away. A smarter rule would be: "If another FBA seller has the Buy Box, price $0.50 above them. When they sell out, I'll capture the next sale at a higher price. If I win the Buy Box, immediately reprice toward my maximum of $499." This is a profit-maximizing "price-up" strategy.

    By tailoring your rules to the product and the competition, you move beyond simple price-cutting. You start conducting a sophisticated pricing strategy that protects your margins and dramatically boosts your Buy Box win rate.

    Choosing the Right Fulfillment Method

    FBA Advantage warehouse with a white delivery van and stacked cardboard boxes, representing efficient shipping.

    While everyone obsesses over pricing, your fulfillment method is arguably the most powerful weapon in your Buy Box arsenal. How you get products into a customer’s hands sends a direct signal to Amazon’s algorithm about your reliability and speed. The choice between Fulfillment by Amazon (FBA), Seller Fulfilled Prime (SFP), and Fulfillment by Merchant (FBM) isn't just about logistics—it's a core strategic decision that can make or break your Buy Box eligibility.

    This choice is so critical because Amazon’s algorithm is built to protect its Prime promise. Winning the Amazon Buy Box is a huge deal, driving an estimated 82% of all sales on desktop. The data is clear: studies show that FBA sellers win the Buy Box an incredible 75-85% of the time. FBA automatically gives you Prime eligibility and perfect shipping performance, checking two of the algorithm's most important boxes right out of the gate.

    To help you visualize how these methods stack up, here’s a quick comparison of their impact on your Buy Box potential.

    Fulfillment Method Impact on Buy Box Wins

    Fulfillment Method Typical Buy Box Win Rate Key Advantage Primary Challenge
    Fulfillment by Amazon (FBA) Very High (75-85%+) Automatic Prime eligibility and perfect shipping metrics. Inventory costs, loss of control, and potential fees.
    Seller Fulfilled Prime (SFP) High Prime badge while maintaining control over your inventory. Incredibly strict performance metrics and high operational costs.
    Fulfillment by Merchant (FBM) Low to Moderate Full control over inventory, branding, and fulfillment. Competing against the speed and trust of Prime offers.

    As you can see, the path you choose for fulfillment directly correlates with how often you can expect to appear in the Buy Box. Let's break down what each of these really means for your business.

    The Undeniable Power of FBA

    If your main goal is to maximize your Buy Box share, Fulfillment by Amazon (FBA) is the most direct path. You ship your inventory to Amazon's warehouses, and they take over everything else—storage, picking, packing, shipping, customer service, and even returns.

    From the algorithm's point of view, an FBA offer is as good as gold. Amazon trusts its own logistics network implicitly.

    • Automatic Prime Eligibility: Your listings get the coveted Prime badge, making them instantly more attractive to millions of loyal Prime members who filter for it.
    • Perfect Shipping Metrics: With FBA, your shipping performance is flawless because Amazon is managing it. Late Shipment Rate, Valid Tracking Rate—these are no longer your problem.
    • Customer Trust: Shoppers see the Prime badge and know their order will arrive fast. This trust often makes them willing to pay a little more for an FBA item over a slightly cheaper FBM one.

    This trifecta gives FBA sellers a massive, built-in advantage. The algorithm is designed to prioritize the best possible customer experience, and in Amazon's eyes, FBA is the gold standard.

    Seller Fulfilled Prime: The Best of Both Worlds?

    Seller Fulfilled Prime (SFP) presents an interesting middle ground. It allows you to get the Prime badge on your listings while fulfilling orders from your own warehouse. It sounds perfect, but be warned: it comes with incredibly demanding performance standards. Amazon essentially expects you to operate at an FBA level, which is a very high bar.

    To get in and stay in the SFP program, you have to prove you can deliver, day in and day out.

    • Nationwide Two-Day Delivery: You must be able to offer free two-day shipping to Prime members across the country, no exceptions.
    • Weekend Operations: SFP requires weekend shipping and processing to meet those tight delivery windows. The "it's Saturday" excuse doesn't fly.
    • Stellar Performance: Your metrics have to be near-perfect. That means an on-time shipment rate above 99% and a cancellation rate below 0.5%.

    SFP is really for established sellers who already have rock-solid, in-house logistics. If you’re just starting out, this probably isn’t for you.

    The key takeaway here is that Amazon's algorithm treats a qualified SFP offer almost identically to an FBA offer. If you have the operational chops to meet SFP's strict requirements, you can compete directly with FBA sellers for the Buy Box without handing your inventory over.

    Competing as a Fulfillment by Merchant (FBM) Seller

    With Fulfillment by Merchant (FBM), you're in the driver's seat for everything—storage, packing, and shipping. While this gives you total control, it puts you at a clear disadvantage in the Buy Box fight.

    To have a real shot as an FBM seller, you can't just be good; you have to be flawless. The algorithm is constantly comparing your shipping speed, handling time, and performance metrics against the benchmark set by FBA.

    Your FBM playbook has to include:

    • Fast Handling Times: Aim for same-day or, at most, one-day handling. Any delay gives Prime offers a huge head start.
    • Expedited Shipping Options: Don't just offer free economy shipping with a 7-day delivery window. That won't win you any points. You need to provide fast and affordable shipping options.
    • Pristine Metrics: Your Late Shipment Rate, Valid Tracking Rate, and Order Defect Rate must be perfect. Any slip-up, and you’re pushed to the back of the line.

    Winning the Buy Box with FBM is tough, but it’s not impossible. It's most feasible when you have a major price advantage or if you're the only seller on a listing. On highly competitive listings, however, you're fighting a steep uphill battle against the speed and trust that comes with every Prime offer.

    Perfecting Your Seller Performance Metrics

    Ever wonder why your perfectly priced product suddenly lost the Buy Box? More often than not, the answer is hiding in your seller performance metrics. Think of it this way: Amazon’s entire business is built on customer trust. Your metrics are how it gauges whether you’re upholding that trust.

    A great price and fast shipping might get your foot in the door, but a poor performance score will get you shown the exit. If your account health slips, Amazon will pull your offers from the Buy Box, no matter how low you price your items. Maintaining a clean dashboard isn't just a "best practice"—it’s your license to compete.

    Decoding the Order Defect Rate (ODR)

    The metric that Amazon watches like a hawk is the Order Defect Rate (ODR). This single number is a snapshot of your customer service quality over a rolling 60-day period.

    It’s calculated from three core problems:

    • A-to-z Guarantee Claims: This happens when a customer has a serious problem and asks Amazon to step in.
    • Negative Feedback: Any one- or two-star ratings from buyers.
    • Credit Card Chargebacks: A customer disputes a charge directly with their credit card company.

    Your mission is crystal clear: you absolutely must keep your ODR below 1%. If it creeps any higher, you’re not just risking the Buy Box; you’re putting your entire account at risk of suspension.

    The best defense here is a good offense. Don't let a customer issue escalate into a claim. Answer every single buyer message within 24 hours (yes, even on weekends) and be willing to solve problems quickly. Eating the cost of a small refund or a replacement product is a tiny price to pay compared to the sales you'll lose from a high ODR.

    Critical Shipping Performance Metrics

    For anyone fulfilling orders themselves (FBM), your shipping game is under intense scrutiny. The algorithm needs to see that when you promise a delivery date, you actually hit it. If you’re using FBA, Amazon takes care of all this for you, essentially giving you a perfect score right out of the gate. But if you’re an FBM seller, these numbers are all on you.

    Late Shipment Rate (LSR)
    This tracks how many of your orders are confirmed as shipped after the expected ship-by date. Amazon demands that your LSR stay below 4%. The easiest way to manage this is to be realistic with your handling times. If it takes you two days to get an order out the door, don't promise one-day handling. It’s always better to under-promise and over-deliver.

    Pre-fulfillment Cancel Rate (PCR)
    This is the percentage of orders you cancel before you even ship them, which is almost always because you ran out of stock. Your target here is to keep your PCR under 2.5%. A high cancellation rate screams "unreliable" to Amazon, and it's a direct result of sloppy inventory management.

    Valid Tracking Rate (VTR)
    Amazon wants proof of shipment. This metric measures the percentage of your orders that have a legitimate tracking number from a carrier Amazon recognizes. For FBM sellers, your VTR needs to be above 95%. This is non-negotiable. Always use carriers that integrate with Amazon’s system and make sure you upload those tracking numbers correctly and on time.

    Your seller performance metrics are the silent gatekeepers of the Buy Box. A few negative reviews or A-to-z claims can sideline your offers for weeks. To stay competitive, you must maintain an Order Defect Rate under 1%, a Late Shipment Rate below 4%, and a Valid Tracking Rate above 95%. Discover more insights about how these metrics influence your Buy Box share on jordiob.com.

    Using FBA to Outsource Performance Metrics

    Frankly, the easiest way to guarantee perfect scores on your shipping and service metrics is to let Amazon do the work for you with Fulfillment by Amazon (FBA). When you send your inventory to an Amazon warehouse, you're handing off these critical operational tasks to their world-class logistics network.

    Here's exactly what FBA takes off your plate:

    • Shipping Performance: Your Late Shipment Rate and Valid Tracking Rate are no longer your problem. Amazon is a master of logistics, so you automatically get top marks.
    • Customer Service: Amazon’s team handles all customer questions and returns for your FBA orders, dramatically cutting your risk of negative feedback related to shipping or delivery.
    • Feedback Removal: If a customer leaves you negative feedback for an FBA order that's entirely about fulfillment (like "the box was crushed"), Amazon will often strike through the feedback so it doesn't impact your ODR.

    For new sellers, FBA is a fantastic way to build a positive reputation while you're still learning the platform. For seasoned pros, it’s a strategic move to ensure your most important products have flawless metrics, giving you the best possible shot at owning the Buy Box.

    You can have the best price in the world and perfect seller metrics, but if you run out of stock, you’re invisible. It’s that simple. On Amazon, you can’t win the Buy Box if you have nothing to sell.

    This is a brutal, non-negotiable truth of the platform. Amazon’s algorithm is built to give customers what they want, right now. A stockout is a massive red flag, telling Amazon you can't be relied on to meet that demand. It doesn't just lose you a sale; it kills your momentum and can even hurt your product's search ranking long after you’ve restocked.

    The True Cost of a Stockout

    When your inventory hits zero, you instantly lose Buy Box eligibility. Gone. If other sellers are on the listing, the algorithm just moves on to the next best option without skipping a beat. If you're the only seller, the Buy Box might get suppressed entirely, forcing a shopper to click through extra steps just to see if or when your product will be back. Most won't bother.

    This sudden stop in sales velocity does lasting damage. It signals to Amazon that customer interest has dropped, which can send your product sliding down the search results page. Getting that momentum back is an uphill battle, making a preventable stockout a very expensive mistake.

    A stockout is a direct hit to your Buy Box momentum. The moment your inventory hits zero, you are completely removed from consideration. Reclaiming your spot after restocking isn't guaranteed and requires you to rebuild your sales velocity against competitors who remained available.

    Forecasting Demand and Managing Reorder Points

    The only way to avoid this is to get proactive with your inventory. Stop reacting to low-stock alerts and start building a system that anticipates your needs. This means forecasting your demand and setting clear reorder points.

    Getting a Handle on Your Sales Velocity
    First, dig into your historical sales data. Look at your sales over the last 30, 60, and 90 days to spot trends. But don't forget to factor in seasonality—it's a real thing. A best-selling Christmas ornament is dead weight in March, and a pool float isn't going to move much in November. Your forecast has to account for these predictable peaks and valleys.

    Setting Smart Reorder Points
    Your reorder point is the inventory level that tells you, "It's time to order more stock now." The formula is simple, but it’s one of the most powerful tools in your arsenal:

    Reorder Point = (Average Daily Sales x Lead Time in Days) + Safety Stock

    Let’s break that down with a real-world example:

    • Lead Time: This isn't just shipping time. It's the entire process from the moment you place an order with your supplier until those units are checked in and ready for sale at an FBA warehouse. You have to be brutally realistic and include production, freight, customs, and Amazon's own receiving time.
    • Safety Stock: Think of this as your buffer for when things go wrong—and they will. A supplier delay, a customs hold, or a sudden spike in sales can wipe you out. A good rule of thumb is to keep a safety stock equal to 30% of your lead time demand.

    So, if you sell an average of 10 units a day and your total lead time is 45 days, your calculation would be: (10 units x 45 days) + (135 units for safety stock) = 585 units. The second your inventory hits 585, you place your next order. No hesitation.

    Why Delivery Speed Is Non-Negotiable

    Having products in stock is step one. How fast you can get them to the customer is just as critical in the Buy Box battle. Amazon has invested billions to train us all to expect fast, free shipping, and its algorithm rewards sellers who deliver on that promise.

    This is precisely why FBA and Seller Fulfilled Prime (SFP) offers have such a baked-in advantage. Their speed and reliability are a given.

    If you’re a Fulfilled by Merchant (FBM) seller, this is where you have to shine. Speed is your primary weapon. Here’s how you can compete:

    • Set Handling Time to 1 Day or Less: The clock starts ticking the second an order comes in. You absolutely must aim to ship orders the same day. Anything over a 24-hour handling time is a major handicap.
    • Offer Expedited Shipping Options: Don’t just offer a slow, free shipping option. Give customers the choice to upgrade to two-day or even next-day delivery. Even if few people choose it, just having the option available sends a positive signal to the algorithm.
    • Use Regional Shipping Templates: Get smart with your shipping settings in Seller Central. You can create templates that offer faster and cheaper shipping to customers who live closer to your warehouse. This is a brilliant way to win the Buy Box in specific geographic areas where you can actually deliver faster than a national FBA offer.

    At the end of the day, your inventory and shipping aren't just backend logistics. They are core, customer-facing parts of your Buy Box strategy. By consistently keeping products in stock and delivering them quickly, you prove to Amazon that you provide the exact experience it wants for its customers.

    Your Buy Box Monitoring and Troubleshooting Routine

    Here’s a hard truth about selling on Amazon: winning the Buy Box isn't a "set it and forget it" achievement. It's a constant battle. The landscape can shift overnight, and a strategy that worked yesterday might be obsolete today. To protect your sales, you need a daily routine for monitoring your status and quickly troubleshooting any problems that knock you out of that top spot.

    Don't wait for your sales to nosedive before you start digging for answers. The first thing you should do every single morning is check your Buy Box win percentage in Seller Central. You can find this key metric under the "Pricing" tab on your Pricing Dashboard. Think of it as your early warning system. If that number suddenly dips, it’s a red flag telling you it's time to investigate.

    Diagnosing a Sudden Buy Box Drop

    When you see that win percentage drop, the key is not to panic—it's to diagnose. You have to put on your detective hat and run through a mental checklist of the usual suspects. Nine times out of ten, the answer is in one of these areas.

    Here’s the troubleshooting flow I run through whenever this happens:

    • New Competition: Is there a new seller on the listing? This is the most common culprit, especially if they are using FBA or have come in at a much lower price point. A new player can change the entire dynamic in an instant.
    • Price Wars: Did a competitor just undercut you? Or, maybe your own repricer made a move you didn't anticipate. Check the pricing history for that ASIN to see who changed what and when.
    • Performance Slips: Head straight to your Account Health dashboard. Did your Order Defect Rate (ODR) creep above 1%? Have a few recent shipments pushed up your Late Shipment Rate (LSR)? Even a small dip in your seller metrics can make you less appealing to Amazon's algorithm.
    • Inventory Check: This one sounds almost too simple, but it happens all the time. Are you actually in stock? A stockout is an automatic disqualification from the Buy Box.

    By methodically checking these four things, you can stop guessing and pinpoint the real reason you lost your position. This is far more effective than just blindly dropping your price.

    The Hidden Power of Your Listing Visuals

    While your price and seller metrics are the heavy hitters, there’s another factor that many sellers completely overlook: the quality of your product listing's visuals. Great images, well-designed infographics, and compelling A+ Content do more than just make your page look professional; they have a direct and measurable impact on your conversion rate.

    A higher conversion rate means more sales from the same amount of traffic. This creates a powerful feedback loop. To Amazon's algorithm, high sales velocity is a huge signal that customers prefer your offer. If you and a competitor are perfectly matched on price, fulfillment, and metrics, the seller with the higher sales volume will almost always get a bigger piece of the Buy Box pie.

    In short, great visuals act as a tie-breaker.

    This decision tree gives you a simplified view of the path to winning the Buy Box, focusing on the absolute non-negotiables: stock availability and shipping speed.

    Flowchart illustrating paths to win the buy box, considering stock, shipping speed, and potential loss.

    As the chart shows, if you don't have the product ready to ship quickly, you're not even in the game.

    Let’s say you’re selling a premium kitchen gadget. A competitor enters the listing, matching your price and also using FBA. On paper, you're equals. But your listing has an infographic comparing your model's features to others, plus a lifestyle video showing it in action. Those visuals help customers make a purchase decision faster, which boosts your conversion rate and overall sales. That extra velocity gives you the edge the algorithm is looking for.

    Remember, the Buy Box algorithm is ultimately designed to create the best possible experience for the customer. A listing that converts better is, by definition, giving customers what they want. Investing in top-notch visuals is a direct investment in your sales velocity and, by extension, your Buy Box dominance.

    This daily routine—monitoring, diagnosing, and constantly optimizing everything from your metrics to your images—is what separates the pros from the amateurs. It gives you the power to react quickly to threats and proactively defend the most valuable piece of real estate on Amazon.


    Are your listing images hurting your conversion rate and holding you back from winning the Buy Box? With AlgoFuse.ai, you can generate a complete set of data-driven, high-converting listing visuals in minutes. Stop guessing and start creating images that sell. Get your first listing for free at AlgoFuse.ai.

  • Unlocking Sales with Amazon Product Optimization

    Unlocking Sales with Amazon Product Optimization

    If you're still treating your Amazon listings like a one-and-done task, you're already falling behind. The old playbook of setting up a product page and hoping for the best simply doesn't work anymore. Amazon product optimization is an ongoing, active process. You have to treat your product page like a living asset, constantly fine-tuning it to win over both shoppers and Amazon's A10 algorithm.

    The New Rules of Amazon Product Optimization

    Forget everything you thought you knew about simply stuffing keywords into your listing. Success on Amazon in 2026 is a whole new ballgame, and the A10 algorithm has rewritten the rules. The focus has shifted dramatically toward customer experience and genuine organic performance. Your job is no longer just to be found—it’s to convert, satisfy, and earn trust.

    This modern approach to Amazon product optimization rests on a few core pillars that successful sellers have mastered. It's about thinking holistically about the entire customer journey on your page.

    Key Pillars of Modern Amazon Optimization

    To really grasp this shift, it helps to break down the essential components. These are the areas where you need to be focusing your energy right now to stay competitive and get the algorithm on your side.

    Optimization Pillar Primary Goal Key Action
    Deep Keyword Mastery Attract highly qualified, ready-to-buy traffic. Dig for long-tail phrases and customer questions, not just broad, generic terms.
    Compelling Visuals Answer questions and build desire before they read. Create a full suite of images, infographics, and videos that show, not just tell.
    Strategic A+ Content Tell a brand story and stand out from competitors. Use rich media to build trust, explain benefits, and justify your price point.
    Reputation Management Build social proof and customer confidence. Proactively manage reviews and answer Q&A to show you're an engaged, reliable brand.

    Ultimately, these pillars all support one core principle that I've seen play out time and time again.

    The core principle is simple: a listing that excels at converting visitors into happy customers will be rewarded with higher rankings. The A10 algorithm prioritizes listings that demonstrate authority and generate consistent sales velocity.

    This is a huge evolution. Back in the day, the A9 algorithm was all about PPC and basic keyword relevance. Now, in 2026, the A10 algorithm cares far more about customer authority, organic sales, and even external traffic from sources like social media and blogs. It rewards brands that build a real audience.

    The payoff for getting this right is massive. For example, well-executed A+ Content is shown to deliver up to a +20% conversion boost, which is absolutely critical when over 50% of purchases happen on mobile. Brands that dominate the Buy Box consistently capture up to 70-80% of all sales in their categories. Top agency reports on Amazon marketing for 2026 show just how brands are adapting to this new reality.

    This guide will walk you through the actionable checklist you need to compete. We'll cover everything from deep keyword research and backend settings to creating stunning AI-powered visuals. To get a head start, see how AI can transform your product photography in our guide on creating high-converting Amazon listing images.

    Building Your Foundation with Keywords and Backend Fields

    Laptop displaying 'Keyword Foundation' software on screen, with a plant and notebook on a wooden desk.

    Before you even think about writing a catchy title or compelling bullet points, the real work of Amazon product optimization has to happen behind the scenes. This is all about building a solid keyword foundation and properly setting up your backend fields. Get this right, and you’re essentially giving Amazon's A10 algorithm a crystal-clear roadmap to who your product is for, making sure you show up in front of the right shoppers.

    I see so many sellers focus only on the big, obvious keywords—the "short-tail" terms like "yoga mat." And sure, they have a place. But the money is in the "long-tail" keywords. These are the super-specific, multi-word phrases like "extra thick non slip yoga mat for hot yoga." A shopper searching for that knows exactly what they want, and that intent translates directly to higher click-through rates and a much better return on your ad spend.

    Uncovering High-Intent Keywords

    The first step is a mental shift. You have to stop thinking about what you call your product and start thinking about the problems your customers are trying to solve. Modern keyword research is really part detective work, part data crunching.

    A great place to start is the Amazon search bar itself. Just begin typing your main product term and watch what Amazon's auto-suggest pops up. These are real searches from real customers, and they're often a goldmine of long-tail keyword ideas.

    From there, it's time to dig deeper.

    • Spy on Your Competitors: Pull up the top 10 listings for your primary keyword. Don't just skim them—analyze their titles, bullets, and especially their customer Q&A sections. What words do they use over and over? What questions do shoppers keep asking? These reveal pain points you can target.
    • Run Reverse ASIN Lookups: Grab the ASINs of your top three competitors and plug them into a dedicated SEO tool. A reverse ASIN search will spit out a list of the exact keywords they're ranking for, both organically and with ads. It's like getting a copy of their playbook.
    • Mine for Gold in Reviews: Go read the 3-star reviews on competing products. Why 3-star? Because they are often the most balanced, highlighting what's good but also what's missing. These "I wish it had…" comments are pure keyword gold.

    This whole process will give you a powerful list of keywords that goes way beyond the basics. You'll find phrases that tap into specific needs and help you connect with shoppers your competition is completely ignoring.

    Optimizing Your Backend Search Term Fields

    With your master keyword list in hand, you can start putting it to work. Your most valuable keywords will go in your title and bullets, but the backend fields are your secret weapon. This is where you can tell Amazon about all the other relevant terms without making your public-facing copy sound like a robot wrote it.

    The backend search term field is one of the most powerful—and most overlooked—tools you have. It's your private line to the A10 algorithm, letting you index for synonyms, common misspellings, and related concepts that just don't fit naturally into your main listing.

    Think of it as your strategic keyword overflow. You have a strict character limit, so you need a plan. Here's a quick checklist to do it right:

    • Search Terms (Generic Keywords): This is the main event. Fill this field with your secondary and long-tail keywords. Use all lowercase, separate words with a single space, and don't repeat anything that's already in your title, bullets, or other backend attributes. No commas, no semicolons—just a space-separated string of words.
    • Subject Matter: This helps Amazon's algorithm categorize your product more precisely. Add 3-5 relevant phrases that describe the product's use case or topic. For example, "outdoor patio furniture" or "mindfulness meditation guide."
    • Other Attributes: Don't skip these! Fields like "Target Audience" (e.g., "professional chefs," "beginner gardeners") and "Intended Use" are becoming more important for filtered search and voice search through Amazon's AI, Rufus. The more specific you are, the better.

    When you fill out these backend fields correctly, you’re giving Amazon a ton of valuable data. This helps you show up in more filtered searches and for a much wider range of customer queries, setting the stage for a truly optimized and profitable product.

    Crafting High-Conversion Titles, Bullets, and Descriptions

    A professional flat lay of a modern workspace with a tablet, pen, document, and 'High-Conversion COPY' text.

    Alright, you’ve done the crucial behind-the-scenes work. Your backend keywords are dialed in, building a solid SEO foundation for your product. Now comes the part where we turn that technical groundwork into persuasive copy that connects with real shoppers. This is where Amazon product optimization gets its personality.

    Your title, bullet points, and description are your front-line sales team. They have to grab a customer's attention in a sea of search results and guide them from a casual glance to a confident purchase. Think of it as a mini sales funnel on a single page: the title hooks them, the bullets answer their immediate questions, and the description seals the deal. If one part is weak, the whole system falters, and you leave sales on the table.

    Your Title: The Ultimate Click Magnet

    I tell every seller I work with: your product title is the single most valuable piece of real estate you have on Amazon. It’s the first thing anyone sees in the search results, and it has to do two jobs at once—satisfy the A10 algorithm and entice a human to click. A title overstuffed with keywords might get you seen, but a readable, benefit-rich title is what actually earns the click.

    The trick is finding that sweet spot. You want to front-load your most important keyword phrase and the product's core identity while ensuring it all makes sense. A formula I've seen work time and time again is:

    [Brand Name] [Primary Keyword Phrase] – [Key Feature or Benefit], [Size/Color/Quantity]

    For instance, a title like "EcoPure Water Filter Pitcher – Removes Lead and Chlorine for Better Tasting Water, 10 Cup Capacity, White" is worlds better than "Water Filter Pitcher Filter Water." It immediately tells the shopper the brand, what it does, why that matters, its size, and color. It answers five questions before they've even clicked.

    Amazon gives you a technical limit of around 200 characters, but don't feel you need to use all of it. In my experience, the first 60-80 characters are what count, especially on mobile. That's your prime real estate.

    Turning Features into Benefit-Driven Bullets

    This is where I see so many listings fall flat. Sellers just list out dry, technical specs in their five bullet points. Here's the thing: customers don't buy features; they buy the solutions and outcomes those features provide. Your job is to be a translator.

    So instead of just stating a feature like "Made with 304 Stainless Steel," you reframe it as a direct benefit: "BUILT TO LAST A LIFETIME: Crafted from rust-proof 304 stainless steel, so you never have to worry about replacing a flimsy or broken part again." See the difference? You’ve just sold them durability and peace of mind, not just a grade of metal.

    I like to structure bullets to tell a story and preemptively tackle customer concerns:

    • Bullet 1: Start with the main problem your product solves. Hook them immediately.
    • Bullet 2: Show off your unique solution or what makes your product different.
    • Bullet 3: Paint a picture of a specific use case or a positive experience.
    • Bullet 4: Build trust by talking about quality, materials, a warranty, or your brand's commitment.
    • Bullet 5: End on a strong note, maybe with a call-to-action or by reinforcing the core value.

    This approach walks a customer through their own decision-making process, building their confidence with every point.

    Remember, your bullet points aren't just a list; they are a conversation with your customer. Each one should anticipate and answer a question, moving them closer to clicking "Add to Cart."

    The Product Description: Your Final Pitch

    Even if you have access to A+ Content, your standard text description still gets indexed by Amazon and matters for SEO. And for sellers who aren't brand registered, this space is your last, best chance to make your case. Too often, it’s just a dreaded wall of text.

    The fix is surprisingly simple: use a little basic HTML to make it scannable. A few simple tags can completely change the reading experience. You can use <br> for line breaks and <b> to bold key phrases, guiding the reader’s eye.

    A simple structure that consistently performs well:

    • Start with a bold headline that repeats the main benefit.
    • Follow with a short, engaging paragraph that expands on the problem you're solving.
    • Use a mix of short sentences and paragraphs to explain features and benefits.
    • Bold important callouts like "Easy to Clean" or "Perfect for Gifting" to break up the text.
    • Wrap up with a final statement about your brand and exactly what's included in the box.

    This simple formatting transforms a dense block of text into an easy-to-scan sales pitch, ensuring your final message gets heard loud and clear.

    Mastering Visuals with AI-Powered Product Imagery

    A computer displaying product images, a camera on a tripod, and a cardboard box for AI product image creation.

    After you've dialed in your copy, your images have to do the real work. On Amazon, your product photos aren't just there to look pretty—they're your number one sales tool. They are often the first, and most powerful, impression a shopper gets. A top-notch visual strategy is no longer optional for Amazon product optimization; it's what stops the scroll, answers questions at a glance, and builds the trust needed to make a sale.

    Think of your image stack as a visual conversation with your customer. It begins with that perfect main image, your digital handshake, and then unfolds to tell a complete story through a series of carefully chosen shots.

    The Anatomy of a High-Impact Image Stack

    A truly effective image set does more than just show off your product. It gets ahead of every question, doubt, or curiosity a customer might have. A winning gallery is a mix of different image types, each with a specific job to do.

    • The Main Image: This is your hero shot, plain and simple. It needs to be on a pure white background, filling 85% of the frame, and make it instantly obvious what your product is. Its only goal is to be so clear and compelling that it earns the click from a sea of competitors on the search results page.
    • Lifestyle Photos: These shots put your product in a real-world setting, helping customers picture it in their own lives. A portable blender shown on a kitchen counter during a hectic morning routine tells a much richer story than a picture of the blender floating in a white void.
    • Infographics and Feature Callouts: Here's your chance to break down key benefits and specs into something scannable and easy to understand. Use them to highlight dimensions, materials, or unique features your copy mentions, reinforcing the product's value and justifying its price.
    • Comparison Charts: How does your product measure up against others? A simple chart can instantly show off your unique selling points, either against a competitor or other models in your own lineup. This helps shoppers make a quick, confident decision.

    For years, putting together this full suite of images was a major headache for sellers. It meant shelling out for expensive photoshoots, hiring graphic designers, and dealing with long turnaround times. It was a huge barrier to effective Amazon product optimization.

    High-quality product images are no longer just a "nice-to-have"—they are the core of your listing's performance. Listings featuring a full suite of 7 or more optimized images consistently see 20-40% higher engagement, directly fueling the sales velocity that the A10 algorithm rewards.

    The numbers don't lie. In-depth research on scaling an Amazon business has found that professional visuals can increase conversion rates by as much as 30% when everything else is dialed in. The problem has always been the price tag and the hassle. Freelancers can charge thousands of dollars for a single listing, an impossible expense for many sellers. Luckily, AI has completely flipped the script.

    The AI Workflow for Agency-Quality Visuals

    AI-driven platforms like AlgoFuse.ai have leveled the playing field, giving every seller the ability to generate a complete, high-converting image stack in just a few minutes. This workflow gets around the old-school bottlenecks of cost, time, and needing a designer on speed dial.

    The process itself is surprisingly simple. Instead of spending hours trying to write the perfect AI prompt or a detailed design brief, you just provide a few key inputs, like your product's ASIN or main keywords.

    The platform then does the heavy lifting, automating the entire creative process:

    1. First, it scans top-performing competitors for your keywords across all 19 Amazon marketplaces to see what visual styles are resonating with customers right now.
    2. Next, it automatically applies current best practices, making sure your main image is compliant and all your secondary images are designed for maximum impact.
    3. Finally, it generates a full suite of visuals, including lifestyle scenes, detailed infographics, and comparison charts, all based on your product’s specific features and benefits.

    This AI-powered approach delivers an entire agency-quality image package with a single click. It allows you to test, tweak, and even localize your visuals for international markets at a speed that was unimaginable just a few years ago.

    Manual Image Creation vs AI-Powered AlgoFuse.ai

    To really understand how big of a shift this is, it helps to see a direct comparison between the traditional method and the new AI-powered workflow. The table below breaks down the key differences in cost, time, and effort.

    Metric Manual Process (Freelancer/Agency) AI-Powered Process (AlgoFuse.ai)
    Cost Per Listing $500 – $3,000+ ~$15 (up to 95% less)
    Turnaround Time 1 – 4 weeks ~5 minutes
    Revisions Slow, often with additional costs Instant, with minimal token usage
    Expertise Needed Requires design briefs and direction None—fully automated best practices
    Scalability Limited by freelancer/agency capacity Unlimited—generate for entire catalog
    Localization Requires separate projects per market Built-in for global marketplaces

    As you can see, this isn't just a small step forward; it's a fundamental change in how sellers can manage their visual merchandising. Being able to create stunning, data-backed images on demand gives everyone a fighting chance—from brand-new sellers working on a tight budget to large aggregators who need to optimize hundreds of listings at once. This is the future of visual Amazon product optimization.

    Alright, you've nailed down your keywords, your copy is sharp, and your images are ready to go. Now it's time for the masterclass—the final layers that turn a good listing into one that truly dominates its category.

    This is where we move beyond the basics and get into strategic Amazon product optimization. We're talking about A+ Content, smart pricing, and building a rock-solid reputation with reviews. Think of these as the closers. Your title and images got them in the door, and the bullet points answered their first few questions. These next pieces are what will get them to confidently click "Add to Cart."

    Go Beyond Bullets with Strategic A+ Content

    A+ Content is your brand's dedicated space on the product page. It's your chance to tell a story, tackle any lingering doubts, and show off what makes your product special in a rich, visual way. When done right, it's a serious conversion driver—we've seen it boost sales by as much as 20% in some categories.

    The trick is to use the modules with purpose, not just as decoration.

    • Tell Your Brand Story First: Kick things off with a full-width banner that explains who you are. Are you a small family-run business? An innovator obsessed with sustainable materials? This is your chance to connect with the shopper on a human level.
    • Show, Don't Just Tell: Instead of more text, use comparison charts. They're fantastic for showing how your product stacks up against an older version or even the competition. You can also use a series of lifestyle images with text overlays to walk customers through the key benefits, making it much more digestible than a block of text.
    • Handle Objections Before They Happen: Is your product priced higher than others? Use a module to break down the premium materials or superior tech that justifies the cost. Worried people might think setup is complicated? Create a simple, step-by-step visual guide.

    I've seen so many sellers treat A+ Content like an afterthought, just throwing in a few extra images. That's a huge missed opportunity. It's your single best tool for building brand trust right on the page. Use it to answer the big question: "Why should I choose you?"

    For a long time, creating compelling A+ Content meant hiring a designer. Thankfully, that's changed. Modern tools have put professional-grade branding within reach for everyone. For instance, AI platforms like AlgoFuse.ai can generate stunning A+ modules in minutes, turning your product info into layouts that are designed to sell.

    Win the Buy Box with Smart Pricing

    Pricing on Amazon can feel like walking a tightrope. Go too high, and you'll lose the Buy Box. Go too low, and you're just giving away your profits. The real goal is finding that competitive sweet spot that drives sales and protects your margins.

    First thing's first: do your homework. Look at the top 5-10 competitors for your main keyword. Don't just glance at the price—dig deeper. How many reviews do they have? Are they FBA or FBM? Do they have great A+ Content? A well-established product with 5,000 reviews can easily command a higher price than a brand-new one.

    • Know Your Numbers: Before you set a price, you have to know your all-in costs. That means your cost of goods, inbound shipping, Amazon referral fees, FBA fees, and your ad spend.
    • Use a Repricer: Manually trying to keep up with competitor prices is a recipe for disaster. You can use Amazon's built-in Automate Pricing tool or a third-party repricer to set rules. This keeps you competitive without getting dragged into a race to the bottom.

    Build Unshakable Trust with Reviews and Q&A

    On Amazon, social proof isn't just important—it's everything. A listing with hundreds of positive reviews will almost always beat one with just a handful, even if the products are identical. This is why having a proactive strategy for getting reviews is a non-negotiable part of Amazon product optimization.

    The easiest and safest way to do this is by using the "Request a Review" button in Seller Central after a sale. Amazon sends a standardized, fully compliant email asking the customer for both a product review and seller feedback. It's simple, but it works.

    Don't sleep on your Q&A section, either. It’s a goldmine. Check it daily. When a potential customer asks a question, be the first to jump in with a clear, helpful answer. Not only does this help that one person, but it also signals to every future visitor that you're an active, responsive brand they can trust.

    Getting your listing live isn't the end of the job—it's just the beginning. The real work, the kind that builds a sustainable brand on Amazon, is in the constant tweaking and testing that comes next. A listing that just sits there is a listing that's slowly getting buried. This commitment to continuous Amazon product optimization is what I’ve seen separate the seven-figure sellers from those who just tread water.

    Think of it as a monthly rhythm. You have to regularly get your hands dirty in the data to see what’s actually happening on the ground. The idea is to find those small, smart changes that add up to major gains over time.

    Your Monthly Optimization Checklist

    First, pull up your Amazon Search Term reports. Are shoppers finding you with the keywords you thought they would? More often than not, you'll uncover some surprising new phrases that are driving real traffic. This report is a goldmine because it’s not theory; it’s the exact language your customers are using.

    Next, look at your unit session percentage rate—your conversion rate, plain and simple. If you’re pulling in tons of clicks but not enough sales, that’s a red flag. Something on your page is stopping people from clicking "Add to Cart." Maybe your price is off, your images aren’t compelling, or a new competitor just launched with a killer offer. A sudden dip in conversions is your cue to investigate.

    And speaking of competitors, you need to be watching them. What did they just change? Did they roll out new A+ Content? Tweak their main image? Drop their price by a dollar? These aren't just random changes; they're clues you can use to sharpen your own strategy.

    I tell my clients to treat this monthly review like a pilot’s pre-flight check. You wouldn't take off without making sure every instrument is working perfectly. Your Amazon listing is your business's engine—it needs the same level of attention.

    This routine is what lets you stop guessing and start making informed moves. You’ll know when it's time to test a new main image, rewrite a bullet point to address a common question, or shift your ad budget to a keyword that’s suddenly converting like crazy. If you need to whip up some new images for testing, you can generate a few options in minutes with a trial of AlgoFuse.ai.

    Taking Your Brand Global: Expansion and Localization

    Once you have a solid optimization process humming along in your primary market, it’s tempting to look at international expansion. But I’ve seen too many brands fail by simply copy-pasting their US listing into the UK or German marketplace. That approach just doesn't work.

    Going global means you have to go local. And that's about so much more than just a direct translation.

    • Localize Your Keywords: Don't just translate your best keywords. You have to do the research to find out what customers in Germany, Japan, or the UK are actually searching for. The language and slang are always different.
    • Adapt Your Imagery: That sunny California lifestyle photo might fall flat in a European market. Show local models and use backdrops that feel familiar and relevant to that specific audience.
    • Adjust Your Copy: Your clever American idioms won't make sense overseas. Rewrite your copy to connect with the unique culture and buying habits of each new market.

    This is a non-negotiable step for a successful international launch. The data shows that brands who commit to this level of localization see huge performance boosts. Using Premium A+ modules, for instance, can increase conversions by up to 20%. That's a massive advantage, especially as Amazon's search AI increasingly prioritizes listings with rich, detailed content.

    This diagram really breaks down the core pieces of your listing that you need to be constantly monitoring and refining.

    Diagram showing the Listing Dominance Process Flow, highlighting Brand Story, Price, and Reviews.

    From your Brand Story to your Pricing and Reviews, each part works together. Keeping them all in sync and constantly improving them is the key to dominating your category.

    Frequently Asked Questions About Amazon Optimization

    Even the most thorough checklist can leave you with a few lingering questions when you get into the nitty-gritty of Amazon product optimization. I've seen these same questions pop up time and again, so let's clear them up based on real-world experience.

    How Often Should I Update My Listing?

    This is a question I get all the time, and the honest answer is: it depends. But one thing is for sure—a "set it and forget it" mindset is a surefire way to get left behind.

    As a baseline, plan to do a deep dive into your listing and your top competitors at least once a month. This means you're actively looking at your keyword performance, conversion rates, and what changes your rivals are making to their images, copy, and pricing.

    That said, don't wait a month if you see a problem. If sales suddenly tank or a new competitor starts stealing your thunder, you need to react immediately. True optimization isn't just a scheduled check-in; it's a constant process of reacting to the market.

    What Is the Most Important Thing to Optimize for a New Product?

    When you're launching a new product, it's all about one thing: getting found. You can have the best product in the world, but if shoppers can't find it, you have zero chance of making a sale.

    From day one, your entire focus should be on discoverability. For me, that boils down to three non-negotiables:

    • A Killer Main Image: This is your billboard in a crowded search results page. It has to be sharp, clear, and compelling enough to stop a scrolling thumb and earn that click.
    • A Keyword-Rich Title: Your title is your most powerful SEO weapon. Front-load your most critical keyword phrase so both Amazon's A9 algorithm and shoppers know exactly what your product is at a glance.
    • Comprehensive Backend Keywords: This is your secret advantage. Fill out every character of your backend search terms with all the relevant synonyms, use cases, and long-tail keywords you've researched.

    Reviews are absolutely essential for long-term success, but you can't get reviews without getting seen first. The launch phase is a sprint to master search visibility and get that initial traffic flowing.

    How Do I Measure the Impact of My Optimization Changes?

    If you don't track your changes, you're just guessing. The biggest mistake I see sellers make is changing everything at once—new title, new bullets, new images—and then having no idea what actually worked (or didn't).

    Instead, test one element at a time. For instance, roll out a new title and let it run for two weeks. Keep a close eye on your click-through rate (CTR) and session count in your business reports. Did they go up?

    Once that test is done, update your bullet points and then monitor your unit session percentage (your conversion rate) for the next two weeks. The key metrics to live by are:

    • Sessions: Are more eyeballs landing on your page?
    • Click-Through Rate (CTR): Is your main image and title doing its job in search?
    • Unit Session Percentage: Are your images and copy convincing shoppers to click "Add to Cart"?

    This deliberate, one-change-at-a-time approach lets you pinpoint exactly what moves the needle. As you get comfortable tracking this, you can learn more about advanced keyword strategies in our in-depth guide to Amazon SEO.


    Ready to create stunning visuals that convert browsers into buyers? With AlgoFuse.ai, you can generate an entire agency-quality image stack—from infographics to A+ Content—in just five minutes. Get started for free and create your first listing today.

  • Your Guide to an AI Product Image Generator for Amazon Listings

    Your Guide to an AI Product Image Generator for Amazon Listings

    At its core, an AI product image generator is your on-demand creative studio. It’s a specialized tool that uses artificial intelligence to spin up a full suite of professional, high-converting product photos from just one or two simple pictures of your item. For anyone selling on Amazon, this means you can get all your lifestyle shots, infographics, and main images done in minutes, without ever hiring a photographer or graphic designer.

    Why Visuals Are Your Most Powerful Sales Tool on Amazon

    On Amazon, your product images do the heavy lifting. They’re your silent salesperson. When a shopper lands on your page, they can’t hold your product or see it in action. All they have are your pictures. This is where so many sellers stumble—they treat their images like a chore to be checked off, not as the single most important factor driving their sales.

    Let’s be blunt: generic, uninspired images don't just blend in; they actively repel customers. They scream "amateur," raise doubts about your product's quality, and send shoppers straight to your competitor’s more polished listing. This directly tanks your click-through rate, your session time, and, ultimately, your sales velocity and BSR.

    The Staggering Cost of Traditional Photography

    Think about the old way of getting this done. A traditional product photoshoot is a long, expensive headache. It usually looks something like this:

    • First, you have to find and hire a freelance photographer or an agency.
    • Then, you’re shipping your valuable inventory out for the shoot.
    • Next comes all the back-and-forth to coordinate models, props, and locations.
    • You wait days, sometimes weeks, to get the final edited photos back.
    • Finally, the invoice arrives, often for thousands of dollars for just a handful of images.

    The whole process is slow, rigid, and incredibly expensive. Want to create a few images for a Christmas promotion or test a different lifestyle angle? You have to fire up that entire costly cycle all over again. For sellers with more than a few SKUs or those looking to expand internationally, this model just doesn't scale.

    To put it in perspective, let's compare the two approaches side-by-side.

    Traditional vs AI-Powered Image Generation: A Quick Comparison

    The table below breaks down the core differences in cost, time, and output quality between the old-school route and using an AI platform for your Amazon listing images.

    Metric Traditional Method (Freelancer/Agency) AI Product Image Generator (e.g., AlgoFuse.ai)
    Cost $1,000 – $5,000+ per photoshoot $29 – $99 per month for unlimited generations
    Turnaround Time 1-4 weeks 2-5 minutes
    Image Variety Limited to the original shoot concepts Infinite variations and concepts on demand
    Scalability Low; each new product requires a new shoot High; easily generate images for entire catalogs
    Flexibility Low; revisions are costly and time-consuming High; instantly test new scenes, models, and styles

    As you can see, the shift isn't just about incremental improvement; it's a fundamental change in how you can approach your visual marketing.

    The Rise of AI in Ecommerce Visuals

    This is exactly why the AI image generator market is booming. The industry is projected to jump from USD 412.51 million in 2025 to an incredible USD 1,747.63 million by 2034. That explosive growth is driven by the non-stop demand for better visuals in ecommerce, particularly on a competitive battlefield like Amazon. With a dominant 40.34% market share, North America is leading this charge. You can dig into the full report on this market's rapid expansion for more details.

    An AI product image generator completely upends the traditional model. Instead of dropping thousands on a single shoot, you get the power to create infinite visual concepts whenever you want, for a tiny fraction of the cost.

    This isn't just about saving a buck, though. Modern tools like AlgoFuse.ai give you a serious strategic edge because they're built with market intelligence at their core. By analyzing what's working for top-selling products across 19 different Amazon marketplaces, these platforms can generate visuals that are already dialed in for conversion. The AI knows what kinds of infographics, lifestyle scenes, and feature callouts are grabbing customers' attention in your niche right now.

    This data-first approach takes all the guesswork out of the equation. You get agency-quality visuals that are engineered to sell from the get-go. You’re no longer just making pretty pictures; you’re deploying a targeted visual strategy designed to capture attention and build trust instantly.

    Creating High-Converting Amazon Images From a Single Photo

    This is where the real magic happens. Forget the weeks of back-and-forth with photographers and the thousands of dollars spent on photoshoots. You can take one simple, clean product photo and turn it into a complete set of seven conversion-ready Amazon images.

    The whole approach is built for speed and, more importantly, for what actually works on Amazon right now. You don't need to be a prompt engineer or a graphic designer. The AI handles the creative work by first analyzing what’s already winning in your market.

    It All Starts With One Good Photo

    Everything hinges on your source image, but getting it right is surprisingly straightforward. You don't need a professional studio shot; a high-resolution photo from a modern smartphone will do the job perfectly.

    The goal is just to give the AI a clean, unobstructed view of your product. For the best results, keep these tips in mind:

    • Stick to a plain, neutral background. A simple white or light gray backdrop makes it easy for the AI to isolate your product perfectly.
    • Get the lighting right. You want even, consistent light. Try to avoid harsh shadows or bright glares that might hide product details. Natural light from a nearby window is usually your best bet.
    • Capture a clear, head-on angle. Think of this as your main "hero" shot. It should show the product clearly and accurately.

    This single image is the only raw material you need. It becomes a "digital twin" that the AI will place into dozens of different scenes, infographics, and lifestyle shots. A solid input photo is the foundation for sharp, professional, and convincing final images.

    Let Market Intelligence Guide the Way

    Once your photo is ready, this is where a platform like AlgoFuse.ai really changes the game. Instead of asking you to dream up creative prompts from scratch, it starts with hard data. All you do is enter your main target keyword or the ASIN of a top competitor.

    This simple action kicks off a real-time analysis of the top-performing listings for that exact keyword on Amazon. The AI immediately gets to work identifying which types of images are currently driving the most clicks and sales.

    This is the core advantage, and it can't be overstated. The AI isn't just generating pretty pictures at random. It’s reverse-engineering the visual strategies of the most successful sellers in your niche, giving you a proven blueprint to follow.

    The system studies everything—the camera angles, the benefits highlighted in infographics, the demographics of models in lifestyle photos, and even how comparison charts are structured. It then synthesizes all these best practices to build a custom image strategy just for your product.

    Generating Your Full 7-Image Stack in Minutes

    After the market analysis is done, the AI generates a complete set of seven essential Amazon images all at once. The whole process usually takes about five minutes.

    Here’s a look at the kind of image set you can expect and why each one is so critical for driving sales:

    • The Main Image: A perfect hero shot on a pure white background, ready to go and fully compliant with Amazon's rules.
    • Two Lifestyle Images: These place your product in realistic, aspirational settings that help your target customer imagine it in their own life. You get a couple of different contexts to show off its versatility.
    • A Benefit-Focused Infographic: This one gets straight to the point, calling out 3-5 key benefits with clean icons and short text. It instantly answers the customer’s biggest question: "What's in it for me?"
    • A Feature Callout Image: This image zooms in on specific technical features, materials, or dimensions. It’s all about building trust and showcasing quality.
    • A Comparison Chart: A powerful tool that positions your product against a generic competitor, making it obvious why yours is the better choice.
    • A Final "In-Use" or Brand Shot: This last image often reinforces the brand story or shows the positive outcome of using your product, leaving a lasting impression.

    This visual shows just how much this modern AI workflow simplifies the journey from a single photo to a full-fledged Amazon listing.

    Flowchart comparing traditional image generation process with AI image generation workflow, from capture to usage.

    The takeaway here is the incredible compression of time and resources. What once took weeks of coordination and a whole creative team is now an automated task that’s over in minutes. You get a complete, market-tested set of visuals without writing a single prompt or hiring outside help. This one-click generation is the new playbook for launching and optimizing products at a speed that was impossible just a few years ago.

    Refining Your AI-Generated Images for Maximum Impact

    Getting your first set of AI images is a great start, but the real magic happens next. Don't think of those initial outputs as the finished product. Instead, see them as a solid foundation you can build on. The best part is that you can refine, tweak, and perfect these visuals without ever leaving the platform.

    This is where an ai product image generator evolves from a simple generator into an interactive creative suite. The top-tier tools come with built-in AI editing features, letting you make surprisingly specific changes with just a few words.

    A person uses a stylus on a tablet displaying a photo gallery of various landscape images, on a wooden desk.

    Fine-Tuning Images with AI Editing

    Let's say one of your new lifestyle shots is almost perfect, but the background feels a little flat. Instead of regenerating a whole new batch, you can just edit what you have.

    For example, imagine your product is a portable blender, and the AI placed it on a generic kitchen counter. That's fine, but it doesn't scream "on-the-go." You can simply command the AI to "change the background to a hiking trail at sunrise." In moments, the tool swaps out the entire scene, intelligently keeping your product as the perfectly lit hero.

    This kind of prompt-based editing is a massive time-saver. You can use it for all sorts of things:

    • Change the setting: Swap a plain living room for a high-end modern office or a relaxing beach scene.
    • Add or alter props: Place a steaming mug next to your coffee maker or add a smartphone beside your new tech gadget to show scale.
    • Update infographic text: Quickly change "Durable Design" to a more compelling "Built to Last a Lifetime."

    It’s these quick, targeted adjustments that turn a good image into a great one that nails your specific marketing angle.

    Generating Variations for A/B Testing

    Here’s where things get really interesting. Because creating a completely new image concept is so fast and affordable, you can finally stop guessing and start A/B testing your visual strategy.

    The ability to instantly create and test different visual hypotheses is a huge advantage. You're no longer debating what your audience might want to see; you're using real data to optimize for conversions.

    Let's say you're selling a premium desk chair. You could generate two completely different lifestyle images to see which performs better:

    1. The "Professional" Angle: An image of the chair in a sleek, minimalist home office to attract remote workers and executives.
    2. The "Gamer" Angle: The same chair but in a high-tech gaming rig with RGB lighting, targeting the massive gaming community.

    By running both images in your listing (or in your ad campaigns), you’ll get clear data on which one drives more clicks and sales. This iterative process takes the expensive guesswork out of building your brand's visual identity. Platforms like AlgoFuse.ai make it easy to start creating and testing your own image variations.

    This rapid evolution is part of a huge shift in e-commerce. The AI image generator market, valued at USD 3.16 billion in 2025, is on track to hit a staggering USD 30.02 billion by 2033. This incredible growth is fueled by sellers who now have 24/7 access to agency-quality visuals, helping them slash costs and boost conversions. To see how this boom is impacting sellers worldwide, you can explore more insights on the AI image market's growth.

    Localizing Your Product Images for Global Amazon Sales

    Taking your brand global on Amazon is a massive opportunity, but I’ve seen countless sellers stumble right out of the gate with a simple, yet costly, mistake. They just copy their US-based product images and paste them into their listings for Amazon.de, Amazon.co.jp, or Amazon.com.au. This is a surefire way to scream "foreign seller" to local shoppers, instantly killing trust and your conversion rate.

    What resonates with a customer in Ohio can feel completely alien to a buyer in Osaka. That classic family barbecue scene that works wonders in Australia? It might just look odd and out of place in Germany. To truly succeed worldwide, you need to go beyond just translating text—you have to localize your visuals. This is where a good ai product image generator becomes one of your most valuable assets for international growth.

    A triptych showing an outdoor restaurant, a table setting with 'LOCALIZE VISUALS' text, and a pagoda building.

    Why One-Size-Fits-All Images Don't Work

    Cultural context is everything. A generic lifestyle photo with North American models in a sprawling suburban home just won't connect with a shopper in Tokyo who lives in a smaller, more modern apartment. It creates a subtle but powerful disconnect, making your product feel like it wasn't made for them.

    This is a huge blind spot I see all the time. Sellers pour money into logistics and professional translations but then treat their most powerful sales tool—their images—as an afterthought. The result is predictable: lower conversion rates, fewer clicks, and a painfully slow start in a promising new market.

    Don’t let your visuals betray your global ambitions. A localized image tells a shopper, "We made this for you and your lifestyle," which is one of the most powerful messages you can send in e-commerce.

    Crafting Culturally Authentic Scenes with AI

    Instead of dealing with the logistical nightmare and high cost of photoshoots in every single country, you can use a quality ai product image generator to spin up authentic, localized scenes in just a few minutes. The trick is using a platform that’s actually built for this kind of detailed, specific generation.

    Let's say you're selling a premium coffee grinder. Here’s how you could adapt your imagery for three totally different markets:

    • For Amazon.com (USA): You might generate a shot of the grinder on a big granite countertop in a spacious, open-concept kitchen, maybe with a family milling about in the background.
    • For Amazon.it (Italy): The scene could shift to a cozy, sun-drenched kitchen, with the grinder sitting next to a classic stovetop Moka pot on a rustic wooden table.
    • For Amazon.co.jp (Japan): Here, you'd want to place the grinder in a compact, minimalist kitchen, focusing on clean lines, organization, and a feeling of calm efficiency.

    Each image is selling the exact same product, but they’re speaking a completely different visual language—one that feels familiar, authentic, and aspirational to the local shopper. That's how you build an instant connection and show you've done your homework.

    Tapping into Marketplace Data for Smarter Localization

    The really powerful AI platforms, like AlgoFuse.ai, take this a step further by basically doing the cultural research for you. Instead of guessing what a typical German kitchen looks like, the AI can analyze the top-performing competitor listings directly on Amazon.de.

    This completely changes the game for sellers. The workflow is incredibly straightforward:

    • You pick the marketplace you're targeting, like Amazon UK.
    • You enter your main product keyword.
    • The AI scans the current best-sellers in that country for that keyword.
    • It then generates a complete set of listing images, including lifestyle shots, that mirror the models, environments, and overall aesthetic that is already proven to convert with British shoppers.

    This process removes all the cultural guesswork. Your visual strategy is now grounded in real-time market data, not stereotypes. You're not just making a "British-looking" scene; you're creating a scene that aligns with the visual trends dominating your niche on that exact Amazon storefront. This is how you build trust and drive sales from day one, no matter where in the world you decide to sell.

    Understanding Pricing and Calculating Your Return on Investment

    Whenever you consider a new tool, the first question is always, "What's this going to cost me?" With an AI product image generator, the pricing can feel a bit different. Most platforms, AlgoFuse.ai included, run on a token or credit system instead of a simple per-image fee.

    At first, that might seem abstract, but it’s actually built to give you more control over your budget. You’re not paying a flat rate for every single image. Instead, you use a certain number of tokens for specific tasks. This means you can match your spending directly to your needs, whether you're creating an entire image stack from scratch or just making a few minor edits. It’s a far cry from the rigid, all-or-nothing project fees you get from a photography studio.

    Breaking Down the Token Costs

    So, what does this look like in the real world? Let’s use AlgoFuse.ai as an example. The token cost is tied directly to how much work the AI has to do. A simple task uses fewer tokens, while a more complex one will use more. It’s that straightforward.

    Here's a quick look at the costs you can expect:

    • Full 7-Image Listing: Generating a complete set of seven images—your main shot, lifestyle photos, infographics, and even a comparison chart—all from just one photo costs 90 tokens.
    • Premium A+ Content Module: Need a beautiful banner or a custom module for your A+ Content? That’ll run you 60 tokens.
    • Simple Image Edit: Just want to swap out a background or change some text? That’s a quick fix and only costs 5 tokens.

    This structure ensures you’re only paying for what you actually use. A full visual overhaul for a new product has a predictable, manageable cost, while tweaking a listing for a holiday promotion becomes almost trivially inexpensive.

    Calculating Your Immediate ROI

    This is where the numbers really start to make sense. A traditional product photoshoot can easily set you back $2,000 to $5,000 and take weeks of planning and execution. With an AI platform, you can get a more comprehensive and market-tested set of visuals in minutes, often for less than the cost of a dinner out. The savings are immediate, often cutting your creative costs by up to 95%.

    By moving from expensive, one-off photoshoots to a low-cost subscription, you’re turning a major capital expense into a small, predictable operational cost. This frees you up to test, iterate, and refresh your listings whenever you want, not just when the budget allows.

    This isn't a niche trend; it's a massive market shift. Analysts are painting a very aggressive picture of where this technology is headed. For instance, MarkNtel Advisors projects the AI image generator market will skyrocket from USD 9.10 billion in 2024 to USD 63.29 billion by 2030. That’s a compound annual growth rate of 38.16%. This explosion is being driven by the relentless growth of e-commerce and the need for high-volume sellers to work more efficiently.

    Strategies for Maximizing Your Token Value

    You can stretch your investment even further if you're smart about it. When you’re evaluating plans, look for features designed to give you maximum value over time.

    For example, some higher-tier plans offer token rollover, which lets your unused tokens from one month carry over to the next. This is a fantastic feature for sellers whose creative needs come in waves. You won't have to worry about losing the value you've already paid for during a slow month.

    Most importantly, you should never have to buy a tool blind. A good platform will let you test it out first. We give new users free starter credits on AlgoFuse.ai—enough to generate a complete 7-image listing for a product. This gives you a chance to see the quality for yourself and get a feel for the workflow before you ever pull out your credit card.

    If you have questions about how plans or billing works, it's always smart to have a look at the fine print. You can check out the company's refund and subscription terms right on their site. That kind of transparency is exactly what you should look for when making an investment in your brand’s future.

    Common Questions About AI Product Image Generators

    Whenever I talk to sellers about using AI for their product photos, the same few questions always pop up. It’s new territory, so a healthy dose of skepticism is natural. Let’s get straight to it and address the most common concerns I hear from Amazon sellers diving into these tools.

    Can AI Really Replace a Professional Product Photographer?

    For the bread-and-butter images you need on an Amazon listing, the answer is yes, it absolutely can. While you might still hire a photographer for a huge, artistic brand campaign, an ai product image generator is built for the specific, conversion-focused images that actually drive sales on the marketplace.

    Think about the standard image stack for a successful listing. An AI can knock these out in minutes, not weeks:

    • Lifestyle shots that show your product in a real-world setting.
    • Infographics that clearly highlight key benefits with clean text and icons.
    • Comparison charts that stack your product up against the competition.

    These are the workhorse images that do the heavy lifting for your conversion rate. Getting them done with a traditional photographer is often slow and costly. The AI automates this, giving you a full set of assets that are perfectly tailored for the Amazon environment with incredible speed.

    Do I Need Design Skills to Use These Tools?

    Not at all. This is probably the biggest misconception holding sellers back. The best platforms are built for entrepreneurs and marketers, not professional graphic designers. The entire process is designed to be intuitive from the get-go.

    You won’t be wrestling with complex software or trying to become an expert prompt engineer. The most effective systems are guided by real market data. You just give it a single photo of your product, and the AI handles the composition, lighting, and graphic design elements based on what’s already proven to sell in your niche.

    The whole point of these tools is to eliminate the technical headaches of great design. If you can upload a photo and type a simple phrase, you have everything it takes to create a complete, high-converting image set.

    What Kind of Photo Do I Need to Start With?

    Simple is best. You don’t need a fancy, professionally lit studio shot. In fact, a single, clean photo of your product against a plain white or neutral background works perfectly. This gives the AI a clear, unobstructed "map" of your product's shape, texture, and details.

    Honestly, a high-resolution photo from a modern smartphone is usually more than enough. When you provide a clean "digital twin" of your product, you give the AI the best possible foundation to work from. It can then accurately place that item into countless different scenes and graphics. Don't overthink it—a clear shot is all you need to get started.

    How Does the AI Know What Images Convert Well on Amazon?

    This is the real magic that separates a generic image tool from one built specifically for e-commerce. Advanced platforms like AlgoFuse.ai aren't just creating pretty pictures; they're performing real-time market analysis to inform every image they generate.

    Here's a look under the hood:

    1. You start by giving it your main keyword or the ASIN of a direct competitor.
    2. The AI instantly goes to work, scanning the top-performing listings for that exact keyword in your marketplace.
    3. It then identifies the visual patterns, layouts, and benefit callouts that are winning clicks and sales right now.

    This data-first approach is what makes the results so effective. The AI isn't just guessing what might look good. It's applying the proven visual strategies of your most successful competitors directly to your own product, giving you a massive shortcut to a listing that converts.


    Ready to stop guessing and start generating visuals that are engineered to sell? Try AlgoFuse.ai today and create your first complete, data-driven Amazon image set for free. https://www.algofuse.ai