Tag: Amazon Video Ads

  • Search-Term-First SBV Targeting: Mining Your SP Data for Amazon Video Ad Wins

    Search-Term-First SBV Targeting: Mining Your SP Data for Amazon Video Ad Wins

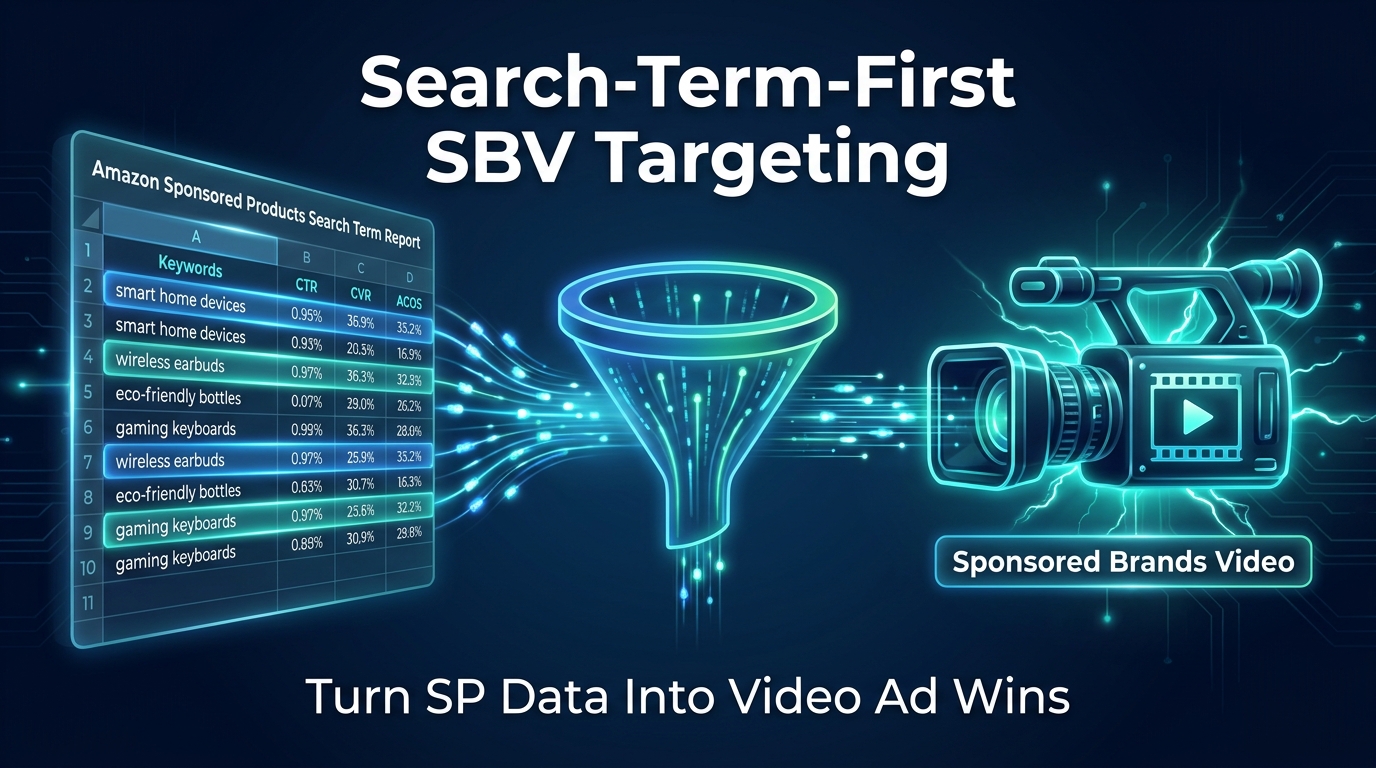
    Search-Term-First SBV Targeting — Turn SP Data Into Amazon Video Ad Wins

    Most Amazon advertisers approach Sponsored Brands Video the wrong way. They start with the creative — picking a product, shooting a video, and then going into the campaign builder to think about keywords as an afterthought. The result is a beautifully produced video ad chasing keywords that have never proven they can convert, burning budget against intent signals it hasn’t earned the right to target yet.

    The smarter path runs in the opposite direction. You start with the data you already have — specifically, the search term report sitting inside your Sponsored Products campaigns right now — and you use it to identify exactly which customer queries have demonstrated the ability to drive purchases before you spend a dollar on video. Then, and only then, do you build your SBV campaigns around those proven terms.

    This is what search-term-first SBV targeting actually means. It is not a creative-led strategy with keywords bolted on at the end. It is a data-led strategy where every video placement you run is anchored to a query that has already passed a conversion test in a lower-cost environment. The creative serves the term. The bid serves the term. The campaign structure serves the term.

    As of 2026, Sponsored Brands Video accounts for roughly 58% of total Sponsored Brands spend across managed Amazon advertising accounts — making it the default format rather than a specialty option. The opportunity is real. But so is the waste for advertisers who haven’t built a systematic way to decide which search terms deserve a video impression in the first place. This post builds that system from the ground up.

    Why SBV Has Earned Its Place at the Top of the Funnel
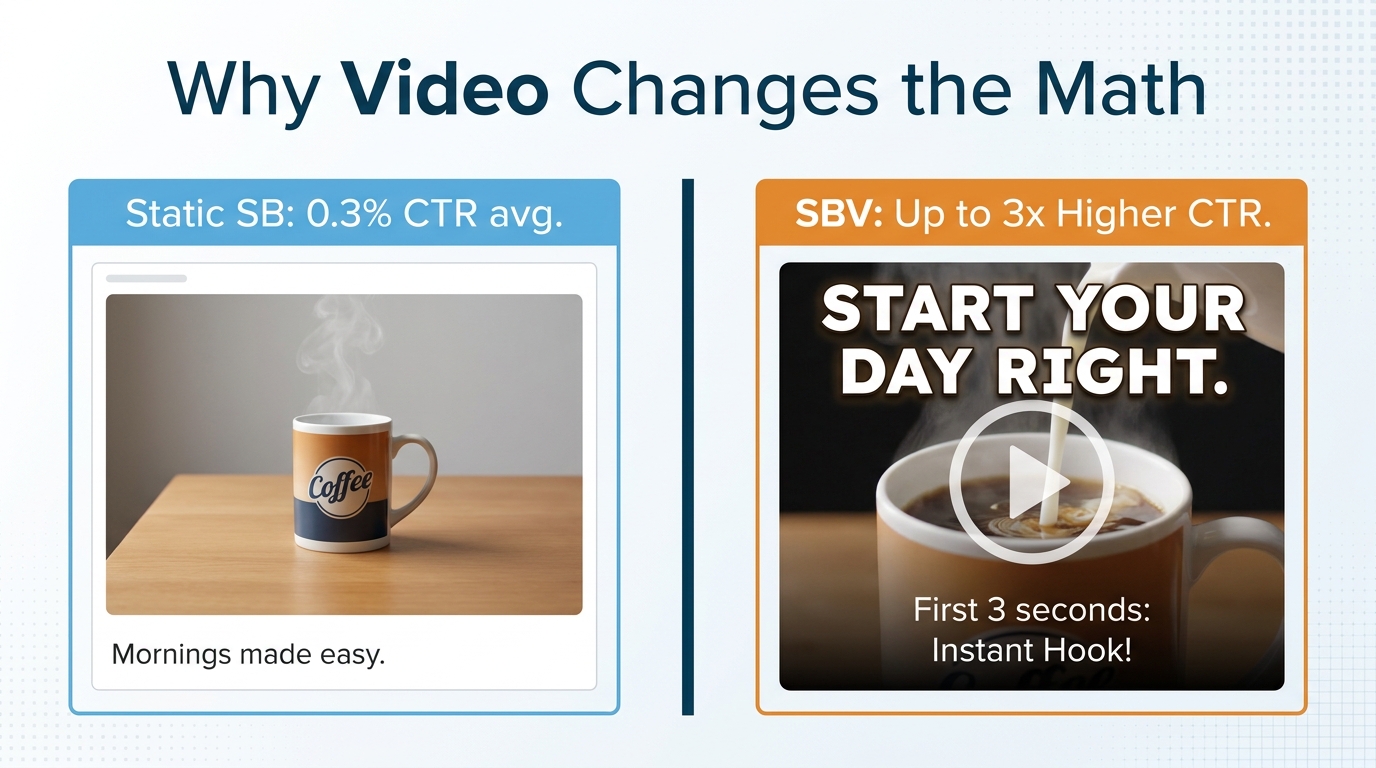
    Static Sponsored Brands versus Sponsored Brands Video CTR comparison — SBV delivers up to 3x higher click-through rates

    Before getting into the mechanics of mining SP data, it’s worth being precise about what makes SBV different enough to warrant its own keyword strategy — because the answer is more specific than “video performs better than images.”

    The Placement Is the Differentiator

    Sponsored Brands Video occupies a distinct placement that static Sponsored Brands ads and Sponsored Products ads cannot. It appears as an autoplay video strip within the organic search results — not above them, not beside them, but embedded directly inside the page that shoppers are actively reading. That placement creates a fundamentally different interaction dynamic.

    A shopper browsing search results for “stainless steel insulated water bottle” is in a comparison state of mind. They are evaluating products side by side. A static banner above those results asks them to stop and look upward. An SBV placement asks for nothing — it begins playing in their peripheral view as they scroll, and it either earns attention through motion and clarity or it doesn’t. This is why SBV’s click-through rate advantage over static Sponsored Brands is consistently reported in the 1.5x to 3x range.

    An Amazon Science study spanning 15 countries found CTR lifts of 17x for SBV versus static image formats in controlled conditions. Real-world account data is more moderate — most practitioners report 1.5x to 2.5x lift in their actual campaigns — but even the conservative end of that range changes the CPC economics significantly. More clicks at the same CPC means more conversion opportunities, which is why SBV’s conversion rate also runs roughly 10% to 30% above equivalent static Sponsored Brands campaigns for the same terms.

    The Format Rewards Intent, Not Just Awareness

    One of the common misconceptions about video advertising is that it belongs at the awareness stage of the funnel — that it is inherently a brand-building tool rather than a performance tool. SBV demolishes that framing. Because it is keyword-targeted and appears within search results, it reaches shoppers who have already expressed intent through their query. The video format doesn’t move them away from purchase consideration — it accelerates it by delivering richer product information in the moment of search.

    This is the core insight that makes search-term-first SBV targeting so powerful: when you put a video behind a high-intent keyword, you are not trading performance for brand — you are stacking both in the same impression. The term captures the intent. The video converts it.

    SBV Is Now the Default, Not the Exception

    The 58% share-of-Sponsored-Brands-spend figure cited above reflects a structural shift that has been building since 2024. Amazon has progressively made SBV easier to launch — simplifying the creative specifications, lowering the technical bar for video production, and expanding the placement to more device types. In competitive categories like home goods, supplements, pet supplies, and personal care, SBV placements now appear on almost every major search page, which means not running SBV is effectively ceding premium in-search real estate to competitors who are.

    The strategic question is no longer whether to run SBV. It’s which terms to run it on, and how to decide. That answer lives inside your SP data.

    The SP Search Term Report as a Targeting Intelligence Engine
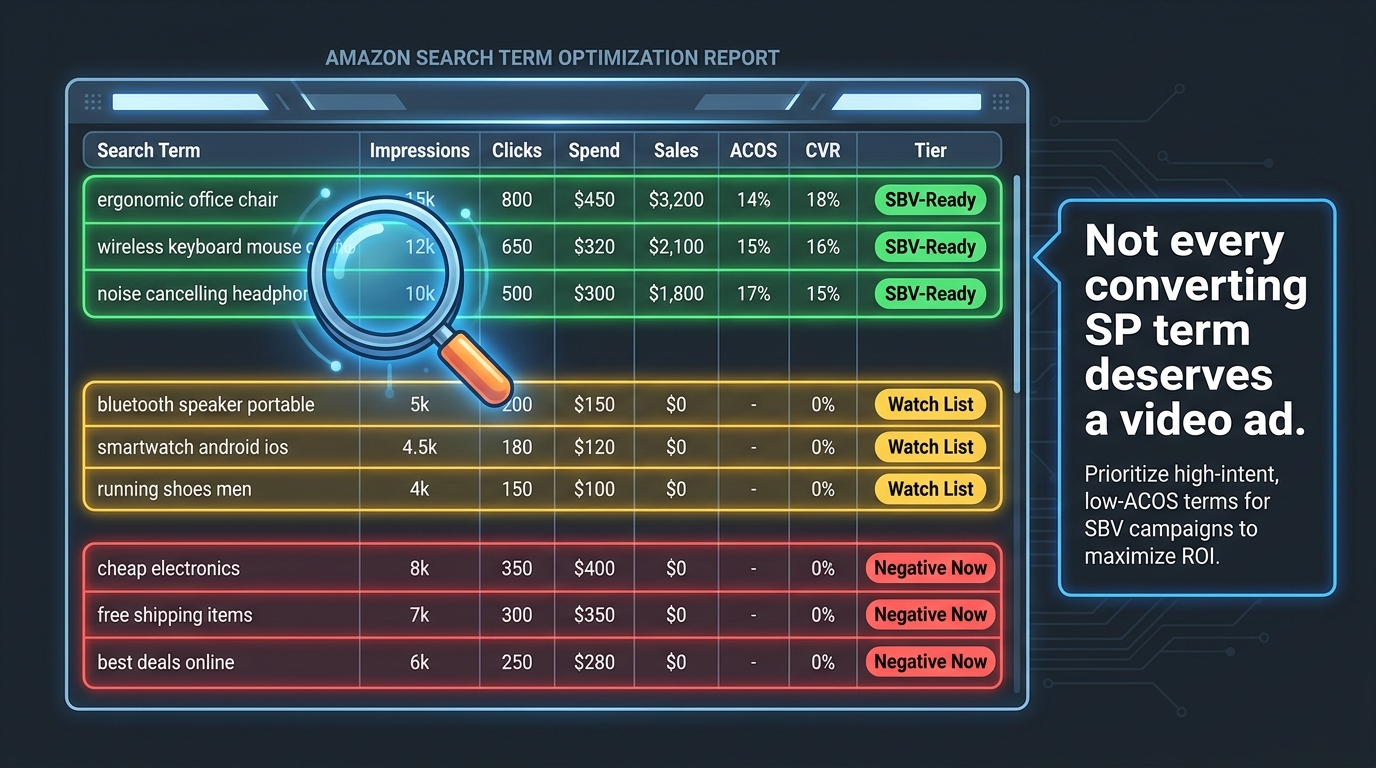
    Amazon search term report with color-coded qualification tiers — SBV-Ready, Watch List, and Negative Now

    Your Sponsored Products campaigns are, functionally, a keyword testing lab. Every day they are running broad match, phrase match, and auto-targeting, they are collecting data on which exact customer queries led to clicks, which of those clicks led to purchases, and at what cost. This data is captured in the search term report, and it represents something genuinely valuable: real shopper behavior, not projected behavior.

    What the Report Actually Contains

    The Amazon Ads search term report shows the actual queries customers typed before clicking your SP ads. For each query, you can see impressions, clicks, click-through rate, spend, attributed orders, attributed sales revenue, and cost-per-click. Critically, you can also see the keyword that matched the query — meaning you can distinguish between a query that your broad match keyword triggered versus one your phrase match keyword triggered, which has implications for confidence in the data.

    Amazon retains up to 65 days of search term data accessible in the native reporting interface, and the Ads Console UI allows export for the past 90 days. For SBV keyword seeding purposes, a 30 to 60-day window is the most actionable — long enough to have statistically meaningful data, recent enough to reflect current demand patterns and seasonal relevance.

    The Data Hierarchy That Matters for SBV

    Not all columns in the search term report are equally important when you are mining for SBV candidates. The metrics that matter most, in order of priority:

    • Orders attributed: This is the bedrock qualifier. A query that has never produced an order has not proven purchase intent, regardless of its click volume. For SBV, where CPCs tend to run higher than SP, only proven converters justify the investment.
    • ACoS (Advertising Cost of Sale): Calculated as spend divided by attributed sales. A term that converts but at an ACoS far above your target is a conversion signal with poor efficiency — it may still qualify for SBV if you believe the creative improvement will reduce CPC, but it needs a tighter bid structure.
    • Click-through rate relative to impressions: High impressions with low CTR can indicate poor listing-page relevance or competitive listing quality. A term with excellent CVR but middling CTR is actually a strong SBV candidate — because better creative (video versus static) is exactly what can close the gap.
    • Conversion rate (CVR): Orders divided by clicks. This is the most reliable signal of query-to-purchase alignment. Terms with CVR significantly above your account average are priority SBV candidates because they demonstrate that shoppers who arrive via that query are predisposed to buy.

    Downloading and Preparing the Report

    To access the data, navigate to Amazon Ads Console → Reports → Create Report → Sponsored Products → Search Term. Set the date range to the past 30 to 60 days, select all available metrics, and export to CSV. From there, the analysis process is the same whether you work in Excel, Google Sheets, or a dedicated PPC tool — filter, sort, and score terms against the qualification criteria detailed in the next section.

    One important note: the report shows customer search terms at the campaign level. If your SP campaigns are not already segmented by product category or match type, your data may be difficult to interpret because high-performing terms from different product categories or intent stages will be mixed together. If your SP campaign architecture is messy, cleaning it up first will make your SBV keyword mining significantly more accurate.

    Setting the Right Filters — What Actually Qualifies a Term for SBV Promotion

    The most common mistake when mining SP data for SBV is using too low a bar. A term that converted twice in 30 days at a borderline ACoS is not an SBV keyword — it’s a keyword that needs more data in SP before it earns a more expensive placement. Being selective at this stage is not cautious; it’s what keeps your SBV campaigns from becoming a vehicle for testing on expensive impressions.

    The Three-Gate Qualification Framework

    Apply these gates sequentially. A term must pass all three to qualify for SBV promotion:

    Gate 1 — Minimum Conversion Activity: The term must have generated at least 3 to 5 orders in the reporting window. Below this threshold, conversion data is too noisy to act on. Some practitioners use a higher threshold of 5 to 10 orders for high-competition categories where CPCs are elevated. The specific number matters less than having a minimum that filters out statistical noise.

    Gate 2 — Acceptable Efficiency: The term’s ACoS must be at or below 150% of your target ACoS. So if your target ACoS is 20%, terms up to 30% ACoS can qualify with the assumption that SBV’s creative improvement may reduce CPC and improve CVR enough to bring it into range. Terms above this threshold need remediation in SP first — fixing bids, improving listing conversion rate, or both — before they deserve a video placement.

    Gate 3 — Volume Adequacy: The term must have generated at least 100 to 200 impressions in the reporting window. Terms with very low impression counts, even if they converted, do not have enough volume to sustain an SBV campaign. SBV CPCs are typically higher than SP CPCs, and low-impression terms often have thin search volume that will not deliver meaningful scale.

    Secondary Scoring for Prioritization

    After applying the three gates, you will typically have a list of qualified terms that is longer than your initial SBV budget can support. Prioritize by scoring each term on a combination of:

    • CVR premium: How much does this term’s conversion rate exceed your SP account average? Higher premium = higher priority.
    • Revenue per click: Attributed sales divided by total clicks. Higher revenue per click terms produce more value per SBV impression regardless of CPC.
    • Competitive sensitivity: Is this a generic category term, a branded competitor term, or your own brand term? Each category has a different priority logic for SBV (covered in more detail in the campaign architecture section below).

    The output of this scoring process is a tiered list: your top-priority SBV exact match candidates, your second-tier phrase match candidates, and a watch list of terms that are close to qualifying but need another 30 days of SP data before promotion.

    Campaign Architecture — Building SBV Campaigns Around Harvested Terms
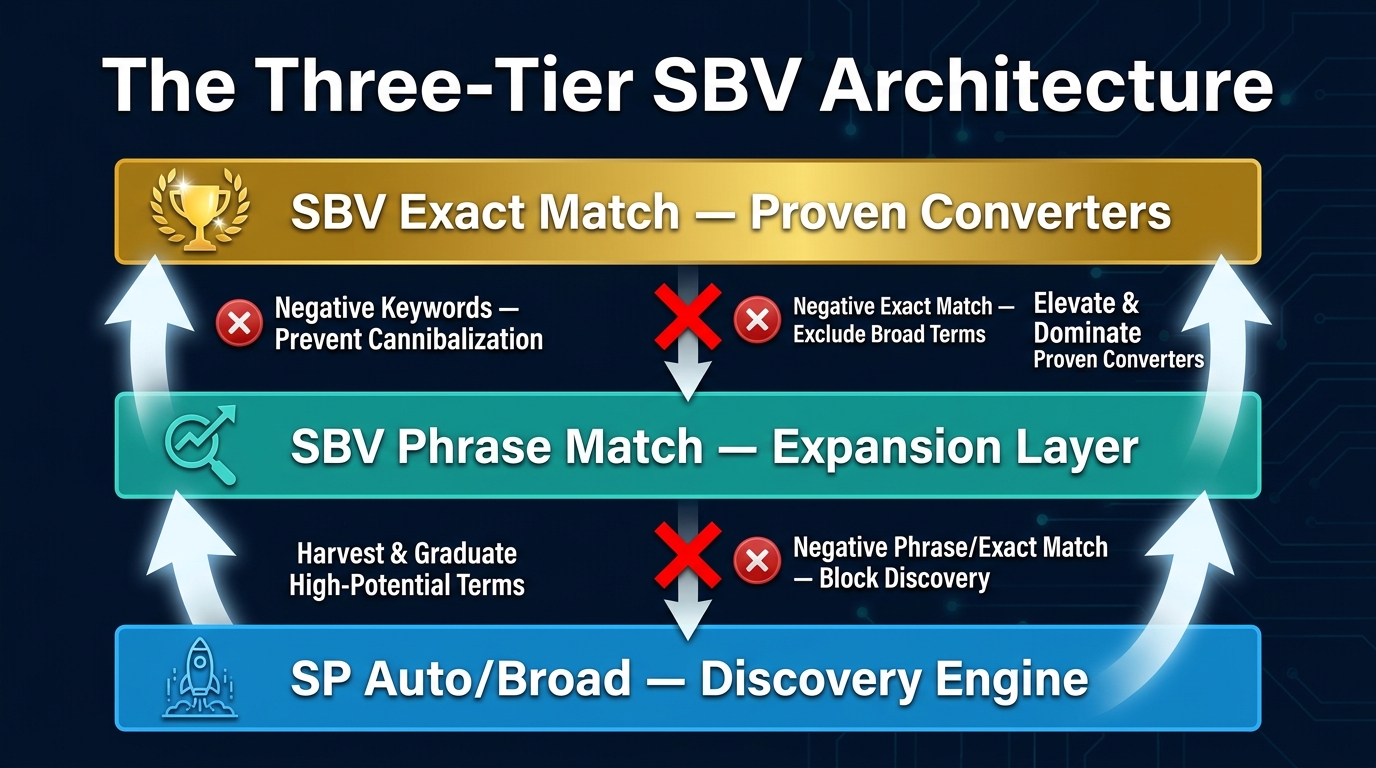
    Three-tier SBV campaign architecture diagram — Exact Match proven converters, Phrase Match expansion, SP Auto/Broad discovery

    Once you have your qualified, scored list of SBV-ready search terms, the campaign structure you build around them determines whether the system is manageable, measurable, and improvable over time.

    The Three-Campaign Stack

    The cleanest SBV architecture for search-term-first targeting uses three distinct campaign types, each with a defined role:

    Tier 1 — SBV Exact Match (Proven Converters): This is where your highest-priority terms go. Exact match gives you precise control — you know exactly which query triggered the impression, you can set specific bids per keyword, and you can measure performance at the term level with confidence. Budget allocation here should be your heaviest, as these are the terms with demonstrated purchase intent and the highest confidence in their conversion behavior.

    Tier 2 — SBV Phrase Match (Expansion Layer): Your second-tier terms — those that qualified but with lower scores — go here as phrase match keywords. Phrase match allows close variants and additional words around your core term, which creates controlled volume expansion. You will collect new search term data at the SBV level that can feed future exact match promotions or negative keyword additions.

    Tier 3 — SP Auto/Broad (Discovery Engine — not SBV): This is your existing SP infrastructure, continuing to do what it does best: discover new search terms through broad match and auto targeting. This tier feeds qualified new terms upward into the SBV tiers on a regular review cadence (typically every 30 days).

    Ad Group Architecture Within SBV Campaigns

    Within your SBV exact match campaign, resist the temptation to pile all keywords into a single ad group. Segmenting ad groups by intent cluster allows you to align creative more precisely with the shopper’s mindset and, importantly, allows you to run different video creatives for different query types.

    Practical intent clusters that work well for SBV ad group segmentation:

    • Category-generic terms (e.g., “insulated water bottle”) — high volume, competitive, discovery intent
    • Feature-specific terms (e.g., “leak proof water bottle with straw”) — lower volume, higher CVR, feature-match intent
    • Use-case terms (e.g., “hiking water bottle 40oz”) — mid volume, lifestyle intent, strong upsell/lifestyle creative potential
    • Competitor brand terms (e.g., “Hydro Flask alternative”) — high intent, conquest context, requires specific creative framing

    Each cluster gets its own ad group, its own video creative (where budget allows), and its own performance benchmarks. This granularity is what allows you to see not just “does SBV work?” but “which intent context does SBV perform best in?” — which is the question that drives meaningful optimization.

    Budget Allocation Across Tiers

    A practical starting split for accounts new to search-term-first SBV targeting: 70% of SBV budget to Tier 1 exact match, 30% to Tier 2 phrase match. As exact match campaigns accumulate sufficient data and you’ve confirmed performance, you can increase total SBV budget while maintaining this ratio, or shift more toward exact match as phrase match terms graduate.

    Keep SBV campaigns separate from static Sponsored Brands campaigns. Mixing formats within the same campaign prevents clean performance analysis and makes bid management unnecessarily complex. The separation also makes it much easier to track SBV-specific metrics like view rates and the new-to-brand percentage that video tends to generate.

    Match Type Strategy: Why Exact-First Thinking Governs the Whole System

    There is a recurring debate in Amazon PPC circles about whether to launch SBV campaigns broad or narrow. Some practitioners argue for starting broad to collect data quickly. Others argue for starting narrow to control spend. When you’re operating a search-term-first system sourced from SP data, this debate resolves itself: you already have the data. You don’t need broad match to discover what works — you know what works. Exact-first is not caution; it’s precision informed by evidence.

    Why Exact Match Is the Right Starting Point for SBV Candidates

    When you promote a term from SP into SBV exact match, you have a specific piece of knowledge: this exact customer query, typed in this exact way, has driven purchases at an acceptable efficiency in your SP campaigns. Exact match in SBV preserves that precision. You know your ad will appear when shoppers type that query (and close variants), and you can set your bid based on the CVR and revenue-per-click data you already have.

    Launching those same terms as phrase or broad match in SBV introduces variability — the ad may appear for queries that look similar but behave differently. A phrase match on “stainless steel insulated water bottle” will also trigger for “stainless steel insulated water bottle for kids” and “best stainless steel insulated water bottle 2026” — queries you may not have data on. If those variants don’t convert, you are paying SBV CPC rates for impressions that your SP data would have told you to avoid.

    When to Introduce Phrase Match in SBV

    Phrase match becomes appropriate in SBV under two conditions: First, when your exact match campaigns are hitting budget limits regularly, indicating your exact match terms are too restrictive for the available demand. Second, when you want to deliberately expand coverage to related intent variants that you haven’t yet tested in SP — essentially using SBV phrase match as a slightly more expensive version of SP discovery.

    If you use SBV phrase match for discovery, treat the SBV search term reports from those campaigns as a secondary source of exact match candidates — for both SBV and, potentially, for expansion in SP where the CPC will be lower and data collection more cost-efficient.

    Broad Match in SBV: Handle with Care

    Broad match in SBV campaigns is best avoided for terms that haven’t proven their performance in SP first. Amazon’s broad match can trigger for queries with significant semantic distance from your target term, and at SBV CPC rates, that discovery cost is high. If you want to use SBV for pure brand discovery (reaching shoppers with no prior SP data), that is a legitimate strategy — but it should be in a separate campaign with a separate budget, clearly labeled as awareness-stage spend, and measured with different KPIs than your performance SBV campaigns.

    Creative That Actually Converts at the Keyword Level
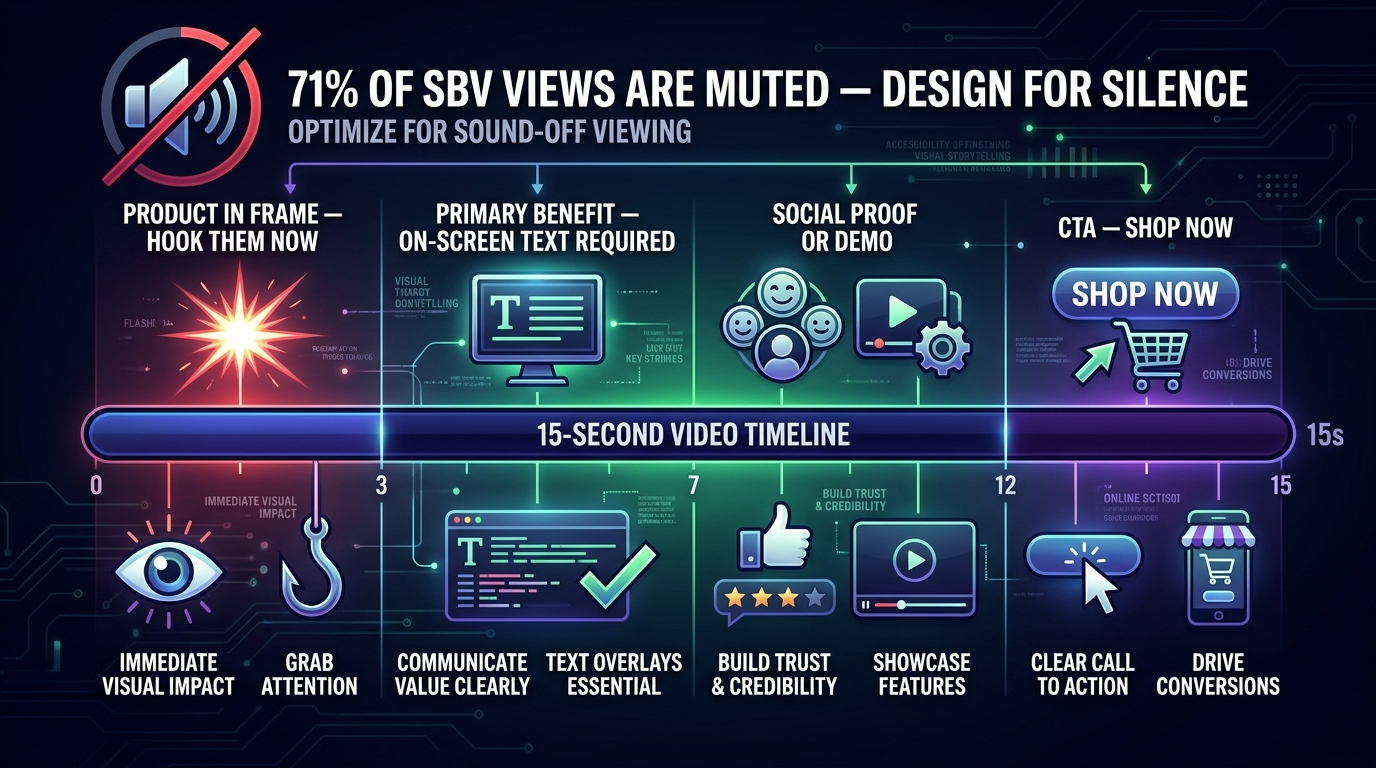
    15-second SBV video timeline showing the four key segments with muted-viewing design principles — 71% of SBV views are muted

    Search-term-first targeting tells you where to run your video. It doesn’t tell you what the video should say. The creative layer is where the targeting logic and the shopper experience connect — and getting it wrong can negate the advantages of even the most carefully selected keyword set.

    Design for Muted Viewing First

    As of 2026, an estimated 71% of SBV views are played with sound off, up from roughly 64% two years prior. The trend toward muted autoplay viewing is structural — it reflects how people shop on Amazon in real-world environments (offices, public transit, shared spaces). This means your SBV creative must be fully comprehensible without audio. If the primary message of your video relies on a voiceover that a muted viewer will never hear, the video is failing the majority of its audience.

    The practical rule: close-caption every piece of speech in the video, and more importantly, put the core product benefit statement as a large, readable on-screen text element that appears within the first three to four seconds. Don’t treat captions as an accessibility afterthought — treat them as the primary communication layer.

    The 15-Second Timeline That Works

    Amazon allows SBV formats ranging from 6 to 45 seconds, but practitioner data consistently points to 15 to 20 seconds as the sweet spot for search-result placements. Longer videos may perform well on product detail pages, but in the search results context, shorter is better because the format competes with organic listings and the shopper’s primary goal is evaluation, not entertainment.

    A practical 15-second structure that aligns with search-result intent:

    • Seconds 0–3: Product clearly in frame. No logo reveal, no cinematic opening. The product should be recognizable within the first two seconds. This is when most drop-off decisions happen.
    • Seconds 3–8: Primary benefit stated on-screen in readable text. This should answer the implicit question behind the keyword. A shopper who typed “leak proof water bottle” should see “100% Leak Proof, Guaranteed” within the first five seconds.
    • Seconds 8–13: Supporting proof — a quick product demo, a use-case shot, or a secondary benefit. This is where lifestyle context can help without replacing product clarity.
    • Seconds 13–15: Call to action. “Shop Now” is the standard. Consider including a brief differentiation statement here — “Free shipping on Prime orders” or a specific offer — that creates urgency without overpromising.

    Aligning Creative to Keyword Intent

    This is the operational implication of search-term-first targeting that most advertisers miss: if you have segmented your SBV ad groups by intent cluster (as described in the campaign architecture section), you should be running different video creative for different clusters where budget allows.

    A shopper who typed “hiking water bottle 40oz” is in a different mental context than one who typed “stainless steel water bottle office.” The first shopper wants to see outdoor usage context — rugged terrain, a trail, a daypack. The second shopper wants to see clean design, desk compatibility, professional aesthetics. Running the same generic product video against both terms is leaving persuasion efficiency on the table.

    You don’t need an unlimited video production budget to do this. Simple video variants — changing the opening shot, swapping the benefit headline text, showing a different use context in seconds 8 to 13 — can be produced as edits of a core video asset rather than entirely separate productions. The key is matching the opening frames and the benefit headline to the specific shopper intent cluster you’re targeting.

    Amazon’s Autoplay Loop and the Scroll Behavior Problem

    SBV autoplays and loops continuously as shoppers scroll past. This is both an advantage (multiple exposures per page load) and a creative constraint (the video must make sense when entered at any point in the loop, not just from the beginning). Design your creative so the product and primary benefit are visible throughout the video, not just in the final seconds. Treat the loop as a feature, not an afterthought — a shopper who catches the second playthrough should understand your product as well as one who saw it from the start.

    Bidding Logic for SBV — Why SP Benchmarks Don’t Translate Directly

    One of the most common errors in SBV campaign setup is taking the CPC benchmarks from SP campaigns and applying them unchanged to SBV bids. The two formats operate in different auction environments with different competitive dynamics, and treating them as interchangeable will either leave impressions on the table (underbidding) or erode margin (overbidding).

    Why SBV CPCs Are Structurally Different

    SBV ads compete in a separate auction from Sponsored Products. The bidders are fewer — not every advertiser running SP on a given keyword is also running SBV — and the placements are more prominent (in-stream, high-visibility, autoplay). This creates variable CPC dynamics by category:

    • In categories where SBV adoption is high (supplements, beauty, home goods), SBV CPCs can be close to or exceed SP CPCs because competition for the placement is active.
    • In categories where SBV is less adopted, CPCs may be meaningfully lower than SP while delivering significantly higher CTR — an exceptionally favorable efficiency combination.
    • Branded keyword SBV is typically the most efficient placement in terms of CPC-to-conversion ratio, because brand-loyal shoppers click at high rates and competitors are less likely to bid aggressively on your own brand terms.

    Building a Starting Bid Framework from SP Data

    Use your SP data to calculate revenue-per-click for each qualified SBV term: attributed sales divided by total clicks over the reporting period. This gives you the maximum CPC you can afford at breakeven on that specific term, assuming the same conversion rate applies in SBV. Then apply a discount factor to account for the assumption that SBV conversion rates may not exactly match SP conversion rates initially — a common starting factor is 0.7 to 0.85 (bidding 70% to 85% of your calculated maximum CPC).

    As your SBV campaigns accumulate data over the first 30 days, compare actual SBV CVR to the SP CVR assumption. If SBV is converting at a higher rate (common due to the creative improvement), you can increase bids toward the maximum. If it’s converting at a lower rate (sometimes seen when the video creative isn’t well-matched to the keyword intent), investigate the creative alignment before adjusting bids.

    Dayparting and Budget Pacing in SBV

    SBV campaigns tend to perform differently by time of day than SP campaigns, reflecting the different attention states shoppers bring to video content. Late morning and early evening hours typically show the strongest SBV engagement rates — shoppers who are in a more deliberate browsing mode rather than quick mobile searches. Amazon’s own campaign scheduling tools allow budget adjustments by day, though not yet by hour in all markets. Monitor your SBV impression and click data by day of week during the first month to identify any meaningful patterns in your specific category.

    Measuring SBV Performance Beyond ROAS
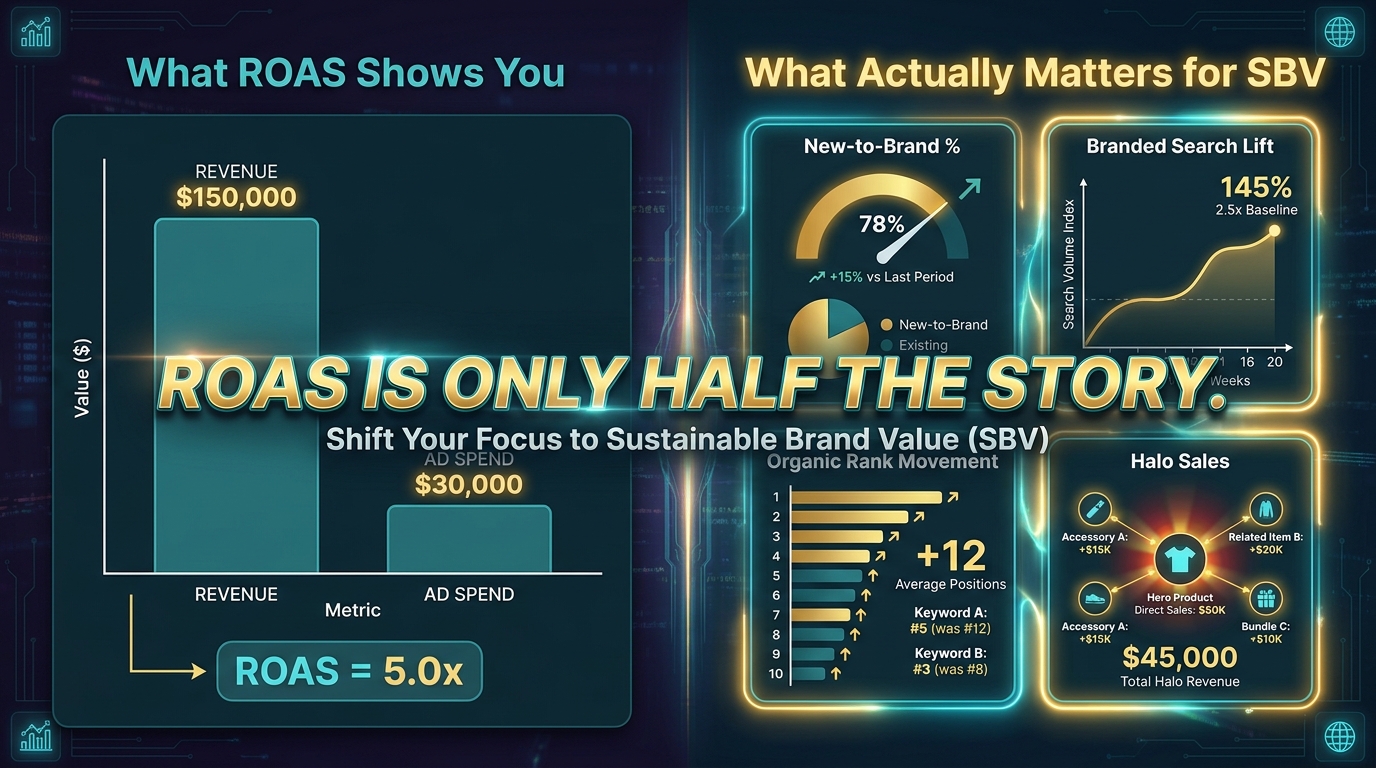
    SBV measurement dashboard showing ROAS versus New-to-Brand, Branded Search Lift, and Organic Rank — ROAS is only half the story

    ACoS and ROAS are the metrics Amazon advertisers default to because they are familiar, comparable across campaigns, and easy to understand. For SBV, they are also incomplete. Relying on ROAS alone to evaluate SBV performance leads to two systematic errors: undervaluing campaigns that deliver strong brand growth alongside modest direct ROAS, and over-pruning keyword targets that are building brand equity that will show up in organic performance weeks later.

    New-to-Brand Metrics: The Primary Incremental Signal

    Amazon’s new-to-brand (NTB) metric tracks orders from customers who have not purchased from your brand within the past 12 months. This is, in practical terms, a proxy for incremental customer acquisition — the metric that reflects whether your advertising is reaching genuinely new customers or simply recapturing existing ones who would have purchased anyway.

    SBV consistently shows higher NTB percentages than Sponsored Products campaigns for the same keywords. This makes structural sense: SBV’s prominent, autoplay placement is more likely to capture attention from shoppers who are still in evaluation mode versus those who are specifically seeking your brand. A campaign that delivers a 45% NTB rate is doing something different and more valuable than one with a 20% NTB rate, even if their headline ROAS figures are identical.

    Track NTB % per keyword cluster, not just per campaign. This granularity reveals which intent clusters are driving customer acquisition (typically category-generic and feature-specific terms) versus which are capturing repeat purchase intent (often brand terms). Neither pattern is inherently better, but they call for different measurement frameworks and different success benchmarks.

    Branded Search Lift as a Lagging Indicator

    One of SBV’s most economically significant — and least measured — effects is its impact on branded search volume. When shoppers see your brand video in search results for a category term, some portion of them who don’t click immediately will later search specifically for your brand. This creates a halo effect in branded search that shows up as increased impression share on your own branded terms in SP and SBV.

    To measure this, track weekly branded search impression volume in your SP brand campaigns. If you launch SBV on high-volume category terms and branded search impressions begin rising two to four weeks later, that is likely a SBV halo effect. Amazon’s Brand Analytics tool — specifically the Search Query Performance report — can show you branded query growth over time if you are enrolled in the relevant Brand Registry tier.

    Organic Rank Correlation

    A well-structured SBV campaign running on high-volume category terms can indirectly support organic rank by driving increased sales velocity, which is one of the signals Amazon’s ranking algorithm considers. This is not a guaranteed or direct effect, but categories and ASINs where SBV has been running aggressively on category terms for 60 or more days sometimes show organic rank improvements that cannot be fully explained by SP activity alone.

    Measure this by tracking organic rank for your target keywords using a rank tracking tool (or manual search snapshots at consistent intervals) and correlating movements with SBV campaign spend levels. Be cautious about drawing causal conclusions from short time windows — rank data is noisy — but over 60 to 90 days, meaningful patterns do emerge for well-run SBV campaigns.

    View-Through Metrics: What to Track and What to Ignore

    Amazon provides video-specific metrics in SBV campaigns: impressions, video views, view-through rate (VTR), and first quartile, midpoint, and complete view percentages. These metrics are useful for diagnosing creative performance — a video with a very low midpoint completion rate is losing viewers before the core message lands — but they are secondary to conversion metrics for keyword-level optimization decisions. Track VTR at the ad group level to assess creative quality; track CVR and NTB at the keyword level to make targeting decisions.

    Negative Keyword Discipline — The Step Most SBV Builders Skip

    Building a high-quality SBV campaign is half about which terms you target and half about which terms you actively exclude. Negative keyword management in SBV is less discussed than in SP, partly because SBV’s higher CPC makes wasted impressions less tolerable, and partly because the search term data in SBV campaigns provides a second layer of qualification data that requires active management.

    Cross-Campaign Negatives to Prevent Cannibalization

    When you promote a term from SP exact match into SBV exact match, both campaigns are now eligible to show for that query. If both trigger simultaneously, you are bidding against yourself — driving up the CPC you pay in the auction and potentially showing two of your own ads on the same results page (which can look redundant to shoppers and is inefficient from a spend perspective).

    The solution is to add the promoted term as a negative exact match keyword in your SP campaigns when it graduates to SBV. This is the “graduation and negation” principle: promote the term upward, negate it in the originating campaign. The term now lives exclusively in your SBV exact match campaign, where it will receive the video placement, and the SP campaign continues searching for new terms through broader match types.

    SBV Internal Negatives: Managing Phrase and Broad Match Bleed

    If you are running SBV phrase match alongside exact match, add your exact match terms as negative exact keywords in your phrase match campaign to prevent the phrase match campaign from triggering on queries already covered by exact match. Without this, your phrase match campaign will generate impressions on your best-performing terms at a less controlled bid, muddying your performance data and potentially overpaying.

    This cross-campaign negative structure is sometimes called a “waterfall” or “cascading negative” setup. The logic is that each tier only sees queries not already captured by the tier above it. Implementing this properly ensures that each campaign in your SBV stack is doing distinct work: exact match handles proven terms at precise bids, phrase match handles expansion terms at slightly looser bids, and neither overlaps with the other.

    Category-Level Negatives Based on SBV Search Term Reports

    After four to six weeks of running, pull the search term reports from your SBV phrase match campaigns. You will find queries that triggered the ads but showed no conversion — and some that showed very high CPC with very low CTR, indicating poor query relevance. Add these as negative phrase match keywords. This pruning process, repeated monthly, progressively tightens the quality of your SBV targeting and reduces the percentage of spend going to non-converting impressions.

    Pay particular attention to navigational queries (shoppers looking for a specific brand they already know), informational queries (shoppers in research mode, not purchase mode), and unrelated product queries that share surface-level word similarity with your keywords. These three categories are responsible for the majority of wasted SBV spend in accounts without active negative management.

    Scaling the System — When to Expand, When to Hold, When to Kill
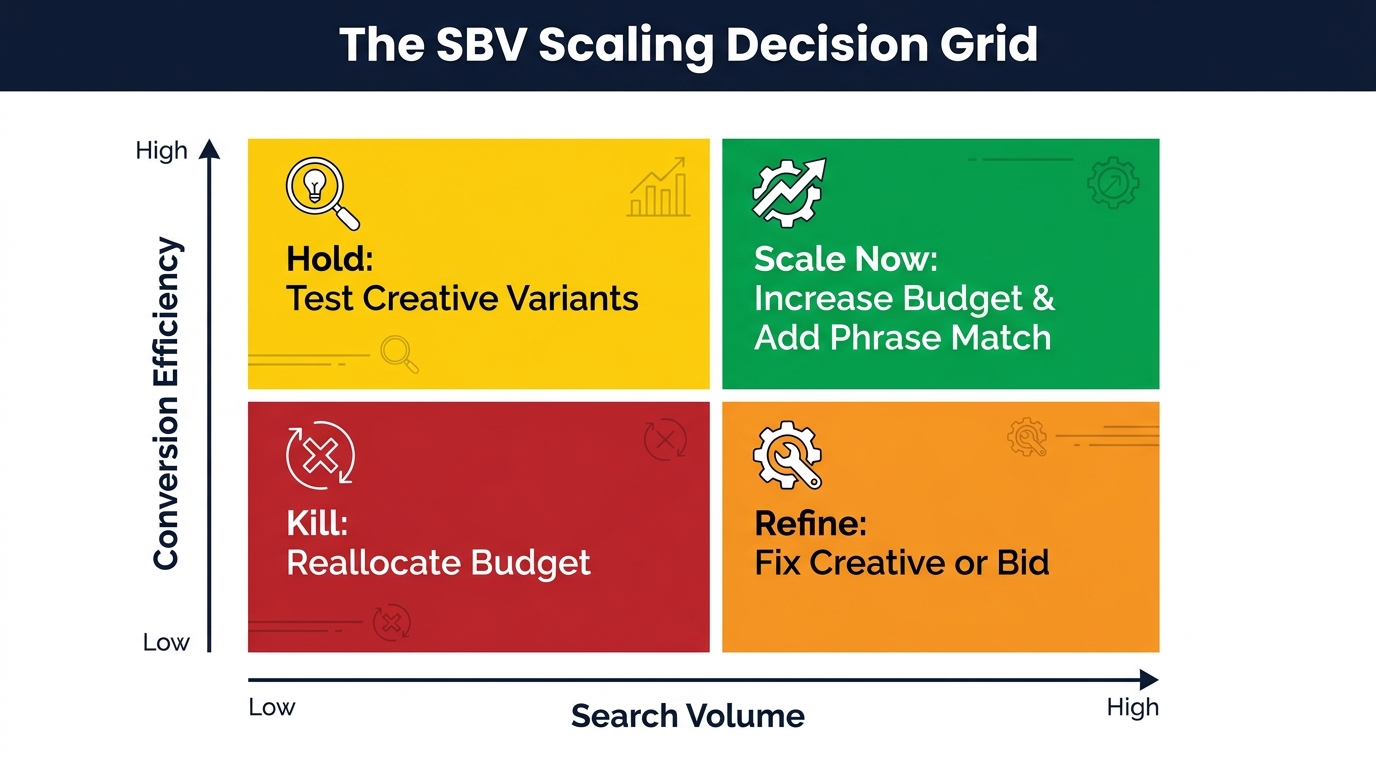
    SBV scaling decision matrix — four quadrants based on search volume and conversion efficiency, from Scale Now to Kill

    A search-term-first SBV system is not set-and-forget. It is a living structure that requires periodic review to determine which keywords deserve more investment, which need creative intervention before scaling, and which should be removed entirely to protect budget efficiency.

    The Four-Quadrant Scaling Framework

    Evaluate each keyword cluster in your SBV campaigns against two axes: search volume (the available impression pool) and conversion efficiency (actual CVR relative to your target). This creates four decision quadrants:

    • High volume, high efficiency: Scale immediately. Increase bids toward your maximum CPC (calculated from revenue-per-click), add phrase match variants, and consider additional video creative variants to test different hooks or benefit messages.
    • Low volume, high efficiency: Hold and watch. These terms are performing well but may have a small addressable audience. Don’t cut budget, but don’t dramatically increase it either. Focus instead on ensuring creative is strong so you capture all available impressions efficiently. Monitor for volume growth over time.
    • High volume, low efficiency: Investigate before cutting. High-volume terms with poor efficiency have a diagnosis problem before they have a spend problem. Common causes: bid is too high relative to actual CVR, creative is not aligned to the query intent, or the product listing page has a conversion issue independent of the ad. Fix the diagnosis first, then reassess efficiency.
    • Low volume, low efficiency: Remove and reallocate. These terms are consuming budget at an inefficient rate on a small audience. Return them to SP phrase or broad match for further testing at lower cost and revisit in 60 days.

    The 30-Day Review Cadence

    SBV campaigns need at minimum a monthly review cycle to function efficiently at scale. The review covers three activities: pulling the search term report from phrase match campaigns to find new exact match candidates, auditing bid levels against updated revenue-per-click calculations, and checking creative metrics for signs that video performance is declining (dropping VTR or rising CPC with flat CVR often signals creative fatigue in high-frequency categories).

    Some high-spend advertisers move to bi-weekly review cycles. The right cadence depends on budget scale — a $1,000/month SBV account can afford monthly reviews; a $50,000/month account cannot. In general, review frequency should scale with the dollar amount at risk in the period between reviews.

    Expanding Into New Term Categories

    Once your initial SBV exact match campaigns are performing well, the next expansion opportunity is term categories you haven’t yet targeted. The most systematic way to identify these is to look at your SP auto-targeting campaigns and extract any intent clusters that have not yet been promoted to SBV — use case terms, accessory-related terms, problem-state terms (terms describing the problem your product solves rather than the product itself). Run these through the same three-gate qualification process described earlier. If they qualify, promote them into SBV with appropriate creative.

    Competitor brand terms deserve their own consideration. They typically require specific creative framing — positioning your product as an alternative or comparison rather than simply demonstrating product benefits — and they often show different CVR patterns than generic category terms. If your SP data shows strong conversion on competitor brand terms, they can be viable SBV candidates, but budget them separately and track them with their own benchmarks.

    Common Mistakes That Undermine Search-Term-First SBV Campaigns

    The system described in this post is logical when laid out in sequence, but in practice several failure patterns appear repeatedly in SBV campaigns that claim to be data-driven but aren’t truly operating search-term-first.

    Using SP Impression Data Instead of Conversion Data as the Primary Filter

    High-impression terms in SP are attractive — they suggest there is a large audience for the query. But impressions without conversion data only tell you that the query has volume, not that it converts. SBV built around high-impression, low-conversion terms will generate views but not orders. Always filter on conversion activity first. Volume is a secondary consideration.

    Skipping the Negative Keyword Setup at Launch

    New SBV campaigns are often launched without any negative keywords because the thinking is “we’ll add negatives once we see what’s converting.” This is backwards. At a minimum, you should add known irrelevant terms as negatives at launch — terms that triggered in SP with zero conversions, informational queries, and competitor navigational terms. Waiting until the SBV campaign generates its own wasteful data means paying SBV rates to discover what your SP data already told you.

    Running a Single Video Creative Across All Intent Clusters

    Generic product videos that perform adequately across all keyword types perform excellently for none of them. If your budget only allows for one video initially, accept that constraint and plan for creative variants as the campaign matures. But don’t rationalize one creative as “good enough” — it is a starting point, not an endpoint. Creative alignment to keyword intent is one of the highest-leverage optimization opportunities available in SBV.

    Measuring SBV on the Same Efficiency Target as SP

    Setting the same ACoS target for SBV and SP campaigns systematically undervalues SBV’s contribution. Because SBV drives higher NTB percentages and creates branded search halo effects, its true economic contribution exceeds what last-click ACoS captures. Set SBV efficiency targets at a modest premium — typically 20% to 35% higher ACoS tolerance than your SP target — and evaluate NTB and organic impact alongside ACoS to justify the differential.

    Letting the SP Data Source Go Stale

    The SP search term report that seeded your initial SBV keywords was relevant when you pulled it. Customer search behavior evolves, seasonal demand shifts, and your SP campaigns continue generating new data. A SBV campaign built on a one-time SP data pull will gradually drift out of alignment with current demand. Build the 30-day SP-to-SBV review into your standard operating cadence. Treat it as an ongoing feed, not a one-time setup step.

    Building the Repeatable System — From One-Time Setup to Ongoing Flywheel

    The most durable competitive advantage from search-term-first SBV targeting comes not from the initial setup but from the flywheel effect created when the system runs continuously: SP discovers and tests terms at lower cost, the strongest terms graduate to SBV for higher-visibility placement, SBV generates additional search term data and NTB customers, branded search lift feeds back into brand campaign efficiency, and organic rank improvements from increased sales velocity reduce the reliance on paid placement over time.

    This flywheel only spins consistently if the process is documented, assigned, and repeatable. The practical operational requirements:

    • A monthly SP search term report pull with documented qualification criteria applied consistently
    • A clear handoff process for new terms entering SBV (campaign placement, match type assignment, bid calculation, negative keyword deployment)
    • A performance review template that covers ACoS, CVR, NTB%, view metrics, and bid adjustments for each SBV keyword cluster
    • A creative review process triggered when view-through metrics decline or CPC-to-CVR ratios deteriorate
    • A scaling review that assesses each keyword against the four-quadrant framework monthly

    Teams that treat SBV targeting as a one-time project tend to see initial performance gains followed by gradual degradation as the keyword set becomes stale and creative grows repetitive. Teams that build it as a repeatable system compound their advantage month over month — each review cycle improving keyword precision, creative alignment, and bid accuracy simultaneously.

    The Competitive Reality: What Happens If You Don’t Build This System

    The argument for search-term-first SBV targeting is sometimes framed as an offensive opportunity — a way to take share, build brand awareness, and accelerate growth. But it is equally important to understand the defensive dimension: in competitive categories where your rivals are running SBV on the high-intent keywords you’ve proven, your organic and SP placements are being surrounded by video content from other brands. Shoppers who search for terms where you rank well organically are seeing competitor SBV ads before they ever reach your organic listing.

    The SP data you’re sitting on right now tells you which keywords deserve video defense. It tells you where competitors are most likely building their SBV campaigns, because those are the high-intent terms that every serious advertiser in your category is watching. Acting on that data before competitors fill those placements is the strongest timing argument for urgency in building this system.

    SBV placements are finite — there is typically one video placement per search results page per query. First-mover advantage in SBV targeting for a given keyword cluster is real and meaningful. The brand that occupies the in-stream video position on a high-intent search term consistently, over weeks and months, builds a visual association advantage that is difficult to displace once established.

    Conclusion: Data First, Video Second — Always

    The core argument of search-term-first SBV targeting is simple even if the execution is detailed: video is a powerful format, but format alone doesn’t win. The terms you choose to run video against determine whether that format power is directed at shoppers who are predisposed to purchase or at a broad audience with unclear intent. Your SP search term data is the most reliable tool you have for making that determination — because it is based on actual customer behavior, not projected demographics or estimated demand.

    Build the qualification process before you build the campaign. Build the campaign structure before you build the creative. Set up negatives before you collect waste. Measure NTB and organic halo alongside ROAS. Review the SP data feed every 30 days to keep the keyword set current. And when you’re ready to scale, use the four-quadrant framework to make decisions that are evidence-based rather than instinct-based.

    The advertisers winning in SBV-dominant categories in 2026 are not necessarily the ones with the biggest video production budgets or the most creative teams. They are the ones who have built the most systematic, data-informed approach to deciding which search terms deserve a video impression in the first place. That system starts in your SP search term report. Everything else follows from there.

    Key Takeaways

    • Start with SP data, not creative: Qualify search terms through a three-gate filter (minimum orders, acceptable ACoS, adequate impressions) before committing them to SBV.
    • Use exact match first: Proven SP converters deserve exact match SBV placement. Phrase match is for controlled expansion, not initial targeting.
    • Segment by intent cluster: Different ad groups for category-generic, feature-specific, use-case, and competitor terms — with aligned creative where budget allows.
    • Deploy negatives at launch: Don’t wait for SBV to discover waste your SP data already flagged. Add known non-converters as negatives from day one.
    • Measure NTB alongside ROAS: New-to-brand percentage is the primary signal of SBV’s incremental value beyond last-click attribution.
    • Build the 30-day review cycle: The system compounds when SP data continuously feeds new qualified terms into SBV. One-time setup is not enough.
    • Apply the four-quadrant scaling framework: Scale high-volume, high-efficiency terms; investigate high-volume, low-efficiency terms; remove low-volume, low-efficiency terms.
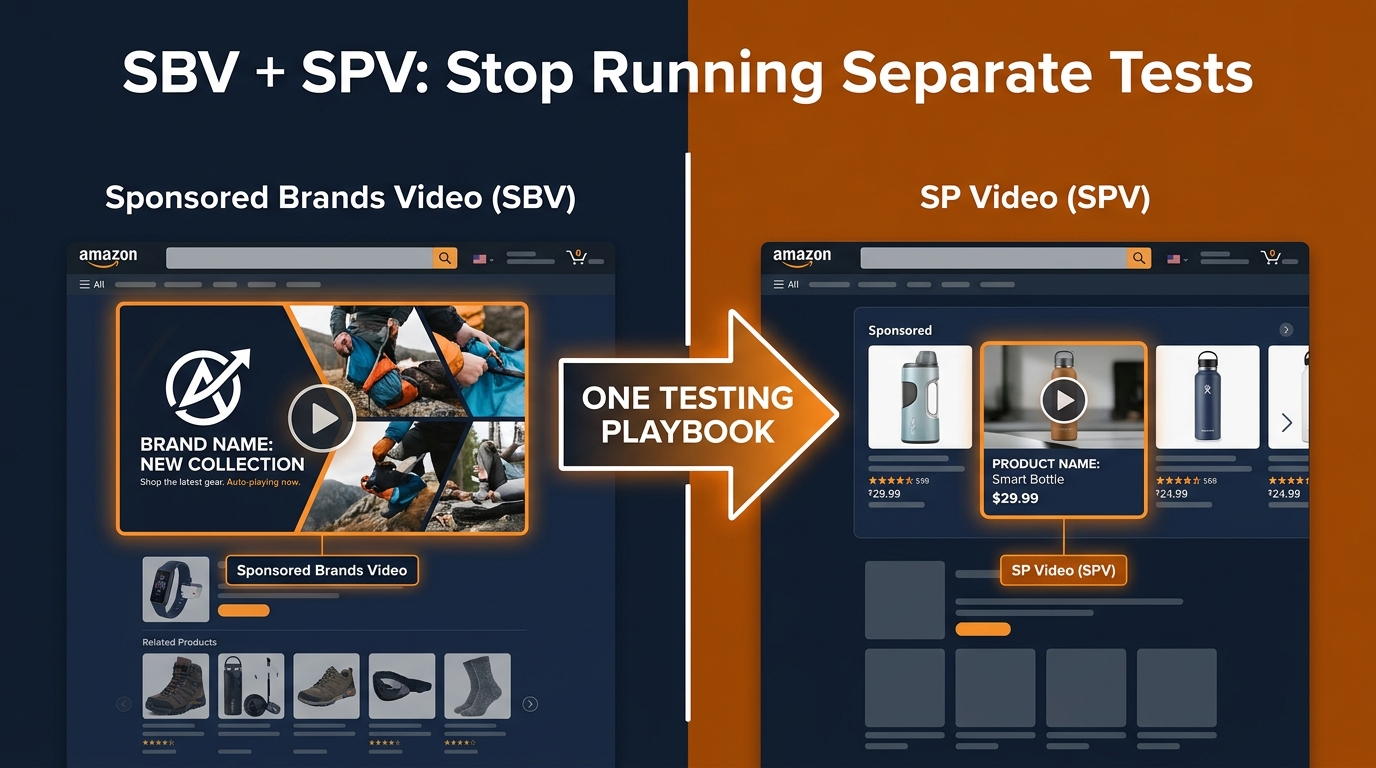
  • Sponsored Brands Video + SP Video: One Unified Testing Playbook

    Sponsored Brands Video + SP Video: One Unified Testing Playbook

    SBV + SPV: Stop Running Separate Tests — One Unified Amazon Video Testing Playbook

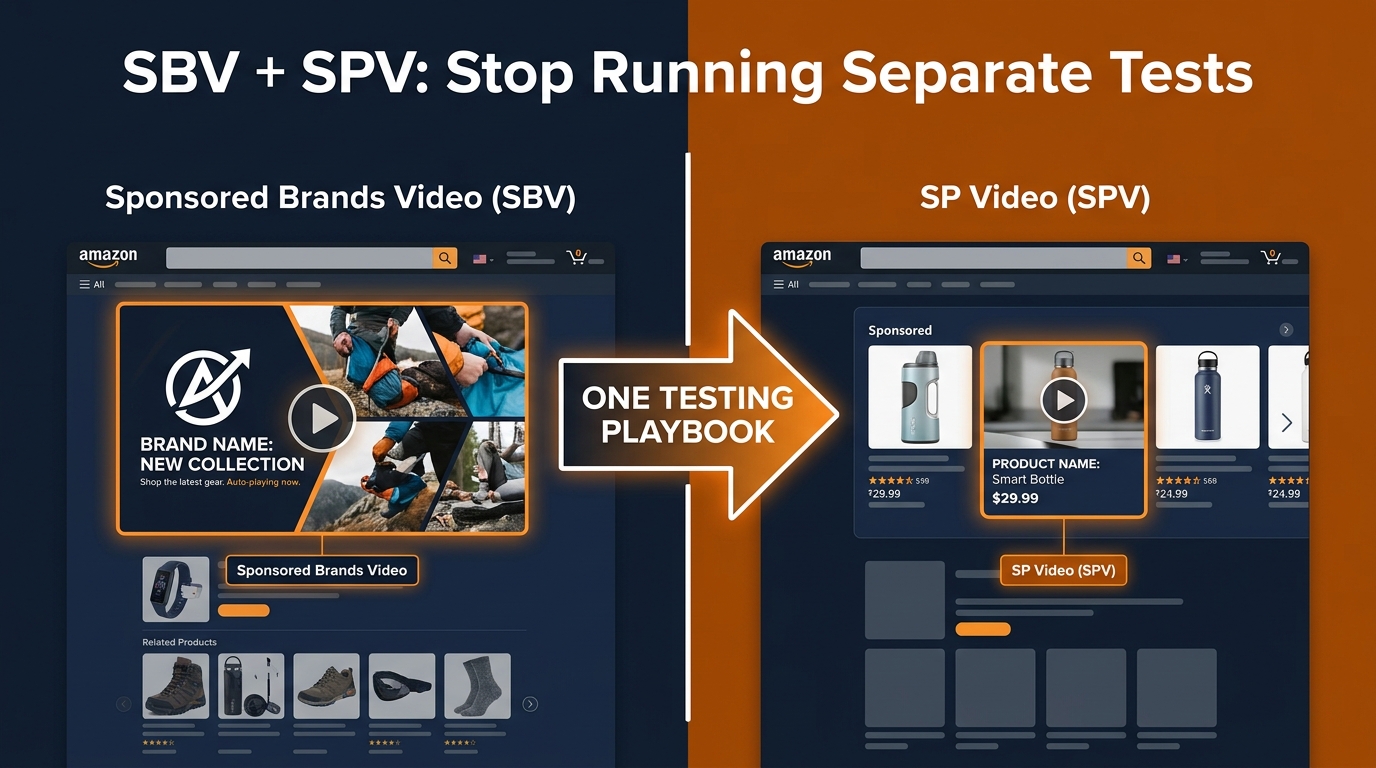
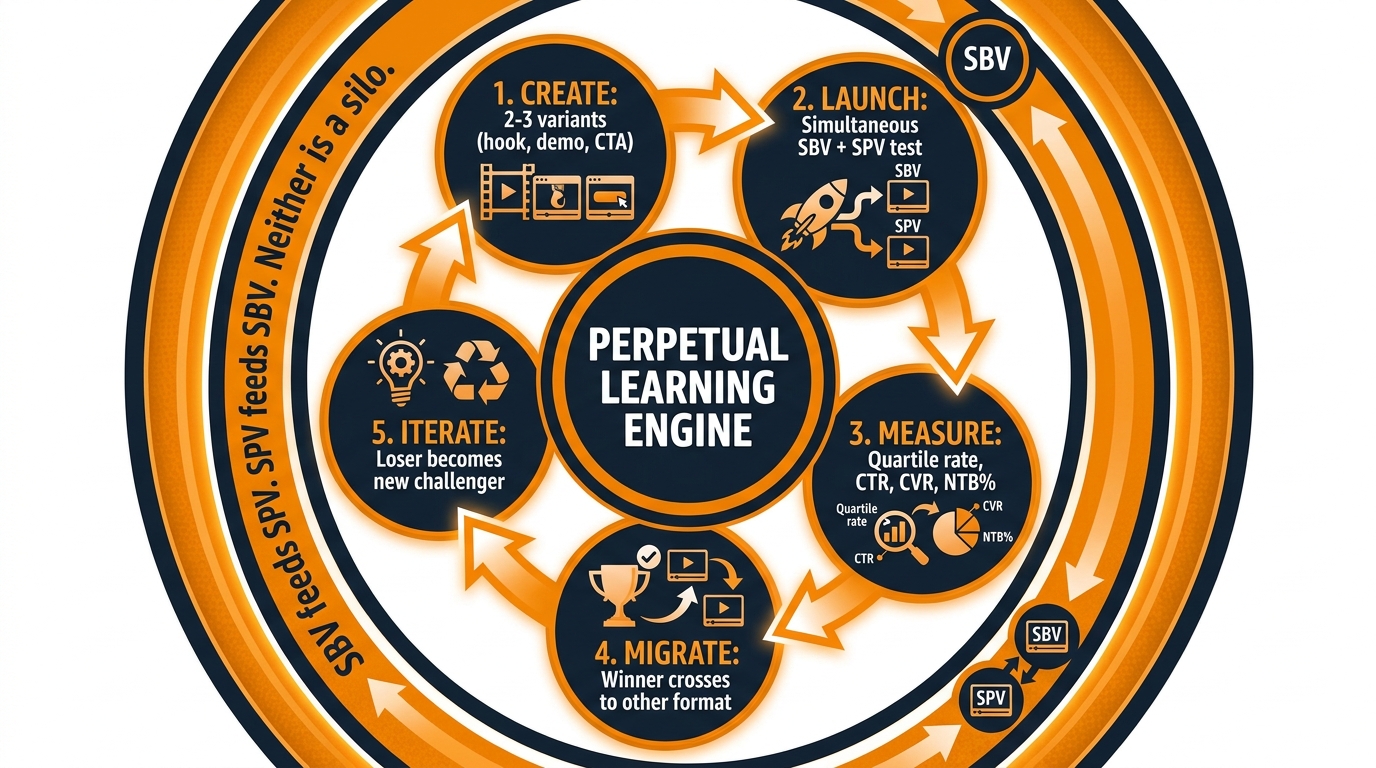
    Most Amazon advertisers running Sponsored Brands Video and Sponsored Products video are operating two entirely separate testing programs — different creative briefs, different optimization schedules, different success metrics, and different people making the calls. The result is a lot of expensive learning that never compounds.

    The irony is that SBV and SPV show the same products to the same shoppers, often on the same search results pages, sometimes within seconds of each other. Yet the creative insights from one format almost never inform the other. Test a winning hook in SBV? It sits there, producing reports. Nobody checks whether that hook would also lift conversion in SPV. Run a tight product demo in SP video that destroys your ACoS target? Chances are nobody takes that learning back up-funnel to SBV.

    This is a structural inefficiency, and in 2026 — when video is no longer an optional add-on but the default Sponsored Brands format — it’s an increasingly costly one. This post lays out a single, unified testing framework that treats SBV and SPV as two data sources feeding one creative intelligence system. It covers how the formats actually differ (beyond what Amazon’s documentation tells you), how to design tests that generate transferable insights, how to read the signal stack correctly across both, and how to build a migration protocol that moves winning creative between formats without losing the data that made it win.

    The goal isn’t to simplify your campaigns — it’s to multiply the learning velocity you get from every dollar you spend on video.

    The Structural Difference That Actually Matters (Not What You Think)

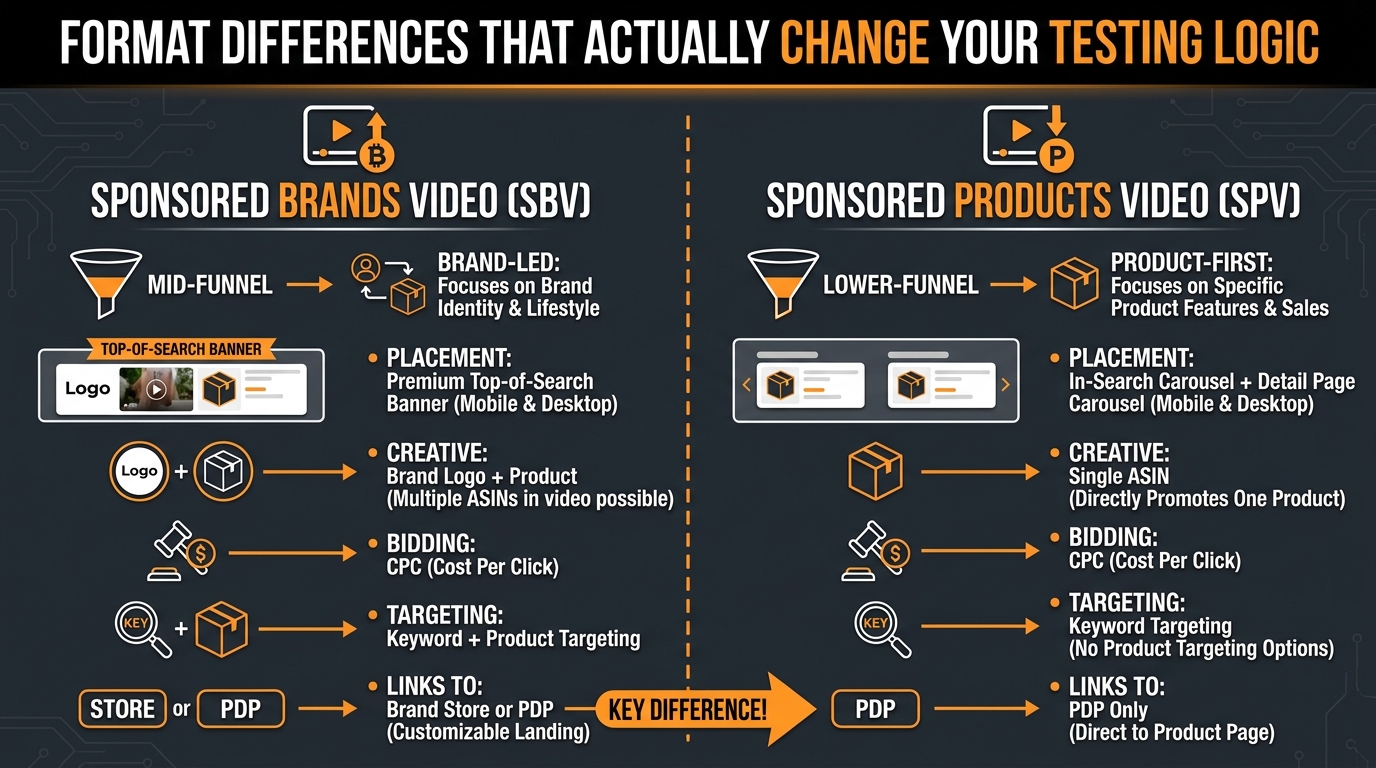
    Format differences between Sponsored Brands Video and Sponsored Products Video that change your testing logic

    Most guides on this topic open with a table comparing SBV and SPV on dimensions like bidding model, targeting types, and where the click goes. That’s useful context, but it isn’t what actually changes how you should test. The placement architecture is what matters — and specifically, what shopper mental state each placement catches.

    SBV: The Banner That Interrupts a Decision Already in Progress

    Sponsored Brands Video sits at the top of search results as a wide, auto-playing banner. It appears when a shopper is already mid-comparison — scanning results, looking at thumbnails, weighing options. The shopper hasn’t clicked anything yet. They’re in browse mode, not buy mode. SBV’s job is to interrupt that horizontal scanning and redirect attention toward a specific brand or product before the shopper settles into examining a detail page.

    This shapes what an SBV creative needs to do: it needs to win attention and earn intent in the same motion. A 15-second video that takes 8 seconds to get to the product hasn’t done its job. At the same time, SBV has more visual real estate and sound permission than SPV, which means it can carry more creative complexity — a brief brand moment, a problem framing, a lifestyle signal — before the product appears.

    Critically, SBV supports both keyword and product targeting, and it can send traffic to a Brand Store or a product detail page. This targeting flexibility means you can run separate SBV campaigns against different intent segments — branded queries, category keywords, and competitor ASINs — and get different creative signals from each. Most advertisers don’t use this to their advantage; they run one SBV creative against a broad keyword list and call it video strategy.

    SPV: The Carousel Slot That Has to Compete With Nine Other Products

    Sponsored Products video occupies a slot inside the search results carousel, surrounded by competing product tiles. The shopper is actively comparing and has already started filtering. They’re closer to a click. SPV doesn’t have the banner’s visual dominance — it’s the same size as a product image slot — but it autoplays, which makes it the most kinetically different tile in the row. Motion wins attention even in a crowded grid.

    SPV also appears on product detail pages, where the shopper has already chosen to examine a specific product in depth. In this placement, SPV is competing less with other video and more with the listing itself. The creative job here is closer to a demo reel than a discovery hook: the shopper wants to confirm, not be introduced.

    SPV is keyword-targeted only (to a single ASIN), which simplifies its targeting structure but also concentrates its creative demand. Every click is product-first. There’s no brand buffer, no Store landing page, no secondary message. If the product doesn’t show up clearly in the first two seconds, the shopper scrolls past.

    What the Difference Actually Means for Testing

    The reason this matters for your testing program is that SBV and SPV are testing the same creative hypotheses at different points in the decision journey. SBV is testing whether a creative can generate intent. SPV is testing whether it can close on that intent. A creative that performs well in SBV but fails in SPV usually has a strong hook and weak product demonstration. A creative that performs well in SPV but was never tried in SBV is a proven closer that might also function as an interest-driver up-funnel — but you’d only know that if you tested it there.

    This is the core insight that makes a unified testing playbook possible: the formats don’t test different things; they test the same creative hypotheses against different shopper contexts. Once you internalize that, treating them as separate programs stops making sense.

    Why Your Test Results Don’t Transfer Between Formats — And How to Fix That

    The most common reason video test results stay siloed is structural: SBV and SPV are managed in different campaign types, often by different team members or agencies, with different reporting cadences and different success metrics. SBV gets measured on brand metrics — NTB percentage, branded search lift, Store visits. SPV gets measured on conversion efficiency — ACoS, CVR, ROAS. These aren’t bad metrics; they’re just optimized for different objectives, and when they’re tracked in isolation they make it nearly impossible to ask cross-format questions.

    The Metric Mismatch Problem

    When your SBV team sees a strong NTB percentage and your SPV team sees a strong ROAS, they each call their format a success. But you don’t know if those results are being driven by the same creative logic or by fundamentally different shopper segments. You don’t know if a creative that’s driving new-to-brand customers in SBV is the same creative that’s closing repeat purchases in SPV. Without a shared metric layer, you can’t connect the dots.

    The fix is to establish a core set of creative-level metrics that are comparable across both formats. These don’t replace format-specific success metrics — they sit underneath them as a shared diagnostic layer:

    • CTR (Click-Through Rate): Comparable across both formats, though expected values differ. SBV CTR tends to run lower in absolute terms because it’s reaching earlier-stage shoppers. What matters is relative CTR — does this creative outperform your SBV baseline? Does the same creative outperform your SPV baseline?
    • Video Completion Rate (VCR): The percentage of video starts that result in a full view. This metric exists in both SBV and SPV reporting and is the closest thing to a universal creative quality signal Amazon gives you.
    • Quartile View Rates (Q1–Q4): Available in both formats. These tell you where in the video you’re losing viewers — the diagnostic data that tells you why a creative is underperforming, not just that it is.
    • Add-to-Cart Rate and CVR: Both are accessible from campaign reporting and provide comparable signals about whether the creative is generating commercial intent, not just views.

    Building a Shared Reporting Dashboard

    The practical fix is a single dashboard that pulls SBV and SPV performance data side by side at the creative level, not the campaign level. This means tagging your video assets with a consistent naming convention that appears in both campaign types — something like [Format]-[Variant]-[Hook Type]-[Launch Date]. When a video appears in both SBV and SPV campaigns, the same asset name lets you compare its performance across contexts without manually cross-referencing two separate reports.

    This sounds basic, but it’s the operational change that most advertisers skip. Without it, you’re comparing campaigns, not creatives. And comparing campaigns across formats produces noise, not insight.

    Building the Unified Test Matrix: What to Hold Constant, What to Vary

    A unified testing playbook requires a single test matrix that spans both formats simultaneously. The principle is straightforward: you want to vary one creative element at a time while holding everything else constant, and you want the same variants running in both formats during the same test window so you’re measuring creative performance, not temporal variation.

    The Three-Layer Creative Stack

    Amazon video ads for both SBV and SPV can be decomposed into three discrete creative layers, each of which can be tested independently:

    Layer 1: The Hook (0–3 seconds). This is what determines whether the viewer keeps watching. The hook is the highest-leverage variable in your entire creative stack. A weak hook kills a great demo. A strong hook can rescue a mediocre CTA. Test the hook first, always, before you test anything else.

    Hook variants to test include: product-first (product fills the frame immediately), problem-statement (text or voiceover introduces a pain point before the product appears), benefit-lead (the primary feature or outcome is stated in text on screen before the visual cuts to the product), and social proof (a review excerpt or star rating appears in the opening frame).

    Layer 2: The Demo or Middle Section (seconds 3–12 in a 15-second video; 3–15 in a 20-second video). This is where the product does its work. The demo section tests best when you vary the type of demonstration: in-use lifestyle footage vs. isolated product against a clean background vs. feature callout text overlaid on the product vs. before/after comparison.

    Layer 3: The CTA or Close (last 3–5 seconds). This is the least commonly tested layer, partly because most advertisers assume it doesn’t move the needle and partly because the format constraints (both SBV and SPV auto-loop or end at the ASIN click) make it hard to isolate. But CTA variants — “Shop now,” explicit price display, urgency framing like “Limited stock,” or a direct benefit statement — can produce measurable CTR differences, especially in SPV where the shopper is closer to a purchase decision.

    What to Hold Constant

    When you’re running a unified test, the elements you hold constant are everything except the variable under test: the ASIN being advertised, the keyword targeting strategy, the bid level (or at minimum the bid adjustment logic), the campaign budget, the landing page, and the test window dates. If any of these vary between your SBV and SPV test campaigns, you’re no longer comparing creative performance — you’re comparing campaign configurations, which is a different and less useful question.

    The one intentional difference between the SBV and SPV versions of your test is the format wrapper itself. The underlying creative — the same raw video cut — appears in both. What changes is the format it’s served in and the placement context the shopper is in when they see it.

    The First-3-Seconds Hypothesis: Testing Hooks Across Both Formats Simultaneously

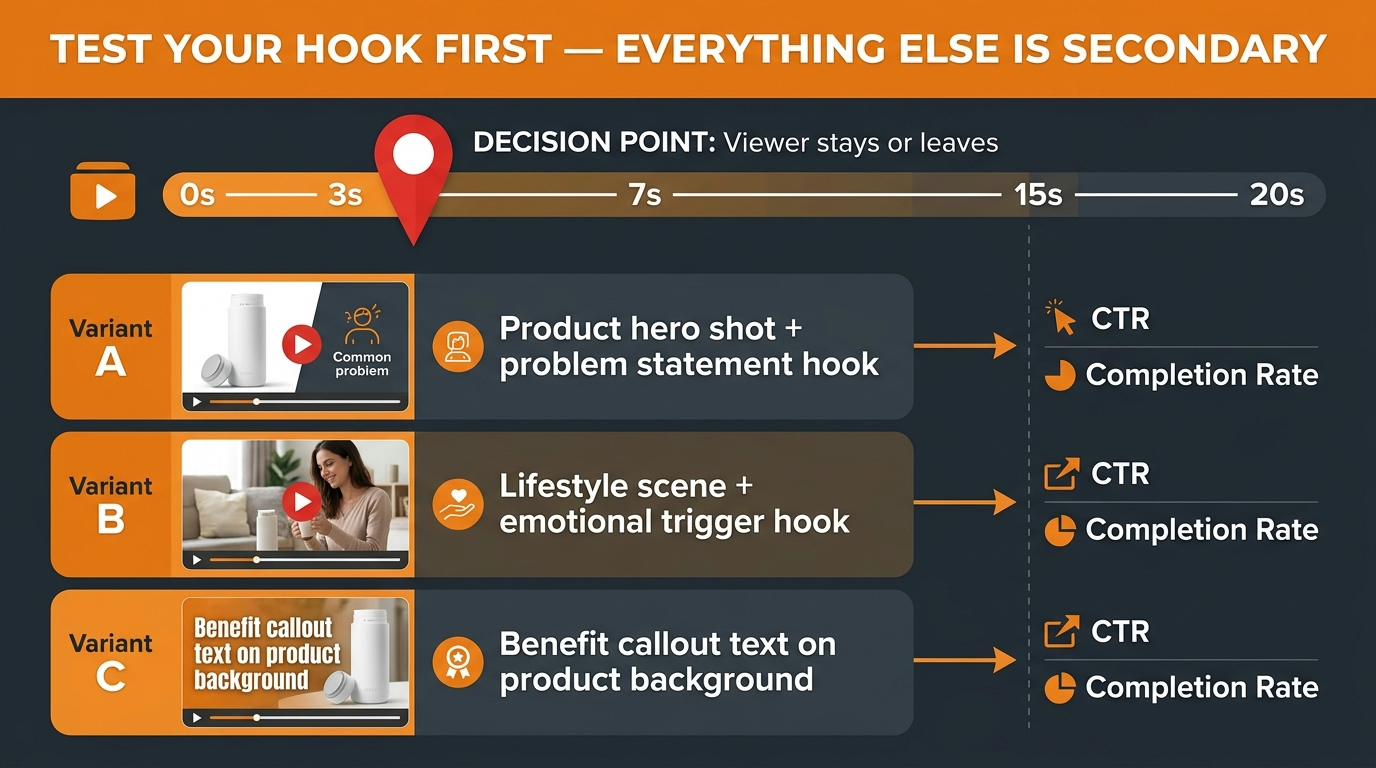
    The First 3 Seconds Hook Test for Amazon video ads — decision point where viewers stay or leave

    The single most impactful video test you can run — in either format, in any category, at any budget level — is a hook test. The first three seconds of a video determine the majority of view-through outcomes, and by extension the majority of click outcomes. Amazon’s video reporting confirms this pattern: the largest quartile drop-off for underperforming videos almost always occurs between the video start and the 25% quartile mark (which on a 15-second video is the 3.75-second point).

    Designing a Proper Hook Test

    A hook test uses the exact same demo and CTA sections across all variants, with only the first 3–4 seconds changing. This isolates the variable. If you also change the music, the background color, and the voiceover in your “different” variant, you haven’t run a hook test — you’ve run a “different video” test, which tells you almost nothing useful.

    The practical production approach is to film or generate three separate opening sequences for the same underlying video: one product-first, one problem-statement, one benefit-lead. The mid-section and close are identical across all three. Each opening gets stitched to the same back-half footage. You now have three variants that differ in exactly one creative dimension.

    Run all three simultaneously in both SBV and SPV campaigns with matched budgets and targeting. After 7–10 days (minimum), compare the Q1 quartile view rate across all six cells (3 variants × 2 formats). The variant with the highest Q1 rate — meaning the most viewers reached the 25% mark — has the strongest hook regardless of format.

    What the Cross-Format Hook Data Tells You

    Here’s the insight you can only get from running this cross-format: if the same hook wins in both SBV and SPV, you’ve found a universally strong creative opening that works regardless of where in the funnel the shopper is. Scale that hook as your control variant. If different hooks win in each format — for example, the lifestyle problem-statement wins in SBV but the product-first hook wins in SPV — you’ve discovered something important about shopper state. Shoppers at the SBV stage respond to emotional resonance; shoppers at the SPV stage want direct product confirmation.

    That insight should change not just your video creative brief, but your entire creative strategy: lifestyle and emotional content goes up-funnel, product-literal content goes lower-funnel. This is obvious in principle, but most advertisers never have the data to confirm it in their own category and product set. A unified hook test gives you that confirmation in two weeks, with your own catalog, your own shoppers, at whatever budget you’ve allocated.

    The “Sound-Off” Constraint

    Both SBV and SPV autoplay without sound in most feed contexts. Shoppers who engage with sound are self-selecting — they’re already interested. This means your hook test must be designed for silent viewing as the baseline. Any creative that depends on voiceover or audio to deliver the hook is testing a handicapped variable. On-screen text overlays, clear product visuals, and motion that reads without audio are the baseline requirements for a hook worth testing.

    Test a version of your hook with text overlay against a version without it. Across both formats, text overlays consistently outperform pure-visual hooks for shoppers watching on mute — which in mobile search contexts is the majority of your audience. This is one of those findings that feels obvious once you see the data but is routinely ignored in creative production briefs.

    Reading the Signal Stack: Quartile View Rate, CVR, and What Each Format Is Really Telling You

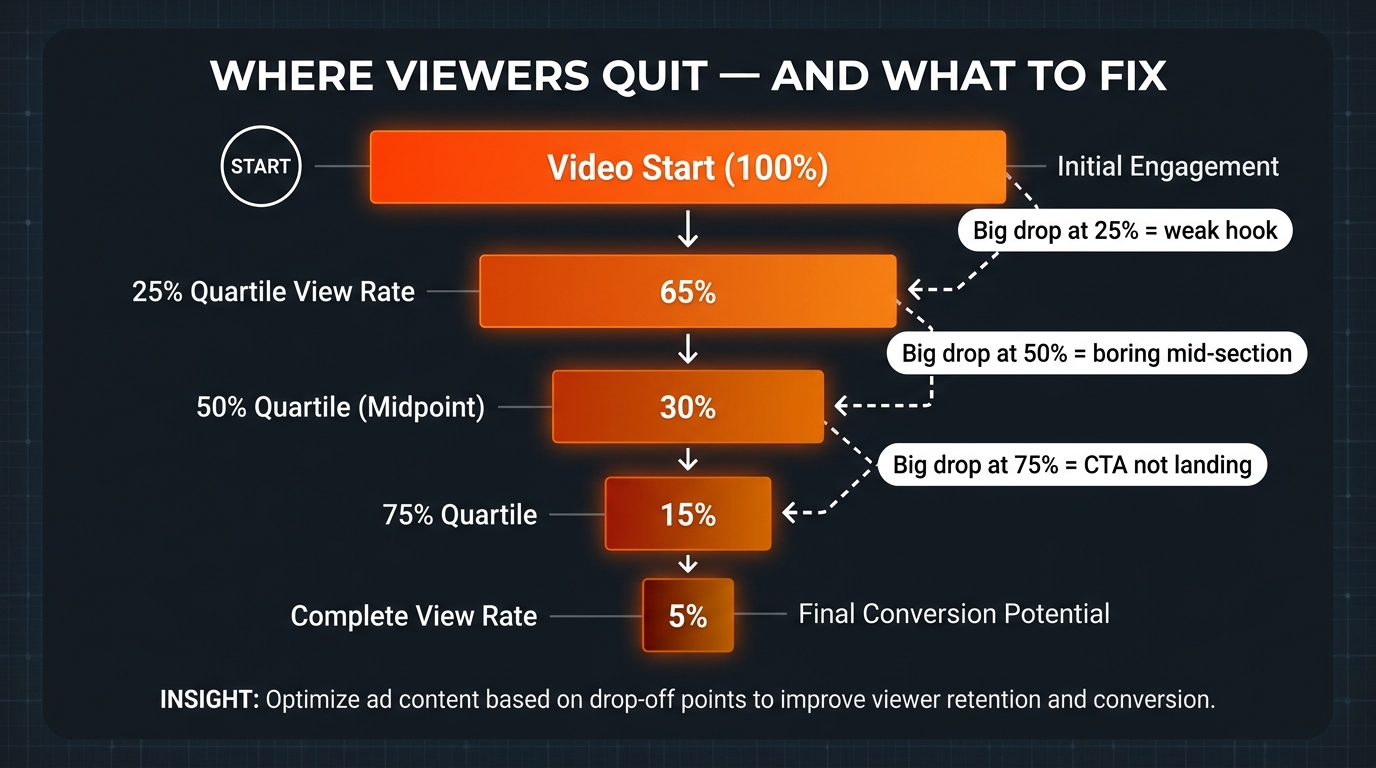
    Amazon video ad quartile view rate funnel showing where viewers quit and what to fix at each stage

    Amazon’s video reporting gives you a layered signal stack that most advertisers look at once, nod at, and then ignore in favor of ACoS. This is a mistake. The quartile data is the most diagnostic creative signal available in the Amazon ads console, and it tells a different story in SBV versus SPV — stories that only make sense together.

    How to Read the Quartile Stack

    The quartile view rate metrics in Amazon’s reporting show you what percentage of video starts reached each 25% completion milestone. Think of it as a retention curve snapshot. The diagnostic logic works like this:

    Large drop between Video Start and Q1 (25% mark): Your hook is failing. Viewers are bouncing in the first few seconds. This is a creative problem, not a targeting problem — a weak hook costs you regardless of how well-matched your keywords are.

    Large drop between Q1 (25%) and Q2 (50% midpoint): The hook worked, but the mid-section isn’t delivering. Viewers started watching and then lost interest. Common causes: the product or benefit isn’t delivered quickly enough after the hook, the pacing slows down, or there’s a tonal shift that breaks the emotional momentum the hook built.

    Large drop between Q2 (50%) and Q3 (75%): The video is holding interest into the middle but losing viewers before the CTA section. This often indicates that the demo section is too long — you’ve answered the viewer’s main question and they’ve already decided what they’re doing, so they scroll away before the CTA appears.

    Large drop between Q3 (75%) and Q4 (Complete View): The close isn’t working. The viewer watched most of the video but didn’t get pushed to a click. This is a CTA problem — the final frames aren’t generating enough urgency or clarity to convert the intent the rest of the video built.

    How the Pattern Differs Between SBV and SPV

    SBV tends to show stronger Q1 retention than SPV, because the format’s visual dominance (it’s a full-width banner, not a carousel slot) commands more attention at the start. But SBV often shows larger midpoint and completion drops — shoppers who engaged with the banner are still in comparison mode and may navigate away without clicking even after watching most of the video. This isn’t necessarily a creative failure in SBV; it can be a signal that the ad is doing its upper-funnel job (building awareness, triggering branded search later) without producing a direct click.

    SPV typically shows a sharper early drop — the format context is more competitive, and shoppers who don’t see product relevance immediately will scroll — but stronger completion-to-click conversion for the viewers who do stay. This makes SPV completion rate a stronger purchase-intent signal than SBV completion rate. A shopper who watches 80% of an SPV is very likely to click or have already decided to return.

    Reading these patterns together tells you something you can’t learn from either format alone: whether your creative is doing awareness-building work, intent-building work, or conversion work — and whether you’re getting the right kind of work at each funnel stage.

    NTB% as a Cross-Format Bridge Metric

    New-to-brand percentage (NTB%) is a metric available in SBV reporting that tells you what proportion of purchasers hadn’t bought from your brand in the prior 12 months. It’s the clearest measure of whether your video is genuinely acquiring new customers versus recapturing existing ones.

    Use NTB% to calibrate what your SBV results mean for SPV strategy. If your SBV is driving primarily NTB purchases, those are new customers who may need more hand-holding when they encounter your SPV — their first interaction with the product may have been through SBV, so the SPV demo needs to reinforce the brand and product memory, not assume prior familiarity. If your SBV is running low NTB%, it’s primarily retargeting existing customers, and your SPV can be more conversion-focused rather than introductory.

    Placement Intent Mapping: Matching Creative Variants to Search vs. Detail Page Context

    One of the underused levers in a unified video testing program is placement-level creative variation within SPV. Sponsored Products video can appear in two distinct contexts: in the search results carousel (where shoppers are comparing options) and on product detail pages (where shoppers are examining a specific product). These contexts have different shopper intents and ideally should receive different creative variants.

    In-Search Carousel: Discovery Mode

    A shopper scrolling through search results is in discovery and comparison mode. The in-search carousel context for SPV is functionally similar to the SBV banner context — both are interrupting a comparison process. In this placement, creative principles from your SBV testing apply most directly. Hook speed matters enormously. The product needs to appear in the first two seconds. Text overlay benefits are high. The creative should answer “What is this product and why should I care?” in under five seconds.

    This is why learnings from SBV hook tests transfer most cleanly to in-search SPV: the shopper state is similar enough that the same hook logic applies. If your SBV test showed that a product-first hook outperforms a lifestyle hook for your category, you should expect the same finding in your in-search SPV test. Test it to confirm, but the prior should be strong.

    Detail Page Carousel: Evaluation Mode

    A shopper viewing your SPV on a detail page has already chosen to investigate a specific product. In this context, the shopper’s questions are different: How does this actually work? What does it look like in use? How does it compare to the alternative I was just looking at? Creative that answers these questions — in-use demonstrations, feature-specific callouts, before/after visuals — outperforms discovery-oriented creative in this placement.

    Amazon allows placement bid adjustments in Sponsored Products, which means you can run separate bid multipliers for detail page placements versus search placements. Combine this with creative testing and you have the ability to run different creative strategies in each context: higher-engagement discovery creative in search, more detailed demo creative on detail pages. Most advertisers don’t build this level of placement-creative alignment into their SPV setup, which means they’re using a single creative to do two different creative jobs — and doing neither particularly well.

    Mapping Your SBV Targeting to SPV Placement

    SBV’s product targeting capability (targeting competitor ASINs) creates a direct parallel to SPV’s detail page placement when you’re running SPV against competitor product pages. If you’re targeting competitor ASINs in SPV, your creative is appearing to shoppers who are already deep into evaluating a competitor product. This is a high-intent context where comparison-focused creative — highlighting what your product does better, or what the competitor’s product lacks — often outperforms generic product demos.

    Test a comparison-angle creative variant specifically in competitor-targeted placements (both SBV product targeting and SPV detail page). This is a test most advertisers never run because they don’t segment their creative by targeting intent. The data often shows a significant CTR and conversion lift for comparison-framed creative in these high-intent, competitor-adjacent contexts.

    Budget Architecture for Cross-Format Testing Without Burning Cash

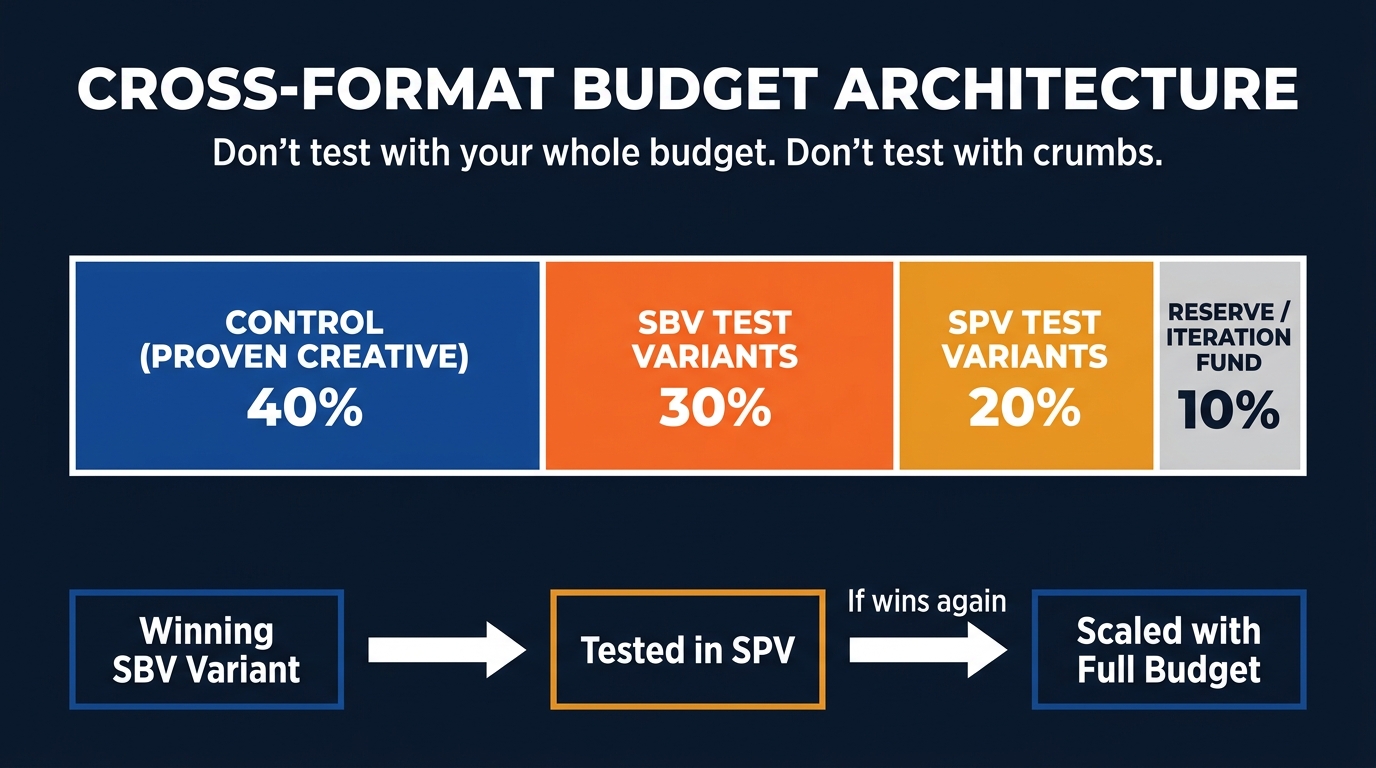
    Cross-format budget architecture for Amazon SBV and SPV testing: control 40%, SBV variants 30%, SPV variants 20%, reserve 10%

    One of the most common objections to unified video testing is budget: running variants across two formats simultaneously sounds expensive. In practice, the unified approach is more efficient than two separate testing programs because you’re amortizing your learning cost across both formats at once. A single creative test that informs both SBV and SPV simultaneously generates twice the strategic value per test dollar spent.

    The 40/30/20/10 Budget Split

    A practical starting allocation for a brand running both SBV and SPV with a combined video budget treats the total budget as a single pool to be divided as follows:

    • 40% to your Control Creative: The currently best-performing creative variant, running at full efficiency in whichever format it was validated in. This is your revenue-generating portion of the budget — it’s not being tested, it’s being scaled.
    • 30% to SBV test variants: Distributed equally across 2–3 creative variants you’re currently testing. This is usually the hook layer or the demo layer, not both at once. Running too many variables simultaneously in this budget pool produces noisy, uninterpretable data.
    • 20% to SPV test variants: The same creative variants being tested in SBV, now running in SPV for cross-format comparison. If only one variant is being tested (because you’re in a focused hook test, for example), this 20% runs the control against the challenger.
    • 10% as an iteration reserve: Held back to fund a new challenger variant mid-cycle if an early clear loser emerges. The worst thing you can do when one variant is obviously underperforming at day 7 is wait until day 28 to pause it. The reserve gives you the flexibility to introduce a replacement challenger without disrupting the overall budget structure.

    Minimum Viable Budget for Statistical Usefulness

    There’s no universal rule here because CPCs vary enormously by category, but a practical minimum is enough budget in each test cell to generate at least 50 clicks per variant before making a pause-or-scale decision. At most SBV CPCs ($0.50–$2.00+), this means each SBV variant needs at minimum $50–$100 of spend before its data is worth acting on. SPV CPCs tend to run lower in many categories, but the same click threshold applies.

    The danger zone is running test variants with daily budgets so small that each variant only gets 5–10 clicks per day. At that scale, the data swings are driven by random variation, not creative performance. You’ll make decisions based on noise and misattribute the result to creative quality. Budget discipline in a unified testing program means committing to a minimum threshold of statistical meaningfulness per cell — and building that threshold into your budget plan before the test launches, not after you’ve already started spending.

    Cross-Format Budget Rebalancing

    A common mistake is treating SBV and SPV budgets as fixed and separate throughout a test cycle. In a unified program, budget should flow toward whichever format is generating the clearest signal fastest. If your SPV test cells are hitting 50 clicks per variant after 5 days (because SPV CPCs are low in your category) but your SBV cells are still at 20 clicks after the same period, you may want to front-load the SBV budget to accelerate that signal. Unified budget management means managing to signal velocity, not to arbitrary format-by-format allocations.

    When a Creative Wins in One Format — The Cross-Format Migration Protocol

    The payoff of a unified testing program is the migration step: taking a creative that has won in one format and testing it in the other. This sounds simple, but there are two failure modes that sabotage most migration attempts.

    Failure Mode 1: Migrating the Asset Without Migrating the Context

    When an SBV creative wins — meaning it outperforms its test variants on CTR and CVR — it’s tempting to immediately copy the video file into an SPV campaign and expect similar results. The problem is that the SBV winner was optimized for the banner context: it may have a slightly slower product introduction, a brief brand moment, or a wider-frame composition that looks great in the full-width SBV banner but less compelling in the smaller carousel slot. These contextual differences mean that an unmodified SBV winner may underperform in SPV even if the underlying creative idea is sound.

    The right migration protocol starts by asking: does this creative need any contextual adaptation before moving formats? Specifically: Does the product appear clearly enough in the first 2 seconds for the SPV carousel context? Does the aspect ratio and framing work when the video is displayed at carousel dimensions? Is there any brand-logo or Store-linking element that made sense for SBV but is irrelevant (or potentially confusing) in SPV where the click always goes to the ASIN detail page?

    If any of these answers suggest adaptation is needed, create a modified version of the creative for SPV — same underlying concept, same hook, same demo logic, but with contextual adjustments. Then test the adapted version in SPV against your current SPV control, not against the unadapted SBV version. You’re testing the creative idea in the new context, not testing the format translation.

    Failure Mode 2: Treating the Migration as a Confirmation, Not a New Test

    When a creative wins in SBV and is migrated to SPV, many advertisers treat the migration as a formality — they assume it will work because it already proved itself. They skip the test structure and just run it. Then when it underperforms (as it sometimes will, for the contextual reasons described above), they’re confused and default to “video doesn’t work for us in SPV.”

    Every cross-format migration is a new hypothesis test. The hypothesis is: “This creative concept, which won in SBV, will also outperform the current SPV control in the SPV context.” Treat it exactly as you’d treat any new test variant: run it with a challenger structure, against a clear control, with sufficient budget and time to generate a meaningful signal, and with quartile data monitored throughout. The prior is strong — you have reason to believe it will work — but the format context is meaningfully different and deserves a proper test.

    The Reverse Migration: SPV Winners Going Up-Funnel

    The direction most advertisers never try is taking an SPV winner and testing it in SBV. The conventional wisdom is that SPV is lower-funnel and therefore its creative is too product-literal and conversion-focused to work as an SBV awareness vehicle. In many categories this is partially true — but not universally.

    SPV winners that combine a strong product hook with clear visual demonstration are often excellent SBV performers precisely because they bring conversion-level clarity to the awareness stage. Shoppers in SBV who encounter a no-nonsense, product-explicit creative often respond better than those who encounter a soft lifestyle brand video. The category matters: high-consideration purchases with complex feature sets may benefit from earlier product transparency. Test the reverse migration before assuming the creative hierarchy flows only top-down.

    The Cadence Question: How Long to Run Each Test Before You Have Actionable Data

    The 4-Week Amazon Video Test Cycle showing launch, observe, iterate, and decide phases for SBV and SPV

    Testing cadence is where many otherwise solid video programs fall apart. Either they make decisions too quickly (day 3 data is statistically meaningless for most Amazon video campaigns), or they run tests for so long that the winning creative is already stale by the time the pause decision gets made.

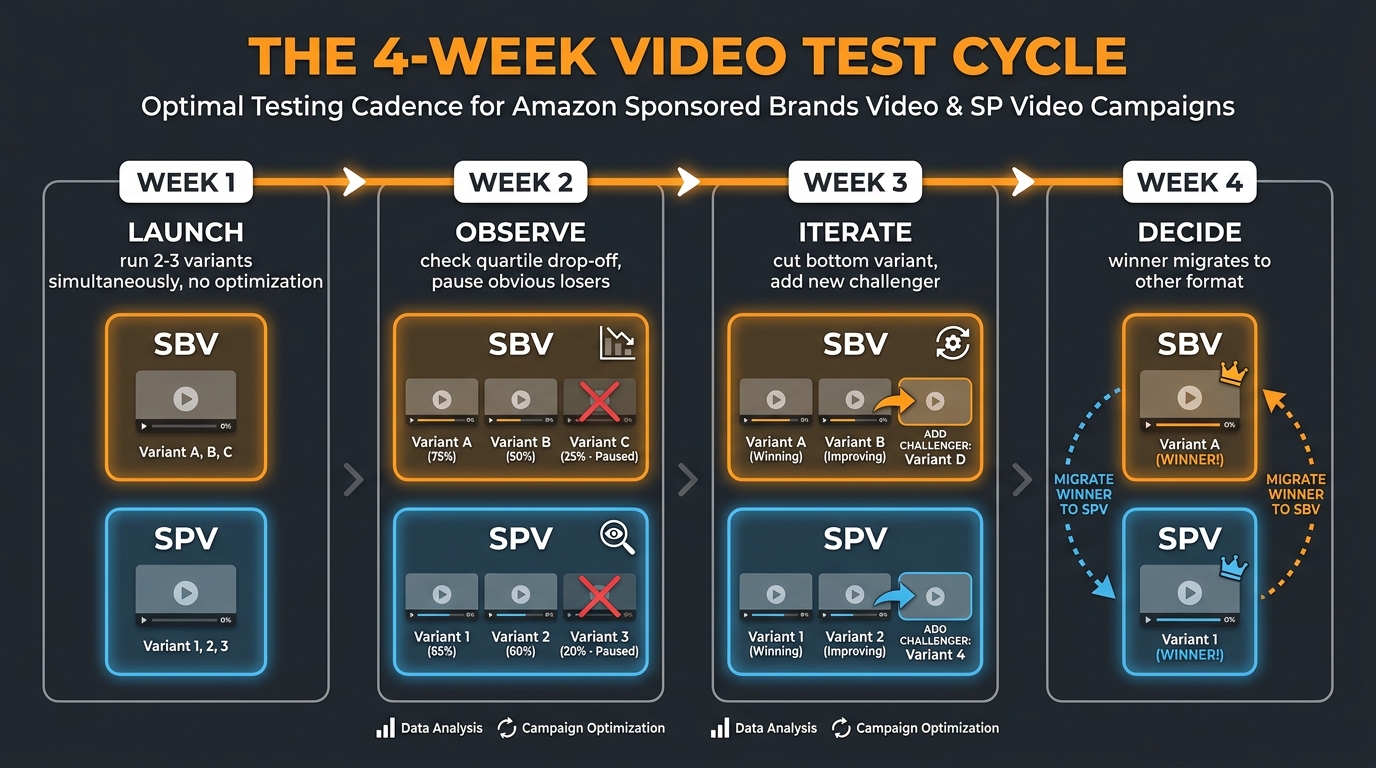
    The 4-Week Unified Test Cycle

    A four-week structure provides enough time to accumulate statistically useful data in both formats while keeping the creative iteration loop tight enough to make quarterly improvement possible.

    Week 1 — Launch and Let It Run: Launch all test variants simultaneously in both formats. Do not optimize, adjust bids, or pause any variant during week one. Your job in week one is to let the auction stabilize and accumulate enough impressions for the CTR and quartile data to start forming a reliable pattern. Resist the temptation to check results daily. One week of clean data is worth more than seven days of anxious intervention.

    Week 2 — Observe and Diagnose: At the end of week one, run a full quartile diagnostic on all variants in both formats. Look for any obvious losers: variants with Q1 view rates dramatically lower than others (indicating a broken hook) or variants with CTR more than 40% below the group mean. These can be paused in week two to free up budget for the remaining variants and accelerate the signal on the stronger creatives. Do not declare winners yet — only pause clear losers.

    Week 3 — Iterate: If you paused a clear loser in week two, use the 10% iteration reserve to introduce a new challenger creative that addresses the specific weakness the loser revealed. If the loser had a weak Q1 (bad hook), your new challenger should test a different hook approach. Week three runs the surviving original variants plus the new challenger.

    Week 4 — Decide and Migrate: By the end of week four, you should have sufficient data to declare a winner in each format. The winner in each format then becomes the new control going into the next test cycle. The winning SBV creative gets queued for migration to SPV (following the migration protocol described above), and vice versa. A new challenger is drafted for the next cycle’s test.

    Adjusting Cadence for Budget and Category

    The four-week cycle assumes a moderate budget and a category with enough search volume to generate meaningful data within that window. In low-volume categories or with very small video budgets, a four-week window may not generate enough clicks per variant to support statistical conclusions — in which case, extend to six weeks and lower your “pause” threshold for clear losers accordingly.

    In high-volume categories with aggressive video budgets, data may be available faster — two weeks per cycle is achievable if each variant is generating 30+ clicks per day. Faster cycles mean more iterations per quarter, which compounds the creative learning advantage over time. The goal is always to match cycle length to the minimum time needed to generate statistically useful data, not to any arbitrary calendar convention.

    Day-of-Week and Seasonality Effects

    Always launch tests on the same day of the week across formats, and always compare full 7-day windows rather than partial weeks. Amazon shopping behavior shows significant day-of-week variation — weekday vs. weekend CTR and CVR patterns can swing by 20–30% in some categories. A test cell that launched Monday and ran through Friday versus one that ran Thursday through Wednesday has accumulated data from meaningfully different shopper populations. Standardize your test windows to eliminate this noise source before you start comparing variants.

    The Metrics Trap: Why Optimizing Each Format in Isolation Gives You the Wrong Answer

    The deepest problem with siloed video management isn’t inefficiency — it’s misattribution. When SBV and SPV are managed separately with separate success metrics, you will systematically misattribute performance that is actually the result of both formats working together to the format that happened to be visible at the moment of purchase.

    The Halo Effect Between Formats

    A shopper who sees your SBV on a branded keyword query, watches 70% of the video, and doesn’t click — but then two days later clicks your SPV and purchases — is a conversion that SPV gets credit for. The ACoS looks great for SPV. SBV looks like it generated no return on that shopper. But the SBV view was the reason the shopper recognized your brand when the SPV appeared, which is the reason they clicked rather than scrolling to a competitor.

    This halo effect is real and documented in multi-touch attribution studies across retail media. Amazon’s own view-through attribution gives some credit to upper-funnel video views (especially in DSP), but within the Sponsored Ads console, this attribution is limited. The practical implication is that SBV’s true contribution is systematically understated when you measure it against a last-click attribution model, and SPV’s contribution is systematically overstated.

    The Isolation Optimization Trap

    When you optimize SBV in isolation and see weak direct ROAS, you underinvest in it. When you scale back SBV, you remove the awareness and brand-memory building that was helping your SPV convert at the rate it was. Then SPV ROAS starts declining — but because the connection to SBV is invisible in your reporting, you misattribute the SPV decline to creative wear-out, keyword competition, or listing quality. You chase the wrong fix.

    The unified testing program helps here in a specific way: when you’re running the same creative in both formats simultaneously, and when you track NTB% in SBV alongside CVR in SPV, you can start to see the relationship. Periods when your SBV is driving strong NTB% tend to correlate (with a lag of 1–3 weeks) with SPV conversion rate improvement. This correlation isn’t perfect and isn’t easy to see in a small dataset, but over multiple test cycles it becomes a visible pattern that should inform how you weight each format’s success metrics.

    The Right Success Metric for Each Format — and the Meta-Metric That Bridges Them

    In a unified testing program, each format retains its own primary success metric: SBV is primarily measured on NTB%, branded search lift, and view-through traffic (traffic to your Store or PDP that came from SBV views without a direct click). SPV is primarily measured on CVR, ACoS, and contribution margin per click.

    The meta-metric that bridges the two is combined video ROAS — total revenue attributable to video advertising (including SBV view-through conversions) divided by total video ad spend across both formats. This metric forces you to look at video as a single channel rather than two separate line items. It makes the tradeoffs visible: if you cut SBV to improve the combined ROAS short-term but sacrifice NTB% in the process, the combined ROAS will start declining 3–4 weeks later as the SPV conversion rate softens. The metric creates accountability for the full funnel, not just the last click.

    Building a Perpetual Video Learning Engine

    The perpetual video learning engine flywheel: create, launch, measure, migrate, iterate — SBV and SPV feeding each other

    The premise of a unified testing playbook isn’t that you run one test and discover the optimal video creative forever. Video creative has a shelf life. Shopper attention patterns shift. Amazon’s auction dynamics change. Category competition evolves. What works in Q1 2026 may be overtaken by the Q3 creative you haven’t produced yet.

    The goal is to build a learning engine that continuously generates, tests, migrates, and iterates creative — using both SBV and SPV as input channels rather than treating either format as a destination where creative goes to retire.

    The Five-Step Perpetual Loop

    The engine has five steps that repeat on a rolling cycle:

    1. Create: Generate 2–3 new creative variants targeting a specific layer of the creative stack (hook, demo, or CTA). These should be informed by the quartile data from the previous test cycle — specifically, which layer showed the largest drop-off in the losing variants. New creative addresses that specific weakness.
    2. Launch: Run the new variants simultaneously in both SBV and SPV with matched budgets and a defined test window. Document the hypothesis for each variant before launch: “We believe a benefit-lead hook will outperform the current product-first hook in SBV because our Q1 drop-off data suggests viewers aren’t retaining through to the product demo.”
    3. Measure: At the end of the test window, pull the complete signal stack: Q1–Q4 quartile rates, CTR, CVR, NTB%, and contribution margin for both formats. Compare against the control. Identify the winner and the mechanism behind the win (which creative element drove the difference).
    4. Migrate: Take the winner and test it in the other format following the migration protocol. Adapt for context where necessary. Run the migration as a new test, not a deployment.
    5. Iterate: The losing variants don’t get discarded — they get diagnosed. Which layer failed? What does the quartile data say about where the viewer lost interest? The losing creative’s failure diagnostic becomes the creative brief for the next cycle’s challenger.

    Compounding Creative Intelligence Over Time

    After four or five test cycles — roughly four to six months of disciplined execution — you will have accumulated something more valuable than a winning creative: a category-specific map of which creative principles work at which funnel stage for your specific product and shopper. This map is built from your own data, with your actual ASINs, in your actual competitive context. It’s not borrowed from a best-practices guide — it’s the proprietary creative intelligence of your advertising program.

    This is the real advantage of a unified testing approach: the learning compounds. Each cycle builds on the one before it. SBV insights inform SPV hypotheses. SPV data confirms or challenges SBV findings. The formats stop being two separate line items and become two measurement instruments reading the same creative reality from different angles.

    Practical Starting Point: What to Do in the Next Two Weeks

    If you’re running SBV and SPV separately today and want to move toward a unified program, the minimum viable first step is simpler than a full framework overhaul. In the next two weeks, do three things:

    • Standardize your naming convention. Rename your SBV and SPV campaigns so that the creative variant name is identical when the same video appears in both. This is the data infrastructure that makes cross-format comparison possible. It costs nothing and takes an afternoon.
    • Build a shared creative metrics dashboard. Pull CTR, completion rate, and quartile data from both SBV and SPV into a single view — a shared spreadsheet, a BI tool, whatever you have. The goal is to see both formats’ creative data side by side, not in separate reports.
    • Run your first unified hook test. Take your current best-performing SBV video and your current best-performing SPV video. If they’re different videos, identify which one has the stronger first-three-seconds and test it as a challenger creative in the other format. This single test will tell you more about your video’s transferability than months of separate optimization ever could.

    The compounding advantages of a unified video testing program don’t require a full infrastructure overhaul to start generating returns. They require a different mental model — one that treats SBV and SPV not as two channels to manage, but as two windows into the same creative truth about your product and your shopper.

    Once you see them that way, running two separate programs stops making sense. And the learning velocity on the other side of that shift is worth more than any individual creative win.