There’s a moment most automation-heavy teams eventually hit. Nobody schedules it. Nobody plans for it. But it arrives with quiet violence: a critical workflow breaks at 2 a.m., nobody knows who owns it, the Zap has seventeen steps, three of them are undocumented API calls, and the person who built it left the company eight months ago.
This is Zap Hell. And in 2026, it’s no longer just a productivity inconvenience — it’s an architectural liability. Because now those same tangled automation chains aren’t just connecting a CRM to a spreadsheet. They’re routing decisions made by AI agents, triggering language model calls, and executing actions that affect real customers in real time.
The stakes of getting workflow architecture wrong have risen dramatically. Yet the design patterns most teams are using haven’t evolved at the same pace. They’re still bolting AI steps onto automation chains designed for a simpler era — one app triggering another, one webhook calling a function — and wondering why everything feels fragile, expensive to maintain, and impossible to debug.
This piece is about the structural shift that needs to happen: moving from point-to-point automation chains to a properly layered orchestration architecture. Not a tool recommendation list. Not a vendor pitch. A genuine rethinking of how workflows should be designed, owned, and operated when AI is involved.
We’ll cover how to diagnose what you have, why the old model breaks under AI workloads, what a three-layer architecture actually looks like in practice, how to choose the right tools for each tier, and how to migrate without blowing up what’s already working. Let’s start with the diagnosis.
What “Zap Hell” Actually Looks Like — and Why Most Teams Don’t See It Coming

Zap Hell doesn’t arrive fully formed. It compounds incrementally, which is precisely what makes it so dangerous. The first Zap someone builds is always elegant. A new lead hits the CRM, a notification fires in Slack, a row gets added to a spreadsheet. Clean. Fast. Satisfying. Then, six months later, that same lead trigger also needs to update a Notion database, fire a webhook to a marketing tool, and now — because the team added an AI assistant — generate a personalized outreach email via GPT-4o before any of that happens.
Nobody redesigned the architecture. They just added steps. And then added more.
The Compounding Symptoms
By the time most teams recognize they’re in Zap Hell, the symptoms are already severe. Here’s what the pattern typically looks like across organizations at the point of recognition:
- Single-owner concentration: A significant portion of mission-critical automation is owned by one or two people. When they’re unavailable, the workflow is effectively a black box. Nobody else knows why certain steps exist, what the failure conditions are, or what downstream systems depend on the output.
- Silent failure as the default state: Zapier and most lightweight automation tools are not designed to surface non-fatal errors loudly. If an AI step returns a malformed response that still technically “succeeds” — wrong format, truncated output, off-context reasoning — the Zap continues and nobody knows. The data corruption happens silently.
- Depth without documentation: Workflows routinely reach ten, fifteen, even twenty sequential steps. Each step was logical at the time of addition, but there is no written rationale for the chain. When something breaks at step fourteen, the diagnostic process becomes archaeological.
- Sprawl across accounts and workspaces: Across a mid-sized organization, automation tools proliferate across departments. Marketing has its own Zapier account. Sales has another. An ops manager built a completely separate Make.com workspace. These systems overlap, duplicate each other, and sometimes conflict — and nobody has a map of what exists where.
- Cost opacity: Task-based pricing models (where every action step in every workflow run counts as a billable task) make it nearly impossible to forecast costs as AI steps multiply. A single AI-augmented workflow that runs thousands of times per month can generate enormous task counts, and most teams have no visibility into this until the invoice arrives.
The AI Amplification Problem
All of these symptoms existed before AI entered the automation stack. But AI workloads amplify every one of them. An LLM call inside a workflow isn’t just another action step — it introduces non-determinism, latency variance, token cost, and semantic error potential that no trigger-action automation tool was designed to handle gracefully.
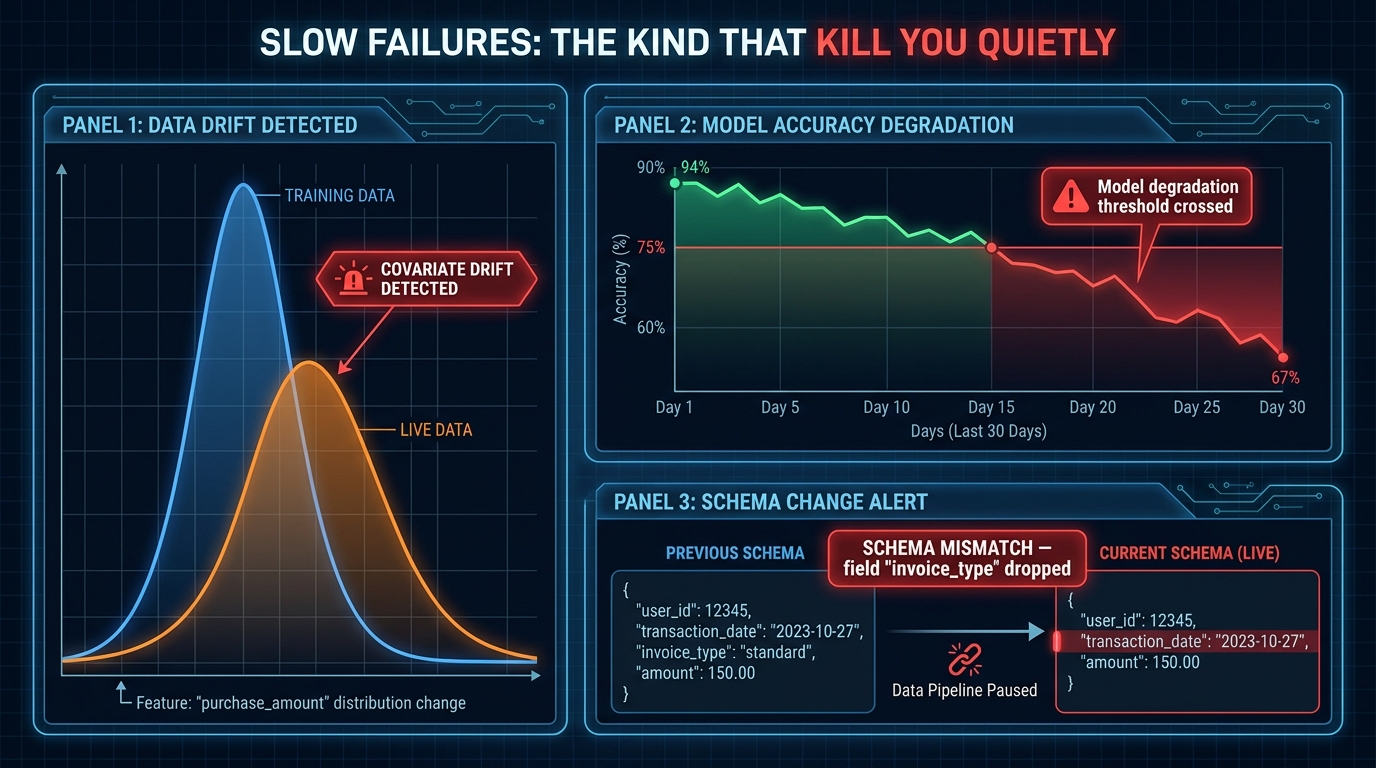
When a Zapier step calls OpenAI and the model returns a response that’s technically a 200 OK but semantically useless — a hallucinated data field, a misunderstood instruction, an output in the wrong schema — the workflow continues. It doesn’t retry with a different prompt. It doesn’t flag the anomaly. It passes the bad output downstream, where it either causes a visible failure several steps later or, worse, silently corrupts a record that gets used in a business decision.
According to a 2026 HFS Research and Unqork survey, 43% of enterprises expect AI to generate new forms of technical debt, and 50% cite legacy integration complexity as a top concern. The same research found that most organizations spend two to seven times their software license cost on implementation and integration overhead. That ratio gets significantly worse when the workflows being maintained are tangled automation chains with embedded AI steps and no observability layer.
The problem is structural. Which means the solution has to be structural too.
Why Point-to-Point Automation Fails Under AI Workloads
To understand why the architectural shift matters, it helps to be precise about what point-to-point automation is actually doing — and where its design assumptions break down.
The trigger-action model that powers Zapier, Make, and similar tools is fundamentally a linear event-driven pipeline. Something happens (the trigger), a series of predetermined steps execute in sequence, and a final output is produced. This model is brilliant for deterministic, predictable operations: “When a form is submitted, create a CRM record, send a confirmation email, and notify Slack.” Each step’s inputs and outputs are known in advance. Failures are usually binary — either an API call succeeds or it doesn’t.
Where the Model Breaks
AI workloads violate nearly every assumption that makes this model elegant:
Non-determinism. LLMs don’t always return the same output for the same input. Temperature settings, model versioning, API provider changes, and context window variations all introduce variance. A workflow that works perfectly today may produce subtly different outputs tomorrow without any code change. Linear automation chains have no mechanism for detecting or handling this drift.
Long-running execution. AI agents don’t complete tasks in milliseconds. A workflow that involves a research agent browsing the web, synthesizing content, and writing a structured report might run for several minutes — or longer. Zapier’s design assumes steps complete quickly. Long-running tasks hit timeout limits, lose state on failure, and have no checkpoint mechanism to resume from the point of interruption.
Conditional complexity. Real AI workflows aren’t straight lines. They branch. An AI agent might determine that the input data requires a different processing path, that a human needs to review an ambiguous case, or that a prior step needs to be retried with different parameters. Linear pipelines can only handle this with increasingly convoluted conditional logic — the automation equivalent of deeply nested if-else statements.
State loss on failure. In a traditional Zapier chain, if step eight fails, the workflow stops. Any intermediate state generated by steps one through seven is effectively discarded. The next run starts from scratch. For a simple five-step automation, this is manageable. For a multi-agent workflow that has already made three API calls, generated two documents, and updated a database record, losing all of that progress on a single downstream failure is both costly and potentially dangerous.
No governance primitives. Who can modify a workflow? Who needs to approve a change? What happens if an agent takes an action that crosses a compliance boundary? Lightweight automation tools were not built with enterprise governance in mind. They optimize for creation speed, not operational control.
The Scale Ceiling
These limitations stay manageable at small scale. A team with twenty Zaps can survive Zap Hell through heroic individual effort and tribal knowledge. A team with two hundred Zaps — many of them incorporating AI steps, multi-step agent chains, and connections to sensitive systems — cannot. The complexity compounds faster than human memory can track it, and the blast radius of any single failure expands with every additional workflow in the ecosystem.
According to current industry reporting, 57% of organizations now have AI agents running in production, but observability is consistently rated as the lowest-performing part of their AI engineering stack. They’ve shipped the agents but not built the infrastructure to watch them. That combination is precisely what turns manageable automation into something that fails unpredictably and expensively at scale.
The Three-Layer Architecture That Replaces Spaghetti Flows

The architectural shift that’s emerging across mature engineering teams in 2026 isn’t about replacing every tool you have. It’s about clearly separating concerns into distinct layers — and using different tools for each layer based on what that layer actually needs to do well.
The model that’s proving most durable is a three-tier stack:
Layer 1: The Trigger and Integration Layer
This is the entry point for events and the connector to external systems. It’s where Zapier, Make, n8n, and similar tools belong. This layer handles SaaS connectivity, webhook reception, scheduled triggers, and straightforward data transformation between systems. It is deliberately kept thin — its job is to receive signals and route them to the orchestration layer, not to contain business logic or AI reasoning.
The critical discipline here is not overloading this layer. If you’re doing meaningful processing, decision-making, or AI calls inside a Zapier chain, you’ve already crossed the boundary into territory that belongs in layer two. Keep the integration layer responsible for connectivity and event dispatch only.
Layer 2: The Orchestration Engine
This is the brain of the system. It receives events from the trigger layer, manages workflow state, handles routing and branching logic, coordinates agent calls, manages retries and error recovery, and enforces governance rules. The orchestration layer knows where a workflow is in its execution, what has already happened, and what needs to happen next — even if the process is interrupted and resumed hours later.
Tools that belong in this layer include Temporal and Apache Airflow for durable, long-running workflow orchestration; LangGraph for AI-specific stateful agent orchestration; and Prefect or Dagster for data pipeline orchestration. The common characteristic is that they all provide explicit state management, checkpoint and retry capabilities, and visibility into what’s happening inside a running workflow.
Layer 3: The Execution Workers
This is where work actually gets done — AI agent calls, LLM inference, RPA bot actions, external API requests, database writes. Execution workers are discrete, composable units that do one thing well and report their results back to the orchestration layer. They don’t make routing decisions. They don’t manage state. They execute a task, return a structured result, and wait for the next instruction.
This separation is what makes the architecture resilient. If an execution worker fails, the orchestration engine knows exactly where in the workflow the failure occurred, can apply retry logic, can route to a fallback worker, or can surface a human-in-the-loop decision — without losing any of the progress that came before.
Why the Separation Matters in Practice
The three-layer model creates something the trigger-action model fundamentally lacks: a single source of truth for workflow state. At any point in time, you can query the orchestration layer and see exactly what every active workflow is doing, where it is in its execution, what inputs it received, and what outputs it has produced so far. This is the architectural foundation that makes debugging, auditing, governance, and iterative improvement possible.
Without it, you’re operating blind — managing a fleet of autonomous processes with no control tower.
Auditing What You Have: The Automation Inventory Method
Before you can restructure your workflow architecture, you need an honest picture of what you’re actually running. Most teams that attempt to modernize their automation stack underestimate how much exists, how distributed it is, and how poorly documented it is. A structured audit is not optional — it’s the foundation everything else builds on.
Step 1: Full Landscape Discovery
Start by identifying every automation tool in use across the organization. This isn’t just the official company Zapier account — it includes individual accounts, free-tier Make.com workspaces, team-specific n8n instances, any custom webhook infrastructure, and any AI tool with built-in automation features. Treat this like a shadow-IT discovery exercise, because that’s effectively what it is.
For each tool, export or list every active workflow. Capture: the workflow name, the owner (if known), the trigger type, the number of steps, the external systems connected, the approximate run frequency, and whether there are any documented error handling rules. Even partial information is valuable at this stage — gaps in the data are themselves diagnostic signals.
Step 2: Classification by Risk and Criticality
Not every workflow needs the same treatment. A Zap that sends a birthday notification to a Slack channel is very different from a Zap that processes customer refund requests or routes AI-generated responses to support tickets. Once you have the inventory, classify each workflow across two dimensions:
- Business criticality: What happens if this breaks? Is it a minor inconvenience or a customer-facing failure? Does it affect revenue, compliance, or data integrity?
- Complexity and brittleness: How many steps does it have? How many external dependencies? Does it include AI steps? Is there any error handling? Is it documented?
Workflows that are high criticality and high complexity get immediate architectural attention. Workflows that are low criticality and low complexity can remain as-is with basic governance applied. The middle quadrants require judgment calls based on trajectory — is a workflow likely to grow in complexity over the next six months?
Step 3: Identify Concentration Risks
Map every workflow to its owner. You’re looking for concentration — workflows where a single person is the only one who understands the design and can perform maintenance. Any critical workflow with a single point of human knowledge is a ticking clock. When that person takes leave, changes roles, or leaves the company, the workflow effectively becomes unmaintainable without reverse engineering.
Document this honestly. The goal is not to blame individuals for building things without documentation — in most cases, they were moving fast and building useful tools under time pressure. The goal is to surface the systemic risk so it can be addressed deliberately.
Step 4: Cost and Performance Baselining
Pull billing data for all automation tools and calculate the cost per workflow where possible. For task-priced tools, identify which workflows are consuming the most tasks and whether the cost is proportionate to the business value they deliver. Flag any workflows that include LLM calls — these tend to be dramatically more expensive per run than pure integration workflows, and the costs can grow non-linearly as usage scales.
This baseline will be essential when making the case for architectural investment. The hidden cost of maintaining fragile, undocumented automation is real and significant — the HFS/Unqork research finding that organizations spend two to seven times their license costs on implementation and integration overhead is consistent with what teams find when they actually model the true cost of their automation sprawl.
Choosing the Right Tool for Each Layer

The three-layer architecture is tool-agnostic in principle. In practice, different tools are genuinely better suited for different layers, and making the wrong assignment creates its own problems. Here’s how the current landscape maps to each tier.
Trigger and Integration Layer: Zapier, Make, n8n
Zapier remains the strongest option for non-technical teams that need fast SaaS connectivity. Its library of pre-built connectors is unmatched, and its interface allows non-engineers to create working integrations in minutes. The key architectural discipline is treating it as a dumb pipe — use it for event capture and simple routing, not for logic or AI reasoning. Zapier’s per-task pricing model makes it expensive at scale, so monitor consumption carefully and consider whether high-frequency workflows should live elsewhere.
Make (formerly Integromat) offers more visual logic and branching capability than Zapier, making it a reasonable choice for moderately complex integration scenarios. Its pricing model is more predictable for high-volume workflows, and its scenario design interface supports conditional paths more naturally than Zapier’s linear Zap structure.
n8n sits at the boundary between the integration layer and light orchestration. Its self-hosted deployment model gives engineering teams full control over data residency, security, and customization. It has native AI node support, handles more complex branching logic than Zapier or Make, and can be meaningfully cheaper at scale due to its node-based (rather than task-based) pricing. For technical teams that want more control without jumping all the way to a durable workflow engine, n8n is often the most pragmatic choice.
Orchestration Engine Layer: Temporal, Airflow, Prefect, Dagster
Temporal has become the default recommendation for teams that need durable workflow execution — meaning workflows that can run for minutes, hours, or days without losing state if the underlying infrastructure is interrupted. Temporal’s core concept is that workflow code is itself the state machine: it’s replayed from an event history log, which means a workflow can be resumed from any point after a failure without any data loss. This makes it exceptionally well-suited for AI workflows that involve long-running agent tasks, external API dependencies with variable latency, and multi-step processes where partial completion needs to be preserved.
Apache Airflow remains the most widely deployed workflow orchestration tool in data engineering, and it’s a strong choice for workflows that look more like data pipelines — scheduled batch processes, ETL operations, ML training pipelines. Its Directed Acyclic Graph (DAG) model is well-understood, and its ecosystem of operators covers most common integration needs. Where Airflow falls short is in dynamic, event-driven workflows and real-time agent orchestration — it was designed for scheduled batch execution, not reactive event handling.
Prefect and Dagster offer more modern developer experiences than Airflow, with better support for dynamic workflows, stronger observability tooling, and less operational overhead. Both are strong choices for teams that want the control of a proper orchestration engine without Airflow’s maintenance complexity.
AI Agent Orchestration Layer: LangGraph, CrewAI, AutoGen
For workflows that are primarily about coordinating AI agents — rather than integrating SaaS applications or running data pipelines — a specialized AI orchestration framework becomes necessary. These tools understand the specific primitives of LLM-based systems: prompt management, tool calling, agent memory, multi-turn reasoning, and human-in-the-loop interruption.
LangGraph has emerged as the dominant choice for production multi-agent orchestration in 2026. Its graph-based state machine model gives engineers explicit control over workflow structure, conditional routing, and state persistence. In practice, LangGraph functions as the “workflow OS” — the control plane that decides what each agent does next, based on the current workflow state. It integrates natively with LangSmith for tracing and evaluation, which matters significantly for production reliability.
CrewAI excels at defining role-based agent teams that collaborate on shared tasks. Rather than specifying workflow logic explicitly, CrewAI lets you define a crew of agents with distinct roles, tools, and goal orientations, and coordinates their interaction. The emerging 2026 pattern is to use LangGraph as the top-level orchestrator and embed CrewAI crews as execution nodes within that graph — combining LangGraph’s structural rigor with CrewAI’s flexibility for dynamic role-based work.
Microsoft AutoGen is increasingly relevant for scenarios that require dynamic agent-to-agent conversation and collaborative problem-solving, particularly in enterprise Microsoft environments. Its conversation-centric model differs from LangGraph’s state machine approach — it’s better for open-ended multi-agent dialogue and worse for deterministic, step-by-step workflows.
Building Durable Workflows: State, Retries, and Error Recovery
The single biggest functional difference between a trigger-action automation chain and a properly orchestrated workflow is how each handles failure. In a Zap chain, failure at any step means the workflow stops and the run is marked as errored. What happened before the failure may or may not be captured, and restarting typically means starting over from the beginning. In a durable workflow, failure at any step is a manageable event — the orchestration engine knows exactly what state the workflow was in, can apply configurable retry logic, and can resume from the point of failure once the underlying problem is resolved.
What State Management Actually Means
State management in orchestrated workflows means maintaining a persistent record of everything that has happened in a workflow execution. This record includes: what steps have completed, what data was produced at each step, what the current step is, and what steps remain. This record is stored externally from the workflow execution process, so it survives infrastructure failures, process restarts, and deployment updates.
For AI workflows, state management has additional dimensions. An agent workflow might need to track: the conversation history passed to each LLM call, the tool call results returned by each function call, the intermediate reasoning steps produced by chain-of-thought prompting, and any human-in-the-loop decisions made during the workflow. Without persistent state tracking, each failure or interruption requires reconstructing this entire context from scratch — which is both expensive (in terms of LLM token costs and latency) and often impossible (because intermediate states can’t be deterministically recreated).
Retry Design Patterns for AI Workflows
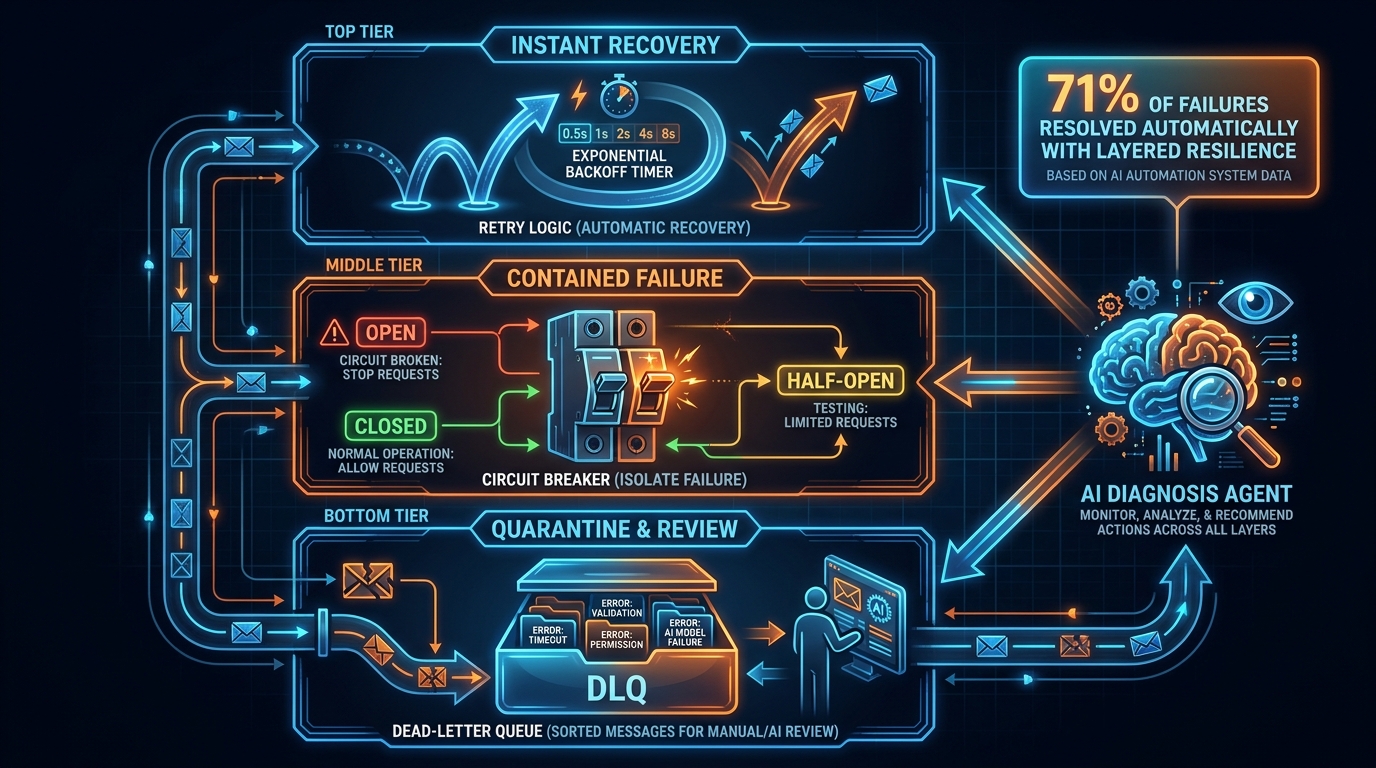
Not all retries are equal. For deterministic API calls, a simple exponential backoff retry with a maximum attempt count is usually sufficient. For LLM calls, retry strategy needs to account for the specific failure mode:
- Rate limit errors (HTTP 429): Retry with exponential backoff after the Retry-After header interval. These are transient and almost always resolve on retry.
- Timeout errors: Retry with extended timeout, potentially with a simplified prompt if the failure may be related to input complexity.
- Schema validation failures: Retry with a structured output enforcement prompt, potentially switching to a model with stronger instruction-following characteristics.
- Semantic errors (output is technically valid but contextually wrong): These require human-in-the-loop intervention or a fallback logic path — they cannot be resolved by simply retrying the same call.
The category of semantic error is particularly important because it’s the one that traditional monitoring systems completely miss. A workflow that returns a 200 OK with output that’s factually incorrect, off-topic, or in the wrong format will not trigger any alert in a system that only monitors for exceptions. This is why semantic validation — checking the content and structure of AI outputs, not just their HTTP status — needs to be built into the orchestration layer as a first-class concern.
Circuit Breakers and Fallback Paths
For production AI workflows, retry logic alone is insufficient. You also need circuit breakers — mechanisms that detect when a dependency (an LLM API, an external service, an internal function) is consistently failing and automatically route around it, rather than hammering it with retries until it recovers.
In practice, this means designing explicit fallback paths for every critical workflow step. If the primary LLM provider is experiencing degraded performance, the fallback might be a different model, a cached response, a simplified heuristic, or a human-in-the-loop request. The specific fallback strategy matters less than the existence of one — workflows that have no fallback path are fragile by design, regardless of how robust their retry logic is.
Observability Is Not Optional: Tracing AI Flows in Production

The 2026 industry consensus on AI workflow observability is stark: traditional application performance monitoring (APM) is fundamentally insufficient for AI agent systems. Standard APM tools track exceptions, latency, and resource utilization. They were built for systems where failures are binary — something either works or it doesn’t. AI workflows fail in a third way: they succeed at the infrastructure level while failing at the semantic level. A workflow that completes without errors but produces wrong, misleading, or harmful outputs is invisible to conventional monitoring.
The Three Layers of AI Workflow Observability
Mature teams are building observability stacks that operate across three distinct layers, each tracking different aspects of workflow behavior:
LLM Tracing Layer. Tools like LangSmith, Langfuse, and Braintrust provide visibility into individual LLM calls within a workflow. They capture the full prompt sent to the model, the complete response received, token counts, latency, model version, and any structured output validation results. This layer is essential for debugging prompt behavior, detecting prompt regressions when models are updated, and understanding token cost drivers.
Workflow Orchestration Layer. The orchestration engine itself provides visibility into workflow execution state — which steps completed, which are in progress, which are waiting for retry, and which have encountered errors. LangGraph’s built-in state inspection, Temporal’s workflow history viewer, and Airflow’s DAG run tracking all serve this function. This layer answers the question: “Where is this workflow in its execution?”
Infrastructure and Integration Layer. Standard APM tools (Datadog, New Relic, OpenTelemetry-based stacks) remain valuable for tracking the execution infrastructure — latency and error rates on API calls to external systems, resource utilization on worker services, and integration health across connected applications. This layer answers the question: “Is the system that’s supposed to run these workflows healthy?”
Practical Tracing Implementation
In practice, implementing useful observability for AI workflows requires explicit instrumentation — it doesn’t happen automatically. Every LLM call should emit a structured trace that includes the model name and version, the prompt template identifier (not just the filled prompt), the input token count, the output token count, the latency, and a structured output validation result.
Every workflow step should emit events when it starts, when it completes, when it retries, and when it fails — with enough contextual information attached that a developer can reconstruct exactly what happened and why, without needing to reproduce the original inputs.
Critically, AI workflow observability should include evaluation metrics, not just operational metrics. Run frequency, error rate, and latency tell you how the system is performing. Evaluation metrics — output quality scores, user feedback signals, downstream outcome tracking — tell you whether the system is accomplishing its purpose. Both are necessary for meaningful production oversight.
Alert Design for Non-Deterministic Systems
Setting meaningful alerts for AI workflows requires different thresholds than traditional software. You cannot alert on “output doesn’t match expected value” because outputs legitimately vary. Instead, alert on:
- Schema validation failure rate — when structured outputs fail validation above a baseline threshold, something has changed in the model or the prompt
- Token count anomalies — unexpected spikes in token usage often indicate prompt injection, infinite loops, or model behavior changes
- Latency percentile degradation — p95 and p99 latency trends indicate infrastructure problems before they become user-visible
- Retry rate elevation — when retry rates spike, a dependency is degrading before it fails outright
- Human-in-the-loop queue depth — when the queue of items waiting for human review grows, it indicates either increased volume or decreased agent confidence
Human-in-the-Loop: Where to Add Checkpoints Without Killing Speed
One of the most common mistakes teams make when designing orchestrated AI workflows is treating human-in-the-loop (HITL) as a binary choice: either the workflow is fully automated, or it isn’t. In reality, effective HITL design is about precisely calibrating where human judgment is needed and ensuring that human involvement at those points doesn’t become a bottleneck that negates the speed benefits of automation.
The Four HITL Patterns
There are four distinct patterns for incorporating human judgment into automated workflows, and they’re appropriate in different situations:
Approval Gates. The workflow pauses at a defined checkpoint and waits for explicit human approval before proceeding. This is appropriate for high-stakes, irreversible actions — sending a communication to a large audience, committing a significant financial transaction, publishing content that can’t be unpublished. The workflow holds state indefinitely until the approval arrives, which is only possible with a proper orchestration engine that supports durable execution.
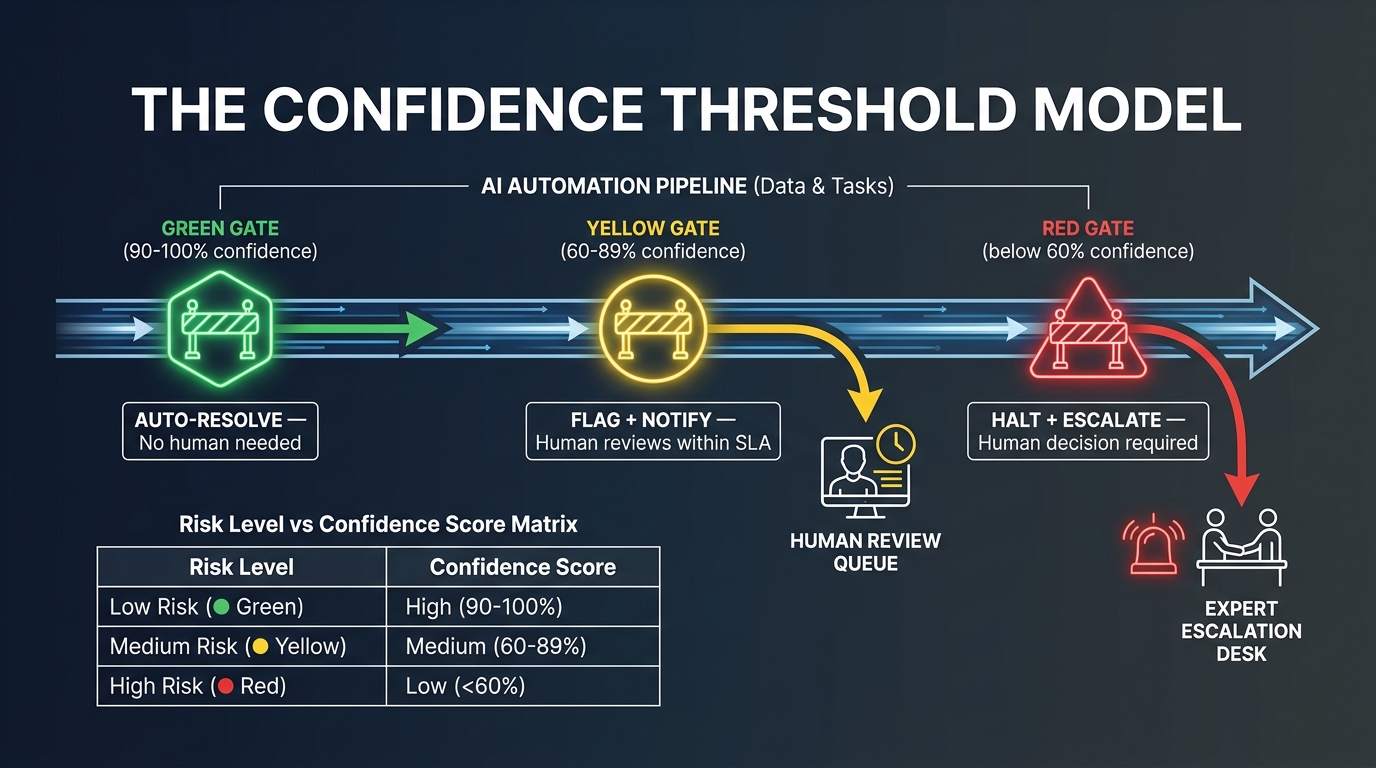
Exception Routing. The workflow runs autonomously for the vast majority of cases, but routes specific cases to human review when they exceed a confidence threshold or match a risk criteria. This is appropriate when 90% of cases are straightforward and can be handled automatically, but a meaningful minority require judgment that the AI system isn’t reliable enough to provide. The key design challenge is defining the routing criteria precisely enough that the “exception” bucket doesn’t expand to swallow all cases.
Review-and-Release. The workflow completes fully, but outputs are queued for human review before they’re released or acted upon. This is appropriate for content generation, data enrichment, and decision support workflows where the AI’s work is valuable but needs a final human check before it enters production systems. This pattern preserves workflow speed while adding a quality control layer.
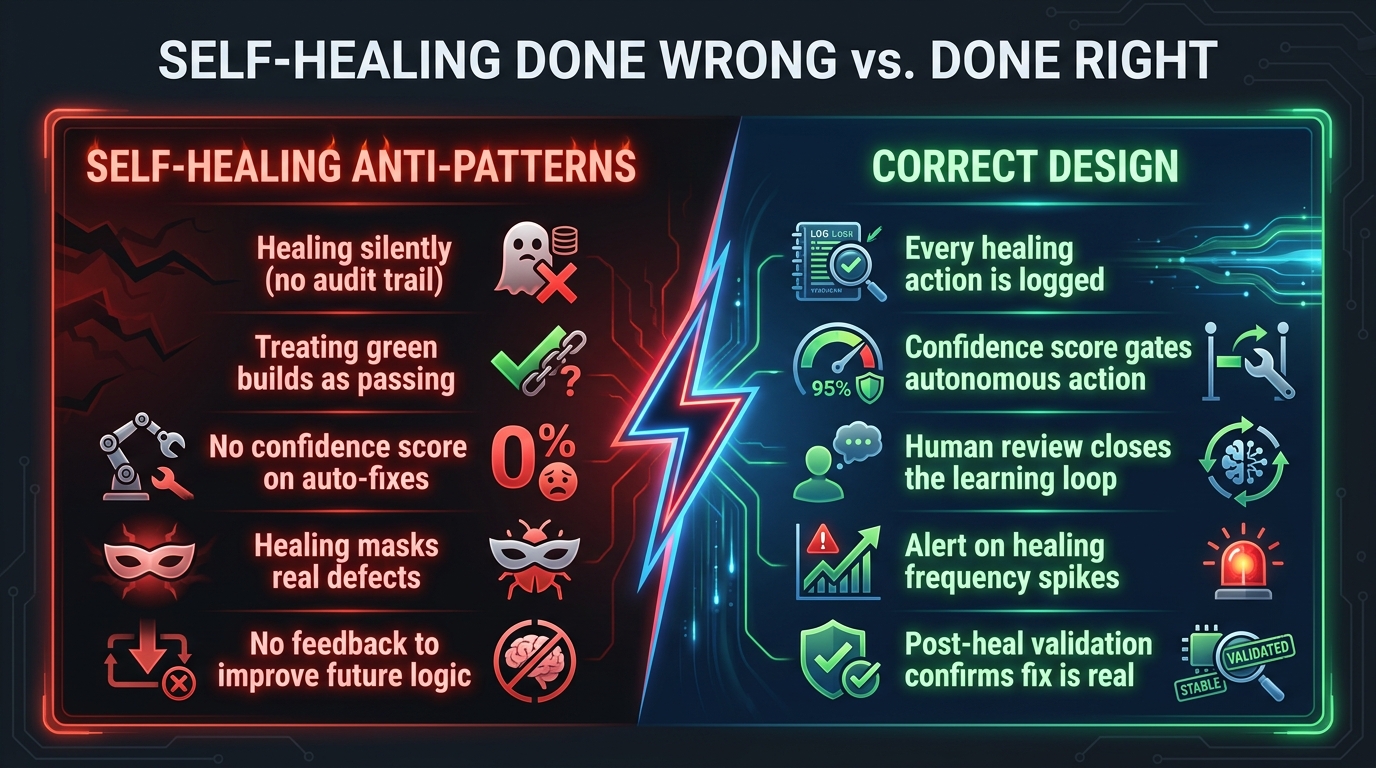
Feedback Loops. Human judgments made during workflow execution are captured and used to improve future workflow performance. This is less a pause mechanism and more an ongoing learning architecture — every human correction or override becomes training signal for prompt improvement, routing threshold adjustment, or model fine-tuning.
Designing for Asynchronous Human Involvement
The practical challenge with HITL workflows is that humans don’t respond instantaneously. An automated workflow can process a step in milliseconds; a human reviewing an AI output might take minutes, hours, or days. For the workflow to handle this gracefully, the orchestration layer needs to support asynchronous pause and resume — starting a task, emitting a notification to a human reviewer, and then waiting (while holding state) for the response to arrive.
This is precisely what durable execution engines like Temporal are designed for. A Temporal workflow can pause at a human-in-the-loop checkpoint for an arbitrarily long time, holding all of its state in the event history, and resume automatically when the human provides their input. This works even if the underlying server restarts, the code is deployed, or the orchestration engine itself is updated while the workflow is waiting.
Migration Patterns: Moving from Zap Chains to a Real Orchestration Layer

Architectural restructuring almost never happens as a clean cutover. Production systems need to keep running while the new architecture is built alongside them. The migration patterns that work in practice are incremental, risk-stratified, and built around clear criteria for when a workflow is ready to graduate from the old architecture to the new one.
Phase 1: Audit and Classify (Weeks 1–4)
Execute the automation inventory methodology described earlier. By the end of this phase, you should have a complete map of every workflow in the organization, classified by criticality and complexity, with ownership documented and cost baselines established. Don’t skip this phase in the interest of moving faster — teams that jump straight to rebuilding without a complete picture routinely discover halfway through that they’ve missed critical dependencies.
Define your migration criteria during this phase. A good set of criteria for promoting a workflow to the orchestration layer might be: the workflow includes one or more AI steps, OR the workflow has more than eight sequential steps, OR the workflow connects to a compliance-sensitive system, OR the workflow has no documented error handling, OR the workflow has experienced more than two unplanned failures in the past quarter.
Phase 2: Rebuild Priority Workflows (Weeks 5–10)
Start with two or three workflows from the high-criticality, high-complexity quadrant. These are your proof-of-concept cases — they have the most to gain from proper orchestration, and the experience of rebuilding them will surface the architectural patterns that apply across your specific stack.
The rebuild process for each workflow follows a consistent pattern. First, document the current workflow completely — every step, every dependency, every known failure mode, every downstream consumer of its output. Second, design the new workflow in the target architecture — what goes in the integration layer, what goes in the orchestration engine, what execution workers need to be built. Third, build and test in parallel with the existing workflow, not as a replacement. Run both versions simultaneously and compare outputs until confidence is established. Fourth, cut over with a rollback plan ready.
Resist the temptation to also redesign the workflow’s business logic during the rebuild. Architectural migration and logic redesign are two separate projects. Mixing them dramatically increases the risk of the migration and makes it harder to identify whether problems are architectural or functional.
Phase 3: Govern What Remains (Weeks 11–16)
Once high-priority workflows have been migrated, turn attention to governance of the remaining automation stack. This doesn’t mean migrating everything — many simple, low-risk workflows can remain as Zaps with appropriate governance applied. What governance means in practice:
- Every workflow has a documented owner responsible for maintenance and on-call response
- Every workflow touching sensitive data has access controls and audit logging enabled
- Modification of critical workflows requires a review and approval process (not just individual action)
- New workflows above a defined complexity threshold require architectural review before deployment
- A quarterly audit process reviews workflow inventory for drift, abandoned automations, and emerging sprawl
The goal of governance is not to slow down automation creation — it’s to create the conditions where automation can keep growing without becoming an unmanageable liability.
Governance, Ownership, and Preventing the Next Wave of Sprawl
The fundamental reason Zap Hell develops is not that people build bad automations. It’s that automation creation is treated as a purely tactical activity — something you do to solve an immediate problem — rather than a product or infrastructure activity that requires ongoing stewardship. The result is a landscape where nobody is responsible for the health of the overall system, only for the individual workflows they personally built.
The Automation Ownership Model
Every workflow in your ecosystem should have a defined owner. That owner is responsible for the workflow’s continued operation, maintenance, and eventual deprecation. But individual ownership alone is insufficient for critical workflows — you also need at least one secondary owner who understands the workflow well enough to maintain it independently. This is the automation equivalent of bus-factor reduction in software engineering: make sure no critical system has a single point of human knowledge.
For enterprises running significant automation volumes, a formalized automation center of excellence (CoE) is increasingly the governance structure of choice. The CoE doesn’t own all workflows — that would create a bottleneck — but it sets architectural standards, reviews new workflows above a complexity threshold, maintains the tooling and infrastructure that workflows run on, and owns the audit and governance process. Individual teams own their workflows; the CoE owns the ecosystem.
Access Controls and Policy Enforcement
Modern enterprise automation tools have invested significantly in access control capabilities. Zapier’s enterprise tier, for example, now supports app access policies (controlling which apps can be connected to which Zaps), action restrictions (limiting what types of actions specific users can configure), managed app connections (centralizing credential management rather than distributing it across individual user accounts), and log streaming to SIEM tools for security monitoring.
These controls are only useful if they’re actually configured and enforced. A common governance failure pattern is for enterprise tools to have robust access control capabilities that are never deployed because the initial setup was done by someone focused on functionality, not security. As part of your restructuring project, audit the access control configuration of every automation tool in your stack and bring it into alignment with your broader IT security policy.
Deprecation as a First-Class Practice
Workflow sprawl doesn’t just come from creating too many automations — it also comes from never removing the ones that are no longer needed. Outdated workflows that remain active are not just a maintenance burden; they’re a security risk (they hold live API credentials to systems they no longer need to access) and a cost center (they consume compute and task credits for work that provides no value).
Build deprecation reviews into your governance cadence. On a quarterly basis, review the full workflow inventory and flag any automation that hasn’t run in the past 90 days, any automation whose owner has left the organization, and any automation that duplicates functionality now provided by a newer workflow. Deactivate flagged workflows and schedule them for deletion unless an active owner identifies a reason to keep them.
Architecture Review for New Workflows
One of the most effective ways to prevent future sprawl is to embed governance at the point of creation rather than cleaning up afterward. For workflows above a defined complexity threshold — say, more than ten steps, or any workflow that includes an AI component — require a lightweight architecture review before deployment. This review doesn’t need to be a lengthy committee process; a thirty-minute conversation with a second engineer to confirm the design is sound, the ownership is clear, and the observability is adequate is often sufficient.
The value of this review is not just catching design problems — it’s ensuring that at least two people understand every critical workflow before it goes live. That alone dramatically reduces the concentration risk that leads to Zap Hell.
The Compounding Returns of Getting Architecture Right
The case for investing in workflow architecture restructuring is sometimes framed purely as risk reduction — you’re avoiding the disasters that Zap Hell eventually produces. That’s true, but it understates the opportunity. The more significant value of a properly layered orchestration architecture is what it enables that was simply impossible before.
Iteration Speed at Scale
When workflows have clear structure, documented ownership, proper observability, and explicit state management, the cost of changing them drops dramatically. You can modify a workflow step, deploy the change, and immediately see in your tracing tools whether the change improved or degraded performance. You can A/B test different prompt strategies within the same workflow by routing a percentage of executions to an experimental variant. You can refactor a workflow’s internal logic without fear of accidentally breaking a downstream dependency that nobody knew existed.
This is the architectural precondition for continuous improvement of AI workflows — and it’s not achievable with spaghetti automation chains.
Reusable Components Across Workflows
One of the quiet efficiency gains that comes with a layered architecture is the emergence of reusable execution workers. If you’ve built a well-designed AI agent that summarizes documents, that agent can be called by any workflow that needs document summarization — not just the specific workflow it was originally built for. The same applies to data validation functions, external API integrations, notification handlers, and countless other components.
In a Zap chain ecosystem, every workflow tends to rebuild functionality from scratch, because there’s no mechanism for sharing components. In an orchestrated architecture, reuse becomes natural — and every time a component is reused, the organization gets more value from the original investment in building it well.
Governance That Grows With You
The governance structures that a proper orchestration architecture makes possible are not just bureaucratic overhead — they’re what allows automation to scale without becoming a liability. The teams that have successfully scaled automation to hundreds of workflows with AI components aren’t doing it through heroic individual effort or careful manual coordination. They’re doing it through architectural discipline that keeps the complexity manageable as the system grows.
“The difference between an automation strategy that scales and one that collapses isn’t the tools you use — it’s whether you treat workflow infrastructure with the same engineering discipline you’d apply to any other production system.”
That discipline starts with recognizing that Zap Hell is not an inevitable consequence of moving fast. It’s a predictable consequence of treating automation as a collection of individual point solutions rather than as a system that needs architecture, ownership, and governance. The organizations that make that shift — from thinking about individual workflows to thinking about workflow infrastructure — are the ones that will be able to move fast at scale, rather than slowing to a crawl as complexity compounds.
Practical Takeaways for Teams Starting Today
If you’re reading this in the middle of an active Zap Hell situation, here’s where to start — in order:
- Run the inventory first. Don’t touch anything until you know what you have. One week of structured discovery prevents months of unintended consequences.
- Classify by criticality and complexity. Not everything needs the same treatment. Focus your architectural effort where the risk is highest.
- Pick one workflow to rebuild right. A single well-designed orchestrated workflow teaches more than any amount of theory. Build it, instrument it, run it in parallel with the old version, and observe the difference.
- Don’t migrate everything at once. Incremental, risk-stratified migration is the pattern that works. A big-bang replacement of your entire automation stack is a project that will either get canceled or cause catastrophic failures.
- Invest in observability from day one. The cost of adding tracing and monitoring to a workflow at build time is a fraction of the cost of debugging a production failure in an unobserved workflow.
- Make ownership explicit and durable. Every workflow needs an owner. Every critical workflow needs two. Write it down, review it quarterly, and update it when people change roles.
- Design the governance before the sprawl returns. Architecture reviews for complex new workflows, access control enforcement, and quarterly deprecation reviews are what prevent the next wave of Zap Hell before it starts.
The shift from Zap Hell to a genuine orchestration layer is not a one-time project. It’s a change in how your organization thinks about automation — from a collection of quick solutions to a strategic infrastructure capability. That change compounds over time. The teams that make it early will have a meaningful structural advantage over those that don’t, not because they have better tools, but because they have a system that can keep pace with the complexity of what they’re building.