Tag: Brand Registry

  • The Seller’s Scientific Method: How to Run Image A/B Tests in Manage Your Experiments That Actually Mean Something

    The Seller’s Scientific Method: How to Run Image A/B Tests in Manage Your Experiments That Actually Mean Something

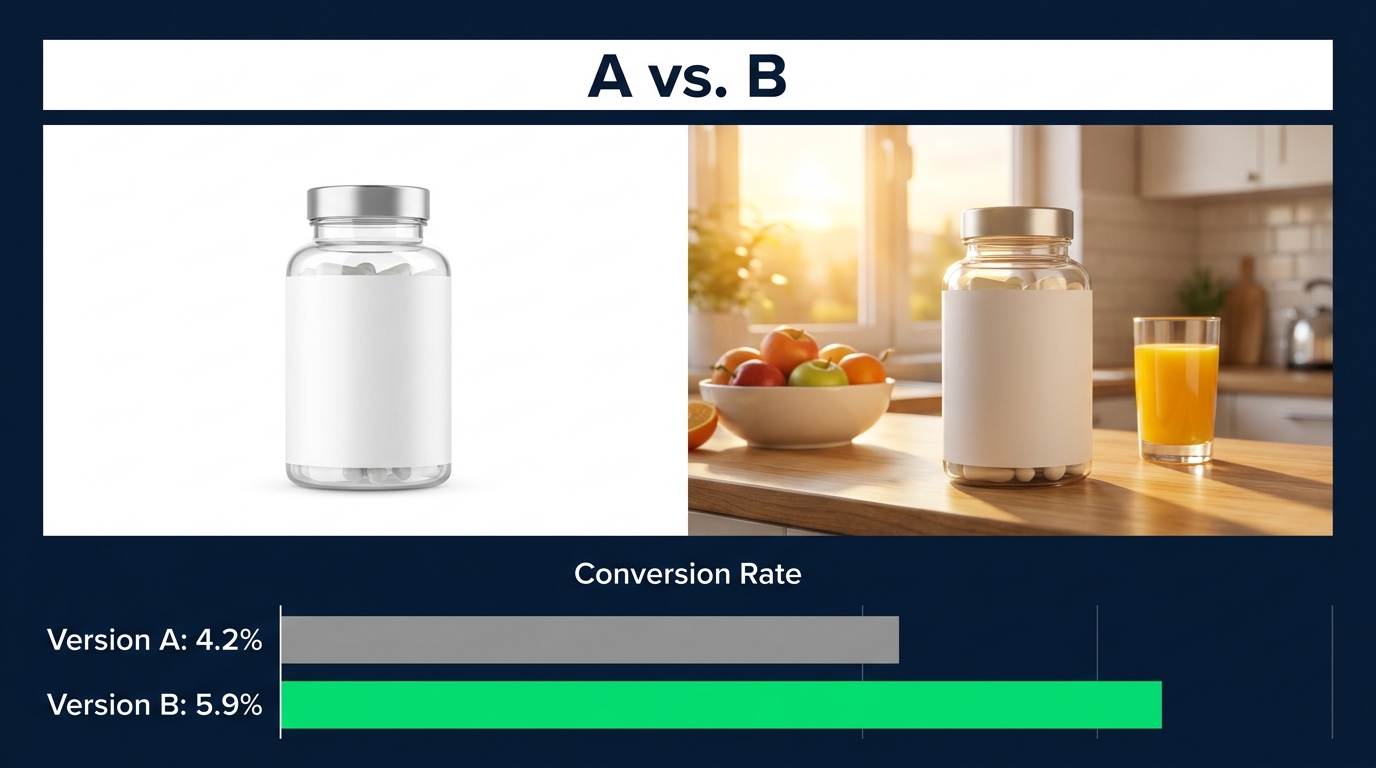
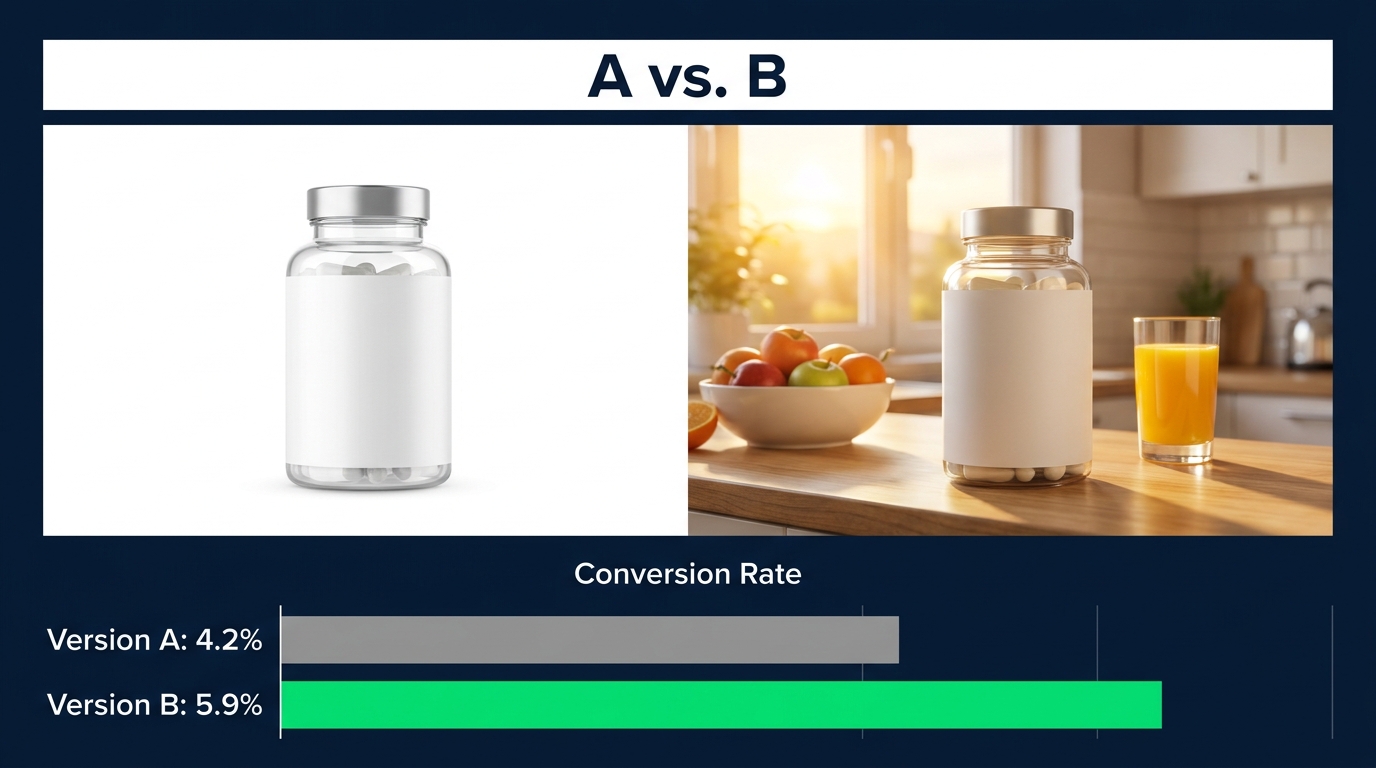
    Split-screen Amazon product image A/B test showing Version A white-background vs Version B lifestyle photo with conversion rate comparison bar chart

    Most Amazon sellers who run image experiments through Manage Your Experiments believe they’re doing science. They pick two photos, set a duration, watch the dashboard, and declare a winner. What they’re actually doing, in the vast majority of cases, is running an expensive opinion poll dressed up in data clothing.

    The difference between a test that produces a reliable, actionable insight and one that produces noise you act on anyway comes down to a handful of decisions made before the experiment launches. Hypothesis structure, variable isolation, traffic thresholds, duration discipline, and result interpretation — get those right, and a single image test can deliver a 10–25% conversion lift that holds. Get them wrong, and you’ll publish a “winner” that quietly underperforms for the next twelve months while you wonder what happened.

    This post is not a basic walkthrough of the Manage Your Experiments interface. It’s a discipline guide for using it correctly. We’re going to cover how the tool actually works under the hood, what eligibility really means in practice, how to design experiments that isolate signal from noise, how to read results without fooling yourself, and how to build a testing cadence that compounds over time. By the end, you’ll have a framework for turning image testing from a one-off tactic into a permanent, measurable competitive advantage.

    What Manage Your Experiments Actually Does Under the Hood
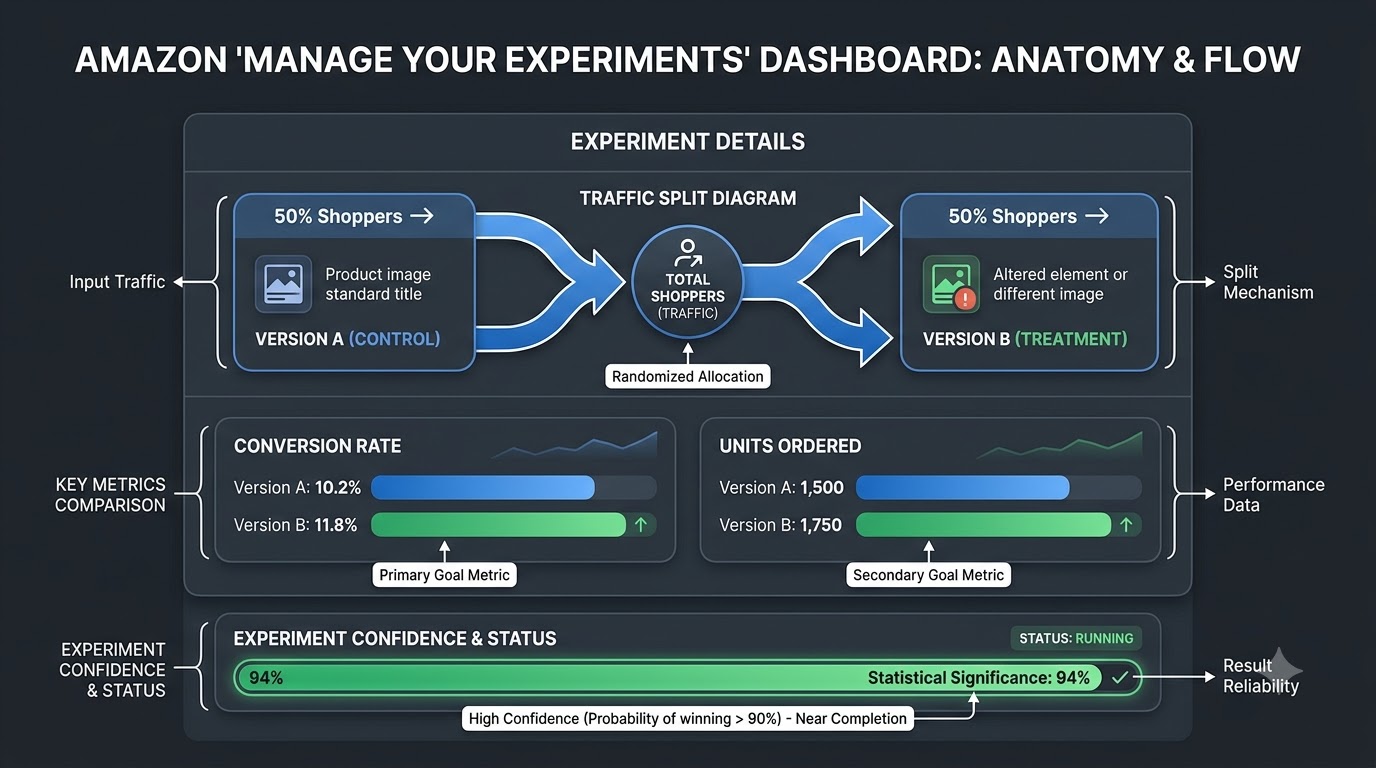
    Infographic showing Amazon Manage Your Experiments dashboard anatomy with 50/50 traffic split, conversion rate metrics, and statistical significance progress bar

    Understanding how the tool operates mechanically changes how you design and interpret tests. Manage Your Experiments (MYE) is Amazon’s native content experimentation platform, available exclusively to Brand Registry brand owners through Seller Central. When you launch an experiment, Amazon splits your eligible ASIN’s shopper traffic approximately 50/50 between two versions of a listing element — in the case of image tests, that means Version A shoppers see your current main image, and Version B shoppers see your challenger image.

    This split is applied at the session level, not the account or device level, meaning individual shoppers are randomly assigned to one variant for their session. Amazon does not publicly document the exact randomization algorithm, but expert consensus is that the split is consistent enough to be reliable across high-traffic ASINs over the recommended duration window.

    The Metrics MYE Reports

    The results dashboard surfaces the following metrics per variant: sample size (unique shoppers who saw each version), conversion rate, units ordered, total sales revenue, and units sold per visitor. For image tests specifically, click-through rate from search results is arguably the most critical upstream metric — a stronger main image drives more clicks, which flows into the rest of the funnel. However, CTR as a standalone metric in MYE is less prominently reported than conversion rate, which measures what happens after the shopper lands on the detail page.

    This is an important nuance. A main image change that lifts CTR but doesn’t lift conversion may still be a net positive from a traffic-acquisition standpoint, particularly if your organic rank benefits from improved click velocity. But MYE’s primary lens is conversion rate and units sold. Keep that in mind when framing your success criteria before you launch.

    How Statistical Significance Is Determined

    Amazon reports a probability score — essentially a confidence level that one version is genuinely outperforming the other, rather than the difference being random variation. The tool’s internal threshold for flagging a winner appears to sit around 66–70% confidence, which is substantially lower than the 90–95% confidence standard used in rigorous statistical practice. This matters enormously. Amazon may signal a result as meaningful while the actual evidence would not meet the standard applied in an academic or enterprise CRO context.

    If you’re treating the tool’s built-in significance flag as gospel, you’re operating on a lower evidentiary threshold than you probably realize. Experienced sellers add their own filter: they look for probability scores above 90% before acting on a result, and they treat anything below that as directional — interesting information that warrants a follow-up test, not a publishing decision.

    MYE also offers a “Run to Significance” setting, where Amazon automatically ends the test once it judges enough data has been collected. This is convenient, but it puts the significance threshold decision in Amazon’s hands rather than yours. More on that later.

    Eligibility Reality Check: Who Can Actually Run These Tests

    Before designing your first experiment, you need to confirm you’re eligible — and eligibility is more restrictive than Amazon’s marketing language implies. The two hard requirements are Brand Registry enrollment and sufficient ASIN traffic. Meeting one without the other means no experiments.

    Brand Registry Requirements

    You must be the brand owner enrolled in Amazon Brand Registry with an active registered trademark in the marketplace where you want to experiment. Generic resellers, wholesale accounts, and arbitrage sellers are categorically excluded. The brand owner designation must be tied to the selling account running the experiment — you cannot run experiments on behalf of a brand through an unaffiliated account. A Professional selling plan is also required; individual plan accounts cannot access MYE.

    If you manage multiple brands or brand entities, each requires its own Brand Registry enrollment. Experiments are brand-specific and cannot be run across brands in the same account without separate enrollments.

    Traffic Thresholds: The Number Amazon Won’t Officially State

    Amazon does not publish a precise minimum traffic threshold for MYE eligibility, but the practical consensus among sellers and tools teams in 2026 is approximately 1,000 detail page views in the last 30 days as the floor. Some sellers report eligibility at slightly lower volumes; others report ineligibility well above that number depending on category and order velocity.

    The reason traffic matters isn’t just eligibility — it’s result reliability. An ASIN with 500 monthly sessions will take significantly longer to accumulate the sample size needed for a statistically valid result, often far exceeding Amazon’s maximum experiment duration. The tool will technically run the experiment, but the result will be inconclusive. In practice, ASINs with fewer than 1,000–1,500 monthly detail page views should not be prioritized for MYE image testing. Your effort is better spent on traffic acquisition first.

    What Happens When You’re Not Eligible

    If an ASIN doesn’t appear in your MYE experiment setup, it’s almost always a traffic issue rather than a product category restriction. The solution isn’t to try to force the experiment — it’s to run sponsored ads to build sufficient organic and paid session volume, then revisit eligibility in 60–90 days. Running experiments on artificially traffic-boosted ASINs introduces its own confounds (paid traffic behaves differently than organic), so the target should be consistent organic session velocity before you test.

    Building a Real Hypothesis Before You Touch Seller Central
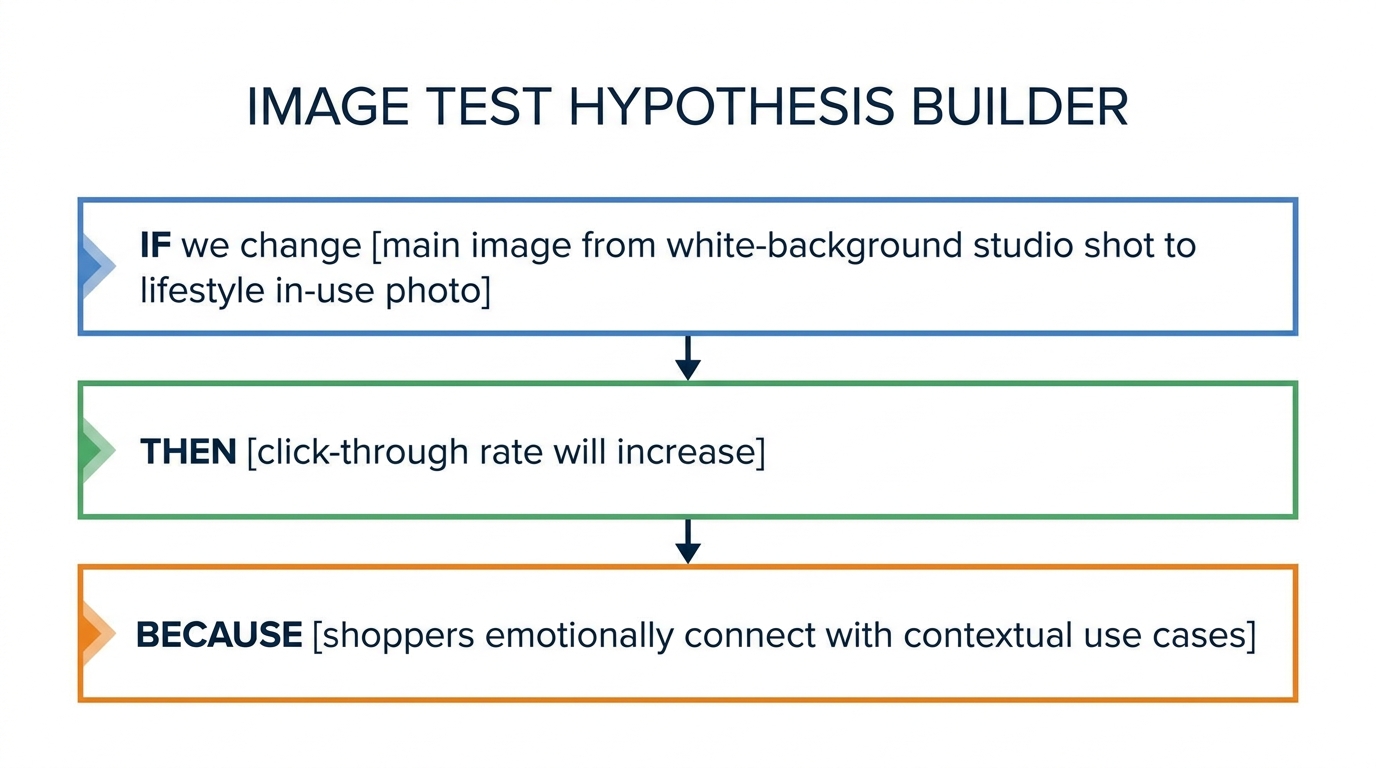
    Scientific hypothesis framework diagram showing IF-THEN-BECAUSE structure for Amazon product image A/B testing

    The single most common reason image tests produce ambiguous results is that they begin with a vague question rather than a falsifiable hypothesis. “Let’s see if the lifestyle photo does better” is not a hypothesis. It’s a guess. A real hypothesis specifies what you’re changing, what you expect to happen, why you expect it, and how you’ll measure it.

    The IF-THEN-BECAUSE Framework

    The most practical hypothesis structure for image testing follows a three-part format:

    • IF we change [specific image element] from [Version A description] to [Version B description]
    • THEN we expect [specific metric] to [increase/decrease] by [approximate magnitude]
    • BECAUSE [the mechanism — why this change should produce this effect]

    For example: “If we change the main hero image from a white-background studio shot to a lifestyle image showing the product in use in a kitchen, then we expect click-through rate and conversion rate to increase by 10–20%, because shoppers searching for this type of product respond to contextual use-case imagery that helps them visualize the product in their own environment.”

    That’s a testable, documented hypothesis. You’ve committed to a mechanism, a metric, and an approximate magnitude before seeing any data. This matters because it prevents you from retroactively reframing results to fit whatever the data shows.

    One Variable Per Experiment, Without Exception

    The temptation to “improve” a challenger image by also adjusting the background, changing the angle, and updating the props is constant — and must be resisted. Every element you change in Version B beyond the one variable you’re testing becomes a potential explanation for any difference in results. If you change three things and Version B wins by 15%, you don’t know which of the three things drove the lift. You can’t replicate it. You can’t learn from it. You’ve wasted 8–10 weeks of live traffic.

    The practical rule: Version B should differ from Version A in exactly one meaningful way. If you’re testing white background versus lifestyle context, every other element — product size in frame, lighting quality, image resolution, angle — should be as consistent as possible. This is harder than it sounds. It requires briefing your photographer or AI image tool with precision, and it requires reviewing the two variants side by side with a checklist before launching.

    Defining Success Before You Start

    You should also define your minimum meaningful effect size — the smallest lift that would make publishing the winning variant worthwhile — before the experiment runs. This prevents the common mistake of declaring a 1.5% conversion lift as a meaningful win when the test-to-action cost (photography, setup time, opportunity cost) required a 5% lift to justify the effort. Document it. Lock it in. Don’t move it.

    Which Image Variables to Test First — and In What Order
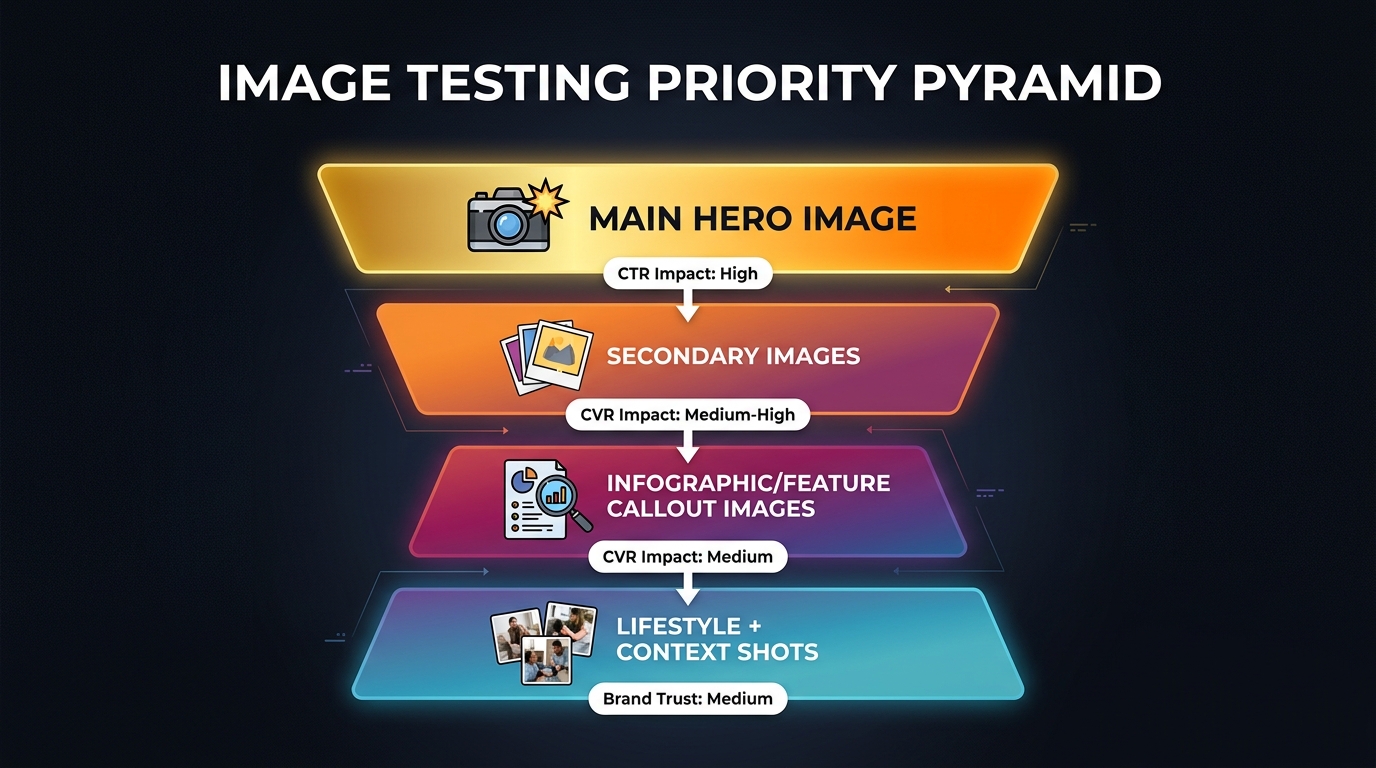
    Image Testing Priority Pyramid showing main hero image at top with high CTR impact down through secondary images, infographic callouts, and lifestyle shots

    Not all image variables carry equal weight, and testing them in the wrong order wastes testing cycles. The priority sequence should follow the shopper’s decision path — from the first impression in search results to the deeper-dive content on the detail page.

    Tier 1: The Main Hero Image

    The main image is the highest-leverage test you can run, and it should almost always be first. It’s the only image shoppers see in search results, on category browse pages, and in sponsored ad placements. A stronger main image lifts CTR from every entry point, and CTR feeds into organic ranking velocity. The downstream effect of a better main image compounds far beyond the conversion rate lift measured in MYE alone.

    The most productive main image tests in 2026 fall into these categories:

    • Background context: Pure white background vs. a subtle environmental context (kitchen counter, desk surface, outdoor terrain — appropriate to the product’s use case)
    • Product scale: Full product visible vs. cropped to show detail; product filling 75% of frame vs. 85% of frame
    • Product orientation: Front-facing vs. slight 3/4 angle to show dimensionality
    • Packaging vs. product: Showing the retail packaging vs. the bare product — relevant for supplement, cosmetic, and food categories
    • Use-in-hand vs. standalone: Product held by a hand or in use vs. floating on its own

    Documented results from main image tests vary widely depending on the quality of the original image, but typical conversion lifts range from 8–25%, with well-designed tests on weak originals occasionally reaching 30% or more. A case study from the UK marketplace showed a main image change lifting conversion from 21% to 24% — a 14% relative improvement — driving a 35.5% month-over-month sales increase and a 67% net profit gain on that ASIN.

    Tier 2: Secondary Images and Their Role in Conversion

    Once your main image is optimized, secondary images (image slots 2–7) become the primary lever for the on-page conversion rate — what happens after the shopper arrives. Secondary images serve a different function than the main image: they answer questions, overcome objections, demonstrate scale and use, and build purchase confidence.

    Testable secondary image variables include:

    • Feature infographic vs. lifestyle photo in position 2 — does the shopper want to see features annotated on the product, or do they want to see it in use?
    • Size/scale comparison image (product next to a common object) vs. a dimensions diagram
    • Social proof image (star rating callout, review count banner) vs. a materials/ingredients breakdown
    • Before/after or use-case sequence vs. a single use-case lifestyle shot

    Secondary image tests tend to produce smaller lift magnitudes than main image tests — typically 5–15% conversion improvement — but they’re still highly valuable, particularly for complex products where shoppers need information before converting.

    Tier 3: A+ Content Images

    MYE also allows testing of A+ Content, which includes the module-based enhanced content images below the fold. These tests are best run after main and secondary image optimization is complete, since A+ content is seen by fewer shoppers (those who scroll far enough to reach it) and has a lower per-impression impact than above-the-fold elements. However, for high-involvement purchase decisions — electronics, furniture, fitness equipment, health products — A+ content images can meaningfully influence the final conversion decision and are worth testing systematically.

    Sample Size, Duration, and the Traffic Threshold You Cannot Ignore
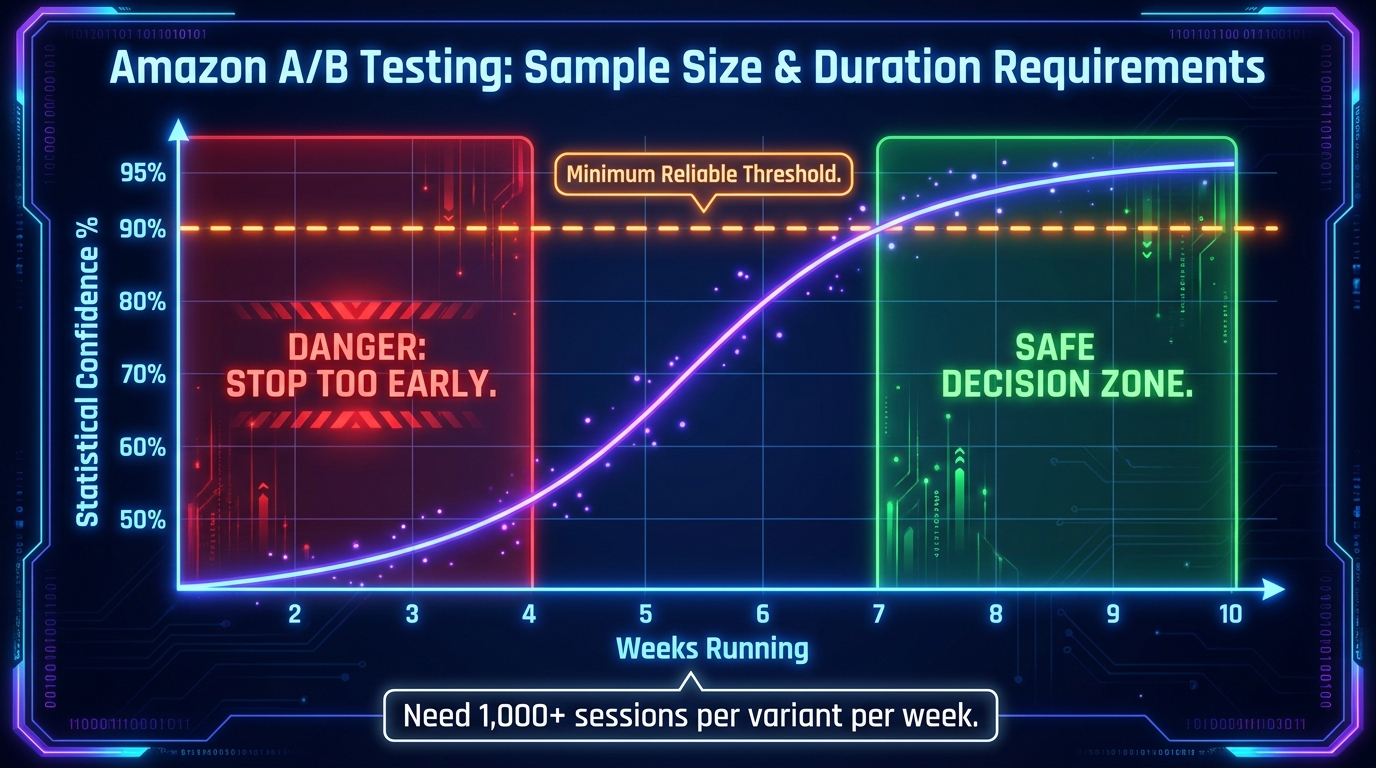
    Graph showing statistical confidence building over experiment weeks with danger zone in weeks 1-4 and safe decision zone in weeks 7-10 for Amazon A/B testing

    The duration and sample size question is where most seller-run experiments fail silently. The test completes, a result appears on the dashboard, and a decision is made — but the data underlying that decision was never sufficient to produce a reliable result in the first place.

    Why 8–10 Weeks Is the Standard

    Amazon’s own guidance for MYE experiment duration is 8–10 weeks for most tests. This is not arbitrary. Several statistical realities make shorter durations unreliable for most Amazon ASINs:

    Day-of-week variance: Amazon shopper behavior varies systematically by day of the week. Weekend browsers behave differently from weekday buyers. A test that runs for only 2–3 weeks may have disproportionate exposure to certain days depending on when it launched, skewing results. A full 8-week run captures approximately 8 complete weekly cycles, washing out day-of-week noise.

    Novelty effects: A new image variant may receive an initial boost (or drag) from algorithm freshness effects. Running long enough allows novelty to dissipate and genuine performance to emerge.

    Sample size accumulation: Statistical reliability requires a minimum sample size per variant. The rule of thumb for Amazon image tests is approximately 1,000 sessions per variant per week. An ASIN generating 2,000 total weekly sessions (1,000 per variant) needs a full 8–10 weeks to accumulate 8,000–10,000 sessions per variant — a robust sample for conversion rate testing. Lower-traffic ASINs need proportionally longer, but since Amazon caps experiment duration, low-traffic tests may end before reaching adequate sample size.

    The “Run to Significance” Setting: Convenient, But Not Risk-Free

    Amazon’s “Run to Significance” option automatically ends the experiment when it judges sufficient data has been collected. This is useful for sellers who don’t want to monitor duration manually, but it comes with one significant caveat: Amazon’s internal significance threshold is lower than best-practice standards. The tool may end a test and call a winner at 66–70% confidence, which means there’s a 30–34% probability the declared winner is actually a false positive.

    For sellers running high-stakes tests on their primary revenue ASINs, the recommendation is to set a fixed 8–10 week duration rather than relying on “Run to Significance,” and to apply your own 90%+ confidence filter when reviewing results. For lower-stakes exploratory tests, “Run to Significance” is an acceptable shortcut.

    What Happens When Your ASIN Doesn’t Have Enough Traffic

    If your ASIN generates fewer than 1,000 sessions per week, you have a few options. First, you can drive additional paid traffic during the test period through Sponsored Products campaigns — but this introduces a confound, since paid traffic converts differently than organic traffic. The results from a traffic-boosted test should be interpreted with caution and validated post-publication. Second, you can wait until the ASIN has built more organic velocity before testing. Third, you can run the test knowing that the result will be directional rather than definitive, and plan a follow-up confirmatory test once traffic has grown. The worst option is to run the test, see any result, and treat it as ground truth regardless of sample size.

    Reading MYE Results Without Fooling Yourself
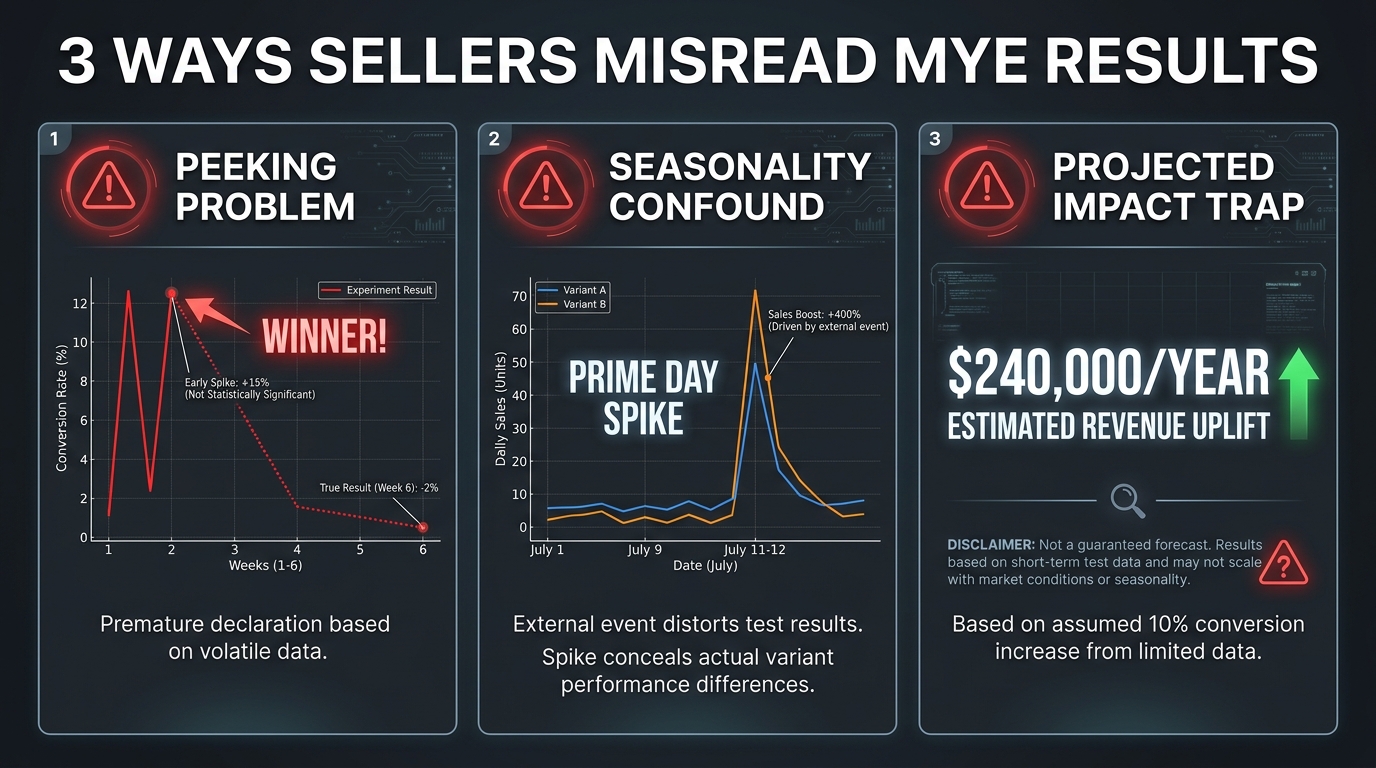
    Dashboard showing three common Amazon MYE result misinterpretations: the peeking problem, seasonality confound, and projected impact trap

    The results dashboard in MYE is designed to be readable by sellers with no statistical training. That’s both its strength and its primary failure point. The simplification required to make results accessible also strips away the nuance needed to interpret them correctly.

    The Peeking Problem: Why Early Results Are Almost Always Wrong

    The most destructive habit in experiment management is checking results while the test is running and acting on what you see. Early data in any A/B test is inherently volatile. With small accumulated sample sizes, random variation produces dramatic-looking differences that smooth out as more data accumulates. Version B might appear to be winning by 20% at week 2 and be statistically indistinguishable from Version A by week 6.

    The statistical term for the distortion caused by monitoring and potentially stopping tests early is “peeking,” and it’s one of the most well-documented sources of false positives in experimentation science. Amazon’s own documentation warns against ending tests early, but the visual of an apparent “winner” on the dashboard is compelling enough that many sellers can’t resist.

    The practical discipline: set your experiment, lock your review date for the day it completes, and do not look at interim results with intent to act on them. Check that the experiment is running (not paused), and that’s the extent of your mid-experiment engagement.

    The Confidence Score: What Each Level Actually Tells You

    When reviewing results, the confidence score (probability that one version is better) should be your first filter, applied before you consider any of the headline metrics:

    • Below 70%: No meaningful signal. The result is effectively a coin flip. Do not publish based on this result. Either extend the test or treat it as inconclusive.
    • 70–89%: Directional signal only. One version appears to be performing better, but the evidence isn’t strong enough for a high-confidence publishing decision. Consider this informative for future hypothesis design, not actionable as a standalone result.
    • 90–95%+: Reliable enough to act on for most business decisions. Publish the winner with reasonable confidence that the lift is real. Validate performance in the 4–6 weeks post-publication.
    • 95%+: Strong evidence. Act on this result with confidence. Document it as a high-quality data point for your testing knowledge base.

    Which Metrics to Prioritize in Image Tests

    Not all metrics reported in MYE carry equal weight for image experiments. Here’s how to prioritize them:

    Primary: Units ordered and conversion rate. These are the most direct measures of whether your image change influenced purchase behavior. Units ordered accounts for volume differences; conversion rate accounts for traffic differences between variants.

    Secondary: Sales revenue. Revenue is useful for understanding dollar impact, but it can be skewed by price variation, promotional discounts applied during the test period, or add-on item purchases. Weight it less heavily than units ordered.

    Tertiary: Units per visitor. This metric captures whether a single session tends to result in a multi-unit purchase, which is relevant for consumable and bundled products but less meaningful for single-unit durables.

    Return rate and review velocity are not directly reported in MYE but should be monitored in your broader analytics for the 60 days following a winning image publication. A new image that increases conversions but also increases return rates (because the product doesn’t match what the image implied) is a net negative that MYE’s dashboard won’t flag.

    The “Projected One-Year Impact” Number: What It Means and What It Doesn’t

    When an experiment completes with a clear winner, MYE displays a “Projected one-year impact” figure — a Most Likely, Best Case, and Worst Case estimate of how much additional annual revenue and units you’d gain by publishing the winning version. This number is frequently misunderstood, and that misunderstanding leads to poor business decisions.

    How the Number Is Calculated

    The projected one-year impact is not a demand forecast. It’s a mechanical extrapolation: Amazon takes the average daily difference in units sold between the winning and losing variant during the test period, multiplies it by 365, and presents that as the annual impact under various scenarios. There is no seasonality modeling, no accounting for pricing changes, no adjustment for competitive dynamics, and no consideration of whether the test-period traffic is representative of annual traffic patterns.

    If your test ran during Q4 — when most categories see peak demand — the extrapolation will wildly overestimate annual impact. If it ran during a slow period, it will underestimate. The number is directionally useful as an order-of-magnitude sense check, but it should never be used for financial planning, board presentations, or resource allocation decisions without significant manual adjustment.

    Applying the Number Correctly

    The right way to use the projected impact figure: treat it as a rough signal for prioritizing which winning variants to publish first when you have multiple concluded tests waiting for action. A test showing a projected impact of $180,000 should generally be published before one showing $12,000, all else being equal. The relative ranking of tests by projected impact is more meaningful than any individual number’s absolute value.

    Also note: the Best Case scenario in MYE’s projected impact display tends to assume conditions that are rarely sustained. Use the Most Likely figure, apply your own seasonality discount or premium based on when the test ran, and treat the result as a directional indicator rather than a precise forecast.

    Confounds That Corrupt Your Experiment — and How to Avoid Them

    Even a well-designed experiment can produce unreliable results if external factors create asymmetric conditions for the two variants during the test period. These confounds are the second most common reason image tests fail to deliver usable insights.

    Pricing Changes Mid-Test

    Any price change applied to your ASIN during an active experiment contaminates the results. Price is the most powerful conversion lever on Amazon — a 10% price reduction will almost always produce a conversion lift that dwarfs any image-driven effect. If you change price mid-test, stop the experiment, discard the data, and restart once price has stabilized for at least two weeks.

    Similarly, coupons, deals, and lightning deal activations during the test period introduce conversion spikes that are impossible to disentangle from image effects. Schedule experiments to avoid planned promotional periods, and if an unplanned promotion runs during your experiment window, note it explicitly and discount the result accordingly.

    Inventory and Buy Box Disruptions

    Going out of stock for even a day during a test period corrupts the data for the variant that was running when the stockout hit. Likewise, losing the Buy Box to a competitor for any portion of the test window means a fraction of your “sessions” during that period saw a different purchasing experience than usual. Monitor inventory and Buy Box ownership daily during active experiments and pause the experiment immediately if either condition occurs.

    Seasonal Demand Shifts

    Avoid starting image tests within 3 weeks of major shopping events (Prime Day, Black Friday, Cyber Monday, back-to-school peaks, holiday ramp-up). The traffic composition, intent level, and conversion propensity of shoppers during these periods is substantially different from typical weeks. If an experiment straddles a seasonal event, the data from those weeks should be weighted down when interpreting results — or the experiment should simply be extended to ensure an equal amount of non-peak data on both sides of the event.

    Concurrent Listing Changes

    This is the most commonly violated discipline in real-world testing. During an active image experiment, do not change your title, bullet points, description, A+ content, back-end keywords, pricing, or any other listing element. Any concurrent change creates a new confound that prevents you from attributing result differences to the image variable under test. If you need to make a critical listing change during an active experiment, pause the experiment first, make the change, allow the listing to stabilize for one week, then restart — resetting the clock.

    What to Do After a Winner: The Iteration Roadmap
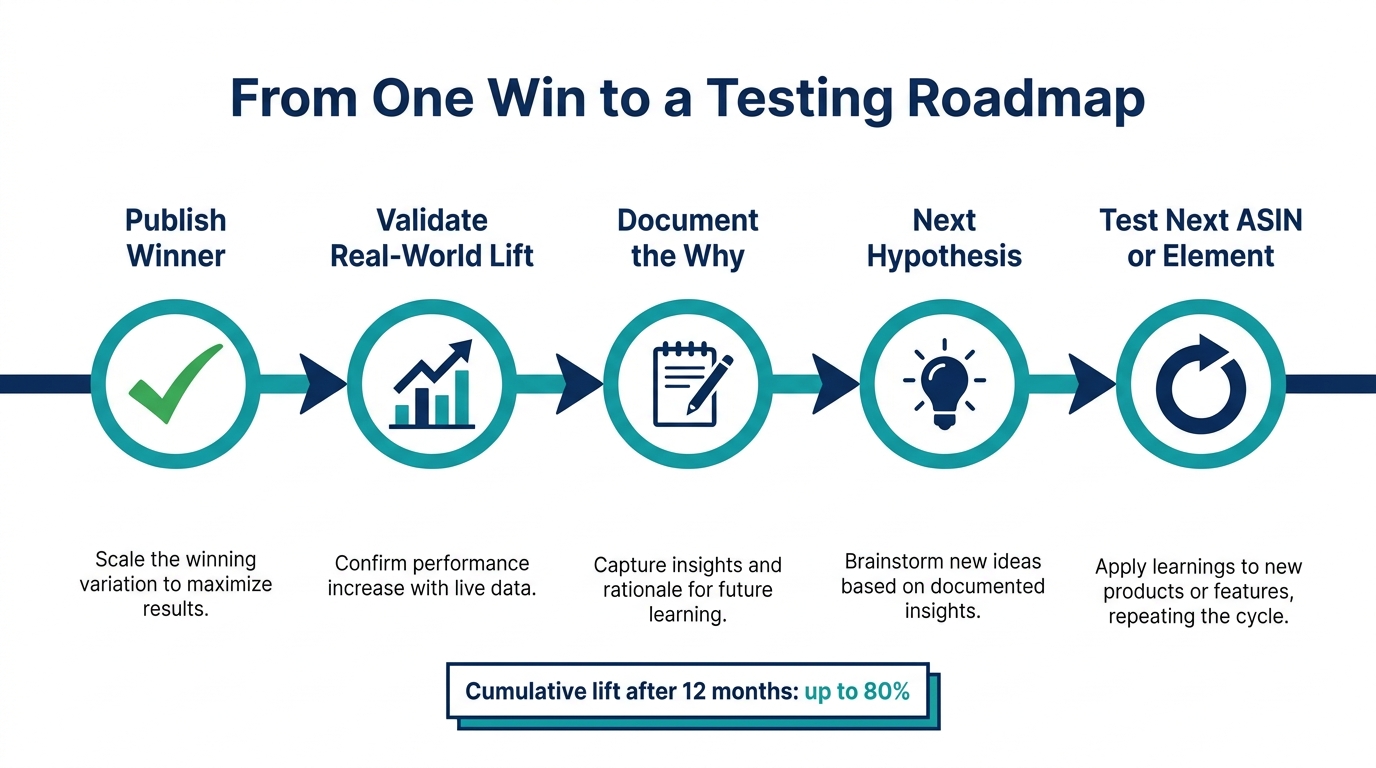
    Post-experiment iteration roadmap showing five milestones from publishing winner through validating lift, documenting learnings, forming next hypothesis, and testing next ASIN

    Declaring a winner and hitting publish is the halfway point of a useful experiment, not the finish line. The real value of systematic image testing accrues over multiple test iterations, as each experiment generates learnings that sharpen the next hypothesis and raise the hit rate of future tests.

    Step 1: Publish and Validate

    When you have a high-confidence winner (90%+ confidence score, positive result on units ordered), publish the winning variant immediately. Then monitor real-world performance for the next 4–6 weeks without running another image experiment on the same ASIN. Look at: conversion rate in your Business Reports, session-to-order ratio, return rate, and any change in organic ranking position. If the published winner produces the expected lift in organic data, the result is validated. If performance reverts or deteriorates, you may be seeing a novelty effect wearing off, or the test result may have been a false positive — both of which are actionable learnings.

    Step 2: Document the Why

    The most underused practice in seller-run experimentation is documentation. After publishing a winner, write down: what you tested, what the hypothesis was, what the result was (including the confidence score and magnitude), and your interpretation of why the winner performed better. This doesn’t need to be elaborate — a shared spreadsheet with six fields per test is sufficient. Over time, this knowledge base becomes one of your brand’s most valuable assets: a proprietary library of what works for your specific customers in your specific category.

    Patterns emerge from documented experiments that aren’t visible from individual tests. You may find that lifestyle images consistently outperform white-background shots in your category, but only when the lifestyle context matches your primary customer’s age demographic. You may find that infographic-style images with text callouts lift conversion for male shoppers but underperform for female shoppers browsing the same ASIN. These insights require multiple tests and good documentation to surface.

    Step 3: Form the Next Hypothesis

    A completed test — win or loss — always generates a next question. If lifestyle beat white-background, the next question is: which lifestyle context works best? Indoor vs. outdoor? Solo use vs. group use? Morning vs. evening context? If the challenger lost, ask why: was the image quality technically inferior? Did the lifestyle context not match the customer’s self-image? Did the product look smaller or less premium in context?

    Each answered hypothesis narrows the search space for future tests. Within 3–4 image test cycles on a single high-traffic ASIN, you’ll typically find that your original main image was leaving somewhere between 15% and 40% of conversion performance on the table — and that the gains from systematic testing accumulate to a meaningfully different business outcome than you started with.

    Research indicates that sellers who run deliberate, well-structured image tests over 12 months on their core ASINs see cumulative conversion improvements of 30–80% relative to where they started. That’s not a single test result — it’s the compounded effect of sequential hypothesis-driven experiments, each building on the last.

    Step 4: Expand to the Next ASIN or Element

    Once your primary ASIN’s main image is optimized and you’ve documented the learnings, the playbook branches in two directions. First, apply what you’ve learned about image type preferences to your next highest-traffic ASINs — often the winning insight from ASIN 1 translates well enough to ASIN 2 and 3 that you can launch with a higher-confidence hypothesis and see faster results. Second, move to the next listing element on your primary ASIN: secondary images, then A+ content, then title. Each element has its own optimization ceiling, and working through them systematically compounds the total listing performance improvement.

    Building a Testing Cadence Across Your Catalog

    Individual tests are tactical. A testing cadence is strategic. The brands that make image testing a genuine competitive advantage aren’t running one experiment per quarter — they’re running three to six simultaneous experiments across their catalog, with a structured pipeline of hypotheses queued up, and a review rhythm that keeps the organization learning continuously.

    Building the Experiment Pipeline

    A practical cadence for a mid-sized brand with 20–50 active ASINs looks like this: at any given time, 3–5 ASINs are in active experiments. Another 5–8 ASINs are in the hypothesis development phase (images being designed or ordered). Another 3–5 ASINs are in the post-experiment validation window. The rest are either ineligible (insufficient traffic) or in a maintenance phase where they’ve been tested and optimized to a sufficient degree.

    This means roughly one new experiment launching per week, one concluding per week, and continuous data flowing into your testing knowledge base. At that cadence, a brand with 30 eligible ASINs can run 4–5 complete test cycles per year on its primary products — enough to produce a substantial cumulative optimization effect.

    Prioritizing Which ASINs to Test First

    Not all ASINs deserve equal testing attention. Prioritize using a simple matrix:

    1. Revenue contribution: ASINs that generate the most revenue have the highest upside from conversion improvement. A 15% lift on a $500,000/year ASIN is worth more than a 15% lift on a $20,000/year ASIN.
    2. Traffic volume: High-traffic ASINs generate reliable results faster, reducing the cost of experimentation in time and opportunity cost.
    3. Current conversion rate: An ASIN converting at 8% when the category average is 12% is a high-priority target — there’s a clear gap suggesting the current image may be underperforming relative to opportunity.
    4. Image quality baseline: ASINs with visibly dated, technically poor, or unoptimized main images have the most headroom for improvement and tend to produce the strongest test wins.

    When to Stop Testing a Specific Variable

    Testing has diminishing returns. After 3–4 rounds of main image testing on a single ASIN where results have been inconclusive or where marginal differences are shrinking, it’s reasonable to conclude that the current main image is near its optimization ceiling for this variable type and shift testing attention to other elements or other ASINs. The signal that you’ve reached this point: multiple consecutive tests showing no statistically significant difference between variants that are meaningfully different from each other.

    This is actually a useful result. Knowing that your main image is well-optimized for your category allows you to invest creative resources elsewhere with confidence that you’re not leaving easy wins behind.

    Integrating MYE Data with Your Broader Analytics Stack

    MYE results are most valuable when cross-referenced with data from Brand Analytics, your advertising console, and third-party tools that track organic ranking and search visibility. A main image that lifts MYE-measured conversion rate should also produce measurable downstream effects: improved organic ranking (as higher click-through signals to Amazon’s algorithm), lower ACoS on Sponsored Products (as the same ad spend converts at a higher rate on the improved listing), and improved return on ad spend overall.

    If a winning MYE experiment doesn’t produce observable downstream improvements in these broader metrics within 60 days of publication, treat the result with additional skepticism. Either the lift was a false positive, or other factors (pricing, competition, seasonality) are suppressing the gains. Either way, that’s a signal to investigate further rather than simply accepting the MYE result at face value.

    Making Scientific Testing a Permanent Competitive Edge

    Image testing through Manage Your Experiments is one of the few areas of Amazon seller optimization where disciplined process and rigorous methodology produce substantially better outcomes than intuition alone. The tool is available to every eligible brand. The traffic is already flowing. The data is already being generated. The only question is whether you capture it systematically or let it pass unused.

    The brands that win with image testing don’t have better creative instincts than everyone else — though strong creative judgment helps. They win because they’ve built a process that converts every test, win or loss, into a piece of organizational knowledge that makes the next test faster, better-calibrated, and more likely to produce a meaningful result. Over time, that compounding effect creates a catalog that’s demonstrably better optimized than competitors who are still changing images based on opinion and gut feel.

    The core discipline is straightforward, even if execution requires consistency:

    • Write a falsifiable hypothesis before every test
    • Change one variable per experiment, no exceptions
    • Run every test for a minimum of 8 weeks with adequate traffic
    • Apply a 90%+ confidence filter before acting on any result
    • Document wins, losses, and the reasoning behind each
    • Never change other listing elements during an active experiment
    • Validate real-world performance for 4–6 weeks after publishing a winner
    • Use each result to sharpen the next hypothesis, not just to justify a publishing decision

    Run that process consistently across your catalog for twelve months, and the cumulative effect — 30–80% improvement in conversion rate on optimized ASINs, stronger organic ranking driven by improved click signals, lower cost per acquisition across paid campaigns — will be visible in your P&L in ways that no single test could achieve on its own.

    The test is not the strategy. The testing system is the strategy.

  • 2026 Image Policy Traps: How to Suppression-Proof Your Entire Amazon Portfolio

    2026 Image Policy Traps: How to Suppression-Proof Your Entire Amazon Portfolio

    Amazon image policy traps 2026 — suppressed listings with red warning stamps and compliance checkmarks across a product catalog

    For most of Amazon’s history, image policy violations were a nuisance. You got a warning, you fixed the image, you moved on. The penalty was a temporary inconvenience — annoying, but contained.

    That dynamic has fundamentally changed in 2026. Amazon’s image enforcement is now faster, more automated, and more sweeping than anything sellers have dealt with before. What used to be a listing-level problem has become a portfolio-level risk — one that can suppress multiple ASINs simultaneously, pause ad delivery across your entire account, erode months of organic rank, and trigger account health flags, all from a batch of images that were perfectly acceptable eighteen months ago.

    The sellers who are getting hurt most aren’t the ones deliberately cutting corners. They’re brands that uploaded compliant imagery, forgot about it, and never realised that retroactive enforcement sweeps can catch old assets that no longer meet tightened standards. They’re growing accounts that used AI image tools without understanding the specific disclosure and accuracy rules Amazon now applies. They’re multi-ASIN operators who treated image compliance as a launch-day checkbox rather than an ongoing operational function.

    This post is not a recap of Amazon’s published image requirements. Those are widely documented elsewhere. Instead, this is a systematic look at the mechanisms by which compliant-seeming portfolios get caught, the cascade of consequences that follows, and the operational systems that actually keep a catalog clean under 2026’s enforcement regime — not just at launch, but over the long run.

    Why Image Policy Has Become a Portfolio-Level Risk, Not a Listing-Level Problem

    The shift isn’t in the written policy. Amazon’s core image requirements — pure white main image background at RGB 255,255,255, product filling approximately 85% of the frame, no text or graphic overlays on the main image, no watermarks or logos, accurate representation of the actual item being sold — haven’t dramatically changed in structure. What has changed is how those rules are applied and at what scale.

    Automated Enforcement at Catalog Scale

    Amazon’s image validation systems now operate more like continuous audit loops than one-time upload gatekeepers. In earlier years, an image might pass at upload because the automated check was relatively permissive, only to be flagged later if a human reviewer happened to look at the listing. In 2026, enforcement sweeps are faster, more frequent, and algorithmically driven — meaning an image that passed six months ago can be re-evaluated against updated detection thresholds and suppressed without a new upload or any action on the seller’s part.

    This retroactive enforcement is the trap most sellers don’t see coming. Your catalog isn’t static in Amazon’s eyes, even when you haven’t touched it. Periodic automated re-audits of existing listings mean that compliance isn’t a one-time achievement — it’s a continuous requirement that must be actively maintained.

    From Warning to Suppression Without Gradual Escalation

    The older enforcement model gave sellers a reasonable grace period. A non-compliant image might generate a fix-it notification, remain live during the remediation window, and only disappear from search if the seller ignored the warning repeatedly. The 2026 model, as reported consistently across third-party seller communities and agency analyses, is considerably less forgiving. Listings are being suppressed from search results much more quickly after an image violation is detected — in some cases without a prior warning notification arriving before the suppression takes effect.

    For a single-ASIN account, that’s painful. For a multi-hundred ASIN catalog, a batch enforcement event can create simultaneous suppression across a significant portion of the inventory — with ad campaigns burning impressions on ASINs that are no longer visible in organic search, and sales velocity crashing before the account owner even knows there’s a problem.

    Account Health Is Now Downstream of Image Compliance

    The previously clean separation between “image compliance” and “account health” is blurring. Repeated or severe image violations — particularly those that involve misrepresentation of the actual product — are increasingly feeding into account health scoring mechanisms. A high enough volume of suppressed listings, or violations that Amazon interprets as intentional misrepresentation rather than innocent non-compliance, can generate account-level flags that affect selling privileges well beyond the impacted ASINs.

    This is the portfolio-level risk that demands a portfolio-level response. Treating each ASIN’s image as its own isolated compliance problem is no longer an adequate operating model.

    The Six Hidden Suppression Triggers Amazon’s AI Catches That Sellers Don’t Expect

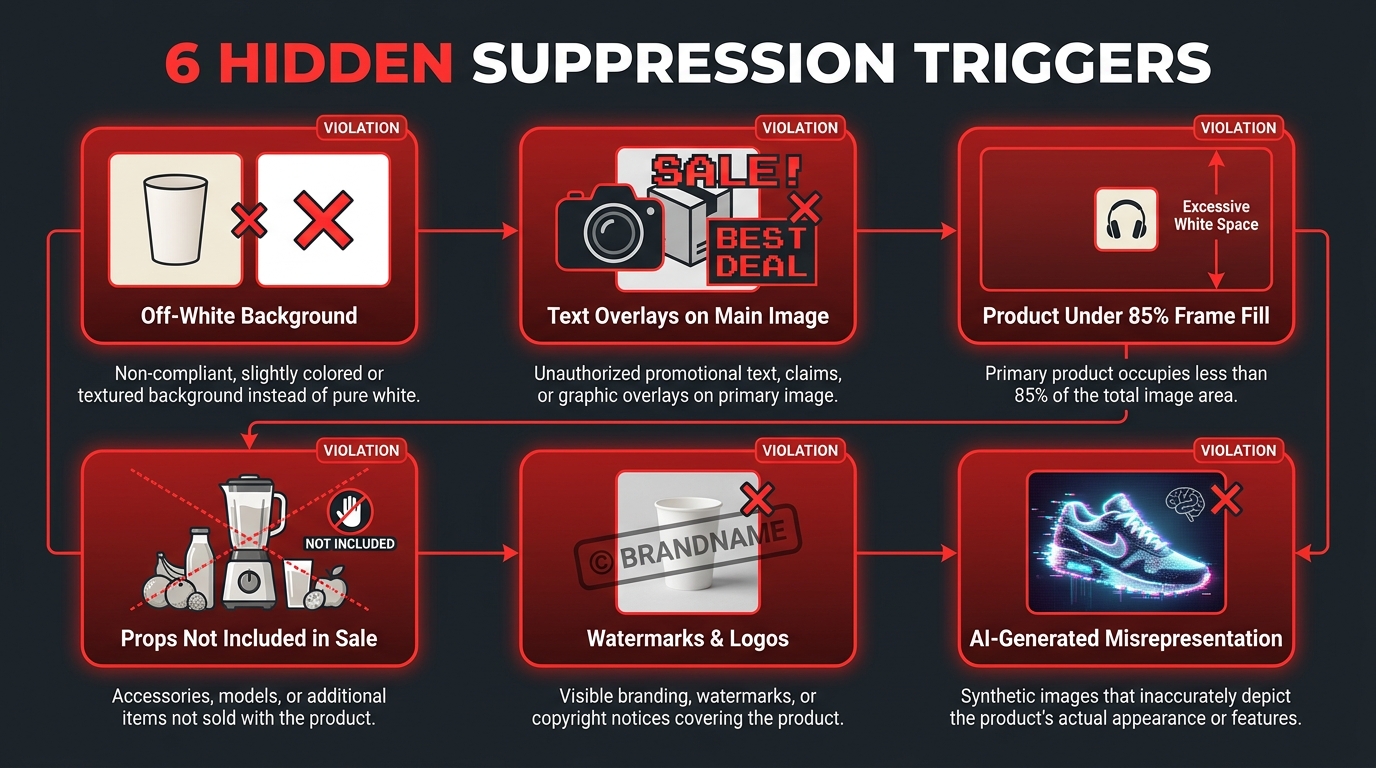
    Six hidden Amazon image suppression triggers in 2026 — infographic showing off-white background, text overlays, frame fill, props, watermarks, and AI misrepresentation violations

    Every seller knows the headline rules. What gets brands into trouble in 2026 isn’t ignorance of the obvious requirements — it’s the subtle violations that look compliant to the human eye but trip the automated detection systems Amazon has built.

    1. Off-White That Doesn’t Look Off-White

    The requirement is RGB 255,255,255. Not 254,254,254. Not 250,250,250. Not a creamy, soft white that looks perfectly clean on your monitor under warm studio lighting. Amazon’s automated detection can distinguish between true white and near-white backgrounds, and the threshold is being applied with increasing precision in 2026. Backgrounds that were accepted without issue at upload are being flagged during re-audit sweeps because the detection sensitivity has been raised.

    The practical source of this problem is often the photography workflow itself. Lightbox setups that use slightly warm-toned LED lighting, paper backdrop materials that have a natural texture or slight color cast, and editing workflows that stop at “looks white” rather than verifying the exact RGB values in post-production can all produce backgrounds that fail the threshold even though they appear compliant to the photographer’s eye.

    2. Shadows and Reflections as Background Violations

    A drop shadow beneath a product, a surface reflection on a glossy table, or a soft gradient created by the product’s own shape against the background — all of these introduce non-white pixels into the main image, and all of them are treated as background violations by Amazon’s image analysis. This is a widely reported trap that catches brands whose product photography is otherwise high quality. A beautiful, professionally lit image with a subtle shadow is still a suppression risk.

    3. Props and Context Objects “Not Included in Sale”

    Amazon’s policy is clear that the main image should show only the item being purchased. Lifestyle elements, complementary products, styling accessories, and contextual props that suggest scale or usage but aren’t included in the box are policy violations for the main image. The trap here is that many sellers use a “hero lifestyle” image as their main image — a decision that was sometimes tolerated historically but that 2026’s enforcement systems are now much more aggressive in flagging.

    Multi-piece sets and bundle products require particular care: the main image must accurately reflect exactly what’s in the box, and the grouping shown must exactly match the purchase. An image that shows a set of four items when the listing is for a set of three — even if it’s a photographic shorthand the seller never intended to be misleading — is a violation.

    4. Faint Watermarks and Edge Logos That Survived Cropping

    Brands that have used third-party image services, stock photography with embedded licensing marks, or photography vendors who added subtle branded watermarks as part of their standard delivery package can find that images contain low-opacity marks that are invisible to casual review but detectable by Amazon’s systems. Similarly, image files that were cropped from larger compositions may contain partial logos or graphic elements near the frame edge that weren’t visible in the pre-upload preview.

    5. Resolution Failures After Platform Compression

    Amazon recommends a minimum of 1,000 pixels on the longest side, with 2,000 pixels or more preferred to enable the zoom function. The trap occurs when sellers upload images that technically meet this threshold but whose effective resolution is degraded by compression artifacts, JPEG quality settings, or platform-side resizing. An image that uploaded at 1,050 pixels may display at a quality level that fails the zoom-enabled clarity standard — and Amazon’s systems can flag this during image quality audits.

    6. Inset Images, Callout Boxes, and Bundled Secondary Visuals in the Main Slot

    A surprisingly common violation involves main images that are actually composites — a primary product shot combined with a smaller inset image showing a detail, a bundled accessory, or a “what’s in the box” visual. From a seller’s perspective, this feels like useful communication. Amazon’s policy treats it as a graphics overlay violation, regardless of whether the inset contains any text. The automated detection for composite images — where the main frame contains a visually distinct embedded sub-image — has become sharper in 2026.

    The Cascade Effect — How One Suppressed ASIN Can Destabilize Your Entire Catalog

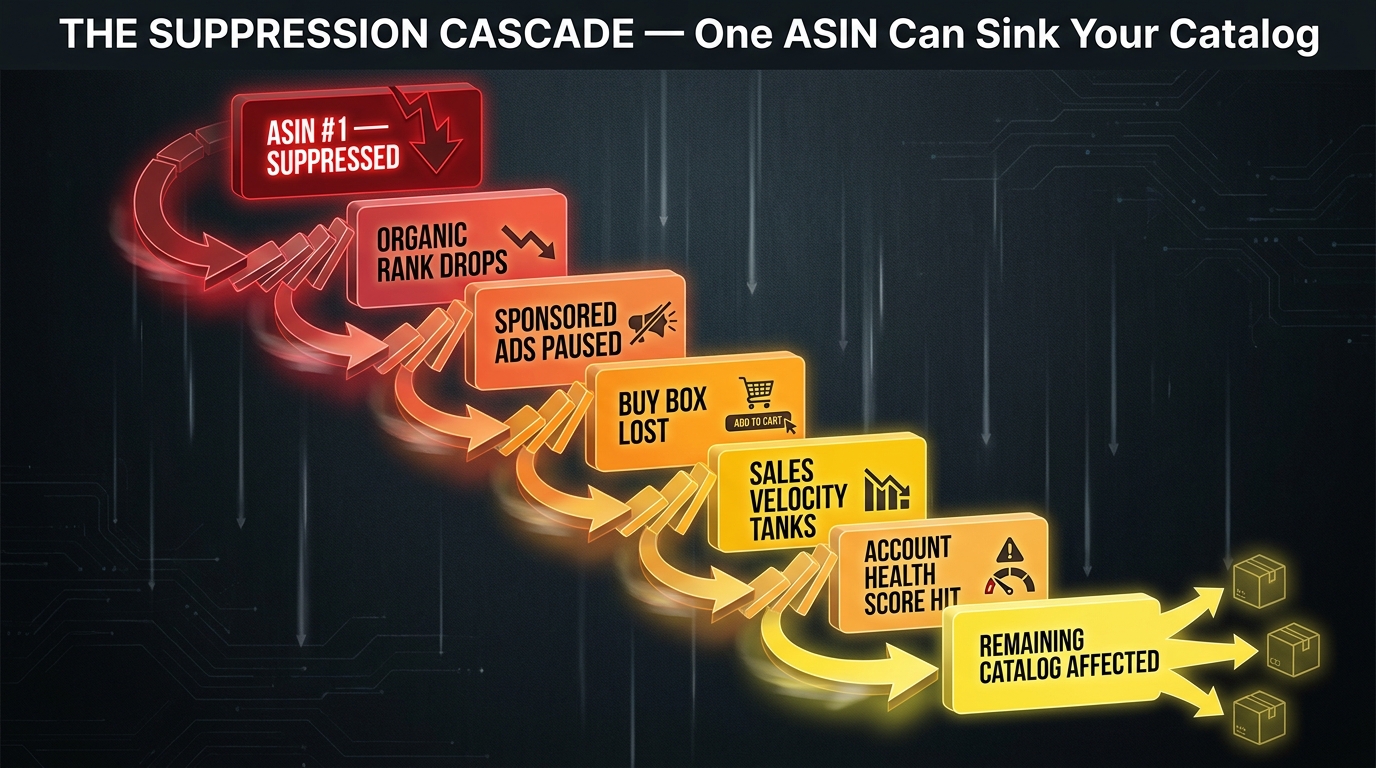
    Amazon suppression cascade diagram showing how one suppressed ASIN triggers organic rank drops, ad pauses, Buy Box loss, and account health deterioration

    Understanding suppression as a cascade rather than an isolated event is the conceptual shift that separates reactive sellers from genuinely protected portfolios. The cascade mechanics are worth understanding in detail because they explain why recovery is so much slower than the initial suppression.

    The Organic Rank Problem

    Amazon’s A10 algorithm uses sales velocity — among other signals — as a core input to organic ranking. A suppressed listing generates zero sales velocity, because it’s no longer appearing in search results for buyers to find and purchase. Depending on how long the suppression lasts before correction, the organic rank for that ASIN will decay. When the listing is restored after a compliant image is submitted, the organic rank doesn’t automatically reset to its previous level. It starts rebuilding from wherever it fell to — which means suppression recovery often involves not just fixing the image but re-earning rank that took months to establish.

    Ad Campaign Disruption

    Sponsored Products campaigns tied to a suppressed ASIN stop delivering impressions. This is straightforward and expected. What sellers often miss is the campaign learning disruption this causes. Advertising algorithms build performance models based on cumulative impression, click, and conversion data. A suppression-caused pause in delivery resets or degrades that accumulated learning, meaning the campaigns that restart after the listing is restored may underperform for days or weeks while the algorithm re-establishes its baseline.

    For accounts running Sponsored Brands or Sponsored Display campaigns that include the suppressed ASIN as part of a broader creative, the ripple extends further — those campaign types may see delivery disruptions or performance anomalies even for the ASINs that weren’t directly suppressed.

    Variation Parent and Child ASIN Interdependencies

    Many Amazon listings operate within variation families — a parent ASIN connected to multiple child ASINs representing different colors, sizes, or configurations. The suppression of a parent ASIN or a high-velocity child ASIN creates visibility and data problems for the entire variation family. Review aggregation, search ranking signals, and Buy Box mechanics at the variation level are all affected when a key node in the family goes dark.

    The reverse also applies: if a variation child is suppressed and its image issue is on the variation-specific image (the photo that shows the specific variant being sold), the brand may not notice as quickly because the parent listing appears to still be live. Meanwhile, customers clicking through to the suppressed variant see an incomplete listing experience, conversion suffers, and the data bleed affects the whole family’s performance signals.

    Inventory and Fulfillment Knock-Ons

    For FBA sellers, a suppressed listing that continues to hold inventory at Amazon fulfillment centers is still incurring storage fees while generating zero revenue. Extended suppression periods create a particularly damaging financial pressure: costs accumulate while the income that was supposed to offset them has stopped. For sellers operating near long-term storage fee thresholds, a suppression event can push inventory into penalty territory faster than expected.

    Category-Specific Traps That Generic Guides Never Cover

    Amazon’s image policy contains category-specific rules that layer on top of the universal requirements. These category rules are the compliance details that generic seller education typically glosses over — and that enforcement systems apply with precision.

    Apparel and Footwear: The Model and Mannequin Rules

    Amazon’s policy for most apparel categories requires that the main image show the garment on a human model or a “clean” invisible mannequin — not flat-lay photography, not folded product shots, and not display on a standard visible clothing form. This creates a compliance trap for brands that use flat-lay as their main image for aesthetic or cost reasons. The enforcement threshold for apparel main images has tightened considerably, and flat-lay images that appeared on detail pages for extended periods without issue have been swept in recent re-audit cycles.

    For footwear, the angle and orientation requirements add further specificity: shoes should generally be shown in a specific angled view that displays the upper, sole profile, and overall silhouette. Main images showing only the sole, only a side view, or only the toe box don’t meet the standard, even if the background and framing are technically perfect.

    Electronics and Technical Products: Accuracy of Included Accessories

    Electronics listings are particularly exposed to the “props not included in sale” violation because product photography in this category routinely includes cables, adapters, cases, and complementary devices for visual context and scale. If the main image shows a pair of headphones next to a smartphone for scale, but the smartphone is not included — that’s technically a violation. If the image shows a charging cable that’s included with one product variant but not another, and the same image is applied to both variants, that’s a misrepresentation violation on the variant that doesn’t include the cable.

    Grocery and Health Products: Label Legibility as Compliance

    For consumable products — supplements, food, beverages, personal care — Amazon’s content accuracy requirements intersect with image compliance in a specific way. The product label shown in the image must match the actual product label. Label updates that change ingredients, warnings, dosage instructions, or net weight create a window where the existing listing images show the old label while the actual product has the new label. This is an image accuracy violation even if the photography itself is otherwise perfectly compliant.

    Toys and Children’s Products: Safety Claim Restrictions

    Secondary images for toys and children’s products that include safety certifications, age-appropriateness badges, or compliance marks (ASTM, CPSC, CE, and similar) run into a specific content restriction: promotional badges and certification marks are prohibited in secondary images in ways that create ambiguity about what is and isn’t a compliance mark versus a promotional badge. The safe approach is to communicate safety certifications in the text content of the listing rather than embedding badges or certification logos in the images themselves.

    AI-Generated Images and the Compliance Grey Zone Sellers Are Walking Into

    Amazon does not ban AI-generated or AI-assisted product images. The policy is output-based, not tool-based — what matters is whether the final image accurately represents the actual product, meets technical specifications, and complies with content restrictions. This permissive-sounding policy is creating a false sense of safety among sellers who are using AI image generation extensively in 2026.

    The Accuracy Problem Is the Core Risk

    AI image generation tools produce images that look like the product being described, not necessarily like the actual product being sold. Generated images may alter proportions, modify colors, simplify details, add or remove design elements, or create a version of the product that is visually appealing but materially different from what the customer will receive. Amazon’s accuracy requirement — that images must truthfully represent the physical item being sold — applies with the same force to AI-generated images as to traditional photography.

    This creates a specific workflow risk: a seller who uses an AI tool to generate a “product image” for a listing that hasn’t been physically photographed, or who uses AI to produce imagery for product variants that differ only slightly from photographed versions, can end up with images that are technically accomplished but fundamentally misrepresent what’s in the box. The enforcement consequence is classification as a misrepresentation violation — a more serious category than a technical spec failure.

    AI Enhancement vs. AI Generation — A Distinction That Matters

    There’s a practical compliance difference between using AI tools to enhance a photograph of the real product (background removal, background replacement with pure white, color correction, upscaling) and using AI to generate a product image without a real photographic source. The former is generally lower risk as long as the enhancement doesn’t alter the product’s appearance in ways that misrepresent it. The latter is inherently higher risk because the output is a synthetic creation rather than a record of the actual product.

    For AI background removal and replacement specifically — a very common use case for achieving the pure white main image standard — sellers need to verify that the removal process didn’t clip the product edges, alter its apparent dimensions, or introduce artifacts that change the perceived product color or finish. These are easily introduced errors in AI-based background tools that human review of the output often misses.

    Disclosure Requirements and Evolving Expectations

    Amazon is moving toward requiring disclosure for AI-generated content in some contexts. The practical advice for 2026 is to treat AI-generated imagery with the same documentation discipline as traditional photography: keep records of what was generated, for which ASINs, using which prompts, and what accuracy verification was performed before upload. If enforcement questions arise, documented verification that the AI output accurately represents the physical product is the strongest defense available.

    Image Hijacking — The Suppression Risk You Didn’t Create But Still Own

    Image hijacking is one of the most underappreciated suppression threats in multi-seller marketplaces, and 2026’s enforcement environment has made it significantly more consequential. The mechanics are specific: in Amazon’s catalog architecture, a product detail page is shared infrastructure. Sellers listing on the same ASIN contribute to a shared content pool, and Amazon’s systems make judgments about which contributed content to display. This creates a vector for unauthorized content substitution.

    How Non-Brand Sellers Replace Your Main Image

    A third-party seller who attaches an offer to your ASIN can contribute content to that ASIN’s detail page — including images. If Amazon’s system evaluates their submitted image as higher quality, more compliant, or simply more recent than yours, it may display their image as the main image on your product detail page. This means a seller offering a counterfeit, grey-market, or materially different version of your product may effectively be showing their image — which may show a different product — as the main image for your ASIN.

    The catastrophic scenario is when the substituted image is non-compliant with Amazon’s policies. Your listing gets suppressed for a policy violation on an image you didn’t upload, didn’t approve, and may not even know exists on your product page. The suppression impact falls on your ASIN, your sales velocity, your organic rank, and potentially your account health.

    Brand Registry and Catalog Lock as Primary Defenses

    Amazon’s Brand Registry provides qualified brand owners with tools to assert control over the content displayed on their branded ASINs. The Catalog Lock feature — available to Brand Registry members — allows restriction of changes to key listing fields including the main image. When catalog lock is applied, only the brand-authenticated account can change the main image, regardless of what other sellers contributing to that ASIN submit.

    Applying catalog lock to high-revenue ASINs is not optional in 2026 — it’s a basic operational requirement. The risk of not doing so is an uncontrolled image substitution event that you may not discover until suppression has already occurred and rank has already started decaying.

    Monitoring for Unauthorized Image Changes

    Catalog lock prevents changes going forward but doesn’t retroactively notify you of changes that have already occurred. A monitoring workflow that checks the main image displayed on each high-value ASIN against a stored reference image on a regular cadence is the mechanism that catches hijacking events before they extend into suppression territory. This can be done manually for small catalogs, but for accounts with dozens or hundreds of ASINs, automated tools that screenshot product pages and compare against a reference library are operationally necessary.

    Building a Suppression-Proof Image QA System Before Launch

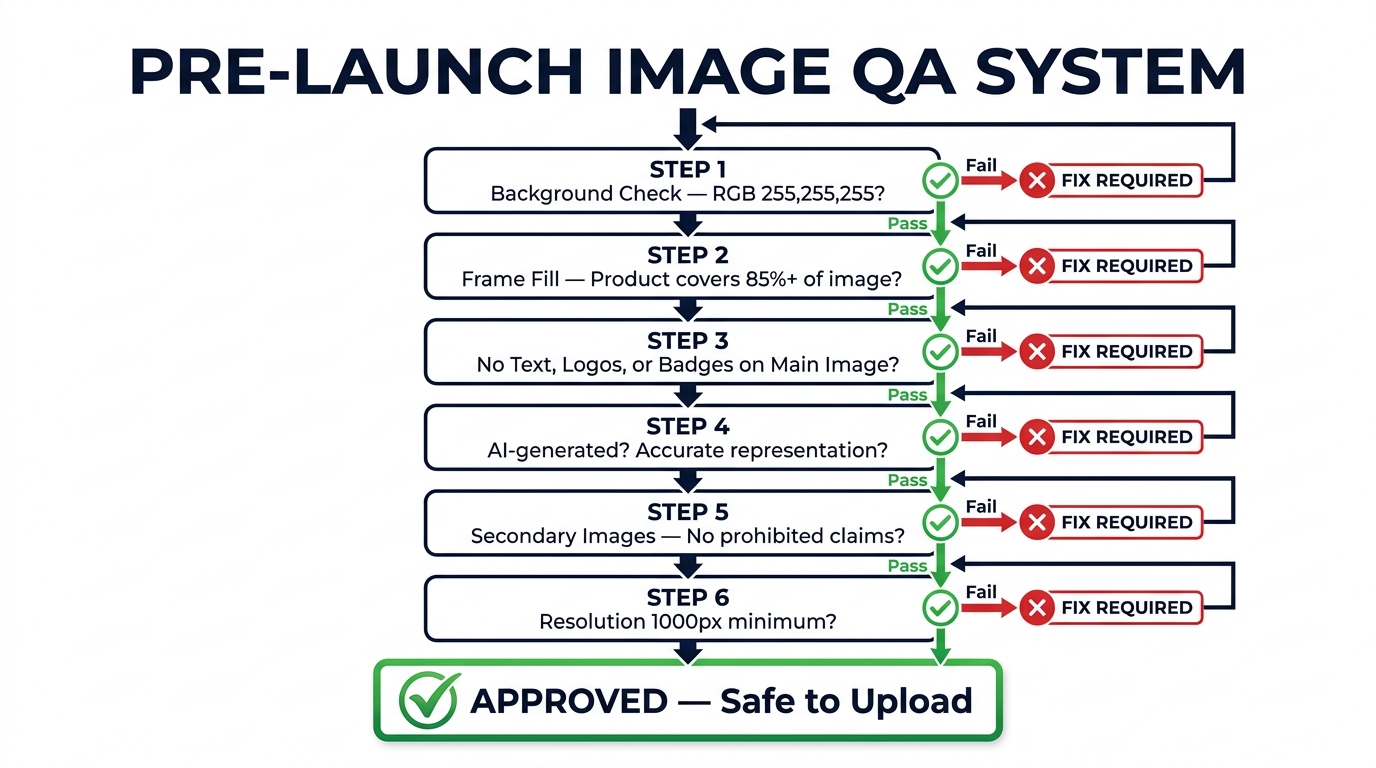
    Pre-launch image QA system flowchart for Amazon 2026 compliance — step-by-step checklist from background verification to upload approval

    Prevention is categorically cheaper than recovery in the Amazon suppression context. A listing that never gets suppressed doesn’t lose rank, doesn’t pause ad delivery, doesn’t trigger account health flags, and doesn’t require the operational scramble of emergency remediation. The investment in a pre-launch QA system pays back every time it prevents a suppression event.

    The Pre-Upload Technical Checklist

    A systematic pre-upload technical check should verify every image before it enters the Amazon catalog. For the main image specifically, this checklist should be non-negotiable:

    • Background verification: Open the image in a color-accurate editing environment and use the eyedropper tool to sample multiple background points. Confirm RGB values of 255,255,255 across the full background area. Pay particular attention to areas near the product edge, which are most likely to show gray fringing from background removal tools.
    • Frame fill measurement: Using a grid overlay or selection tool, verify that the product occupies at least 85% of the image canvas by area. For high-value listings, aiming for 90–95% coverage reduces the risk of failing stricter re-audit thresholds.
    • Element check: Verify absence of text, logos, badges, watermarks, inset images, and graphic overlays. Check at 100% zoom, not at thumbnail scale — violations that are invisible at thumbnail size are still policy violations.
    • Shadow and reflection audit: Zoom into the base of the product and check for ground shadow, cast shadow, or reflective surface elements. These are the most commonly overlooked non-white background elements.
    • Resolution confirmation: Check the actual pixel dimensions of the file, not the upload dialogue — confirm 2,000+ pixels on the longest side and appropriate file size for the format being used.
    • Accuracy verification: Compare the image against the physical product for color accuracy, included accessories, packaging match, and variant-specific details. For AI-enhanced images, this comparison must be done against the actual physical product, not the source image.

    Building a Category-Aware Review Layer

    Generic technical checks aren’t sufficient for category-specific compliance. For each product category you operate in, the QA system should include a category-specific module that checks against the additional requirements that apply to that category. For apparel, this means confirming model or invisible mannequin presentation for the main image. For electronics, this means verifying that every item shown in the image is included in the purchase. For consumables, this means confirming that the label shown matches the current product formulation and packaging.

    This layer of the QA system requires someone who actually knows the category-specific rules — which is itself an argument for centralized image compliance expertise within organizations managing multi-category catalogs, rather than relying on product managers or graphic designers to self-assess compliance.

    Version Control and Asset Management

    Every image that enters the Amazon catalog should have a documented record: the file, the date it was uploaded, the ASIN it was applied to, the slot it occupies (main vs. secondary slot number), who approved it, and any notes about the version history. This documentation serves two functions: it enables fast identification and replacement when an image fails a re-audit, and it enables quick detection of unauthorized image substitutions by comparing the currently displayed image against the documented approved version.

    When You’re Already Suppressed — A Recovery Playbook That Works in 2026

    Despite best prevention efforts, suppression events happen. The recovery process in 2026 has some specific characteristics that sellers need to understand to navigate it efficiently — because the wrong remediation approach can extend the suppression duration significantly.

    Triage by Revenue Impact First

    When a batch suppression event affects multiple ASINs simultaneously, the instinct is to work through a list systematically. The 2026 reality is that speed of recovery is more important for some ASINs than others, and limited internal resources need to be directed at the ASINs where suppression is causing the greatest revenue loss and rank decay. Sort the suppressed ASIN list by average monthly revenue or sales velocity and address the top items first.

    For the highest-revenue ASINs, consider whether you have a compliant backup image already prepared. This is the argument for maintaining a “compliance-ready” version of every main image as part of your asset management system — a pre-verified, technically perfect version that can be uploaded immediately during an emergency without requiring a photography or editing workflow to execute under time pressure.

    Understanding the Suppression Cause Before Fixing the Image

    Uploading a replacement image without first diagnosing why the original image was suppressed is a common and costly mistake. If the replacement has the same underlying issue — off-white background, subtle shadow, wrong frame fill — it will fail again, restarting the suppression clock and potentially triggering escalated enforcement attention. Seller Central’s listing quality dashboard and the suppression notification details (when available) should be reviewed to identify the specific violation category before any replacement image is prepared.

    The Right Way to Submit the Replacement

    Image replacement in 2026 works best when the corrected image is submitted through the most authoritative channel available. For Brand Registry sellers, this means using the Brand content submission tools rather than standard Seller Central image upload — brand-authenticated submissions are typically evaluated faster and carry higher confidence weighting in Amazon’s system. For sellers without Brand Registry, standard image upload through the listing edit interface is the only option, but ensuring the file metadata, filename format, and upload format all meet specifications reduces processing friction.

    Contacting Seller Support in parallel with a replacement upload is advisable for high-revenue ASINs where every day of suppression represents material revenue loss. A support case creates a documented record of the remediation effort and sometimes accelerates the system’s processing of the replacement image. Be specific in the support case about what change was made and why the new image is compliant — generic “please fix my listing” messages generate slower and less useful responses than precise technical explanations.

    Post-Recovery Monitoring

    Lifting a suppression doesn’t mean the underlying system risk is resolved. After a listing is restored, monitor it daily for the following two weeks to confirm that the replacement image is stable, that the listing’s search visibility has been restored, and that ad delivery has resumed and is rebuilding toward pre-suppression performance. Watch the variation family if applicable — sometimes restoring one ASIN reveals a secondary suppression on a sibling ASIN that wasn’t immediately visible.

    Continuous Monitoring — Tools, Cadences, and What to Actually Track

    Compliance is not a one-time achievement. Amazon’s enforcement environment in 2026 requires ongoing monitoring as a permanent operational function — not because the rules change constantly, but because retroactive enforcement sweeps, image hijacking attempts, and catalog drift (where product changes make formerly accurate images inaccurate) create ongoing risk that no initial audit can permanently eliminate.

    Daily Monitoring: Account Health and Suppression Alerts

    The Account Health dashboard in Seller Central is the primary real-time signal for policy violations and enforcement actions. Checking it daily — not weekly — is the baseline for any multi-ASIN operation. Suppression notifications, policy violation alerts, and image removal notices all surface here first. Many third-party tools integrate with Seller Central APIs to send automated alerts when account health metrics change, which reduces the response time from a daily manual check to near-real-time notification.

    Specific metrics to watch daily: account health score, listing quality score changes, new policy violations, and any notifications under the “Listing Issues” section of the inventory management view.

    Weekly Monitoring: Image Integrity Checks

    A weekly check of main images displayed on all active ASINs, compared against the approved reference image in your asset management system, catches hijacking-based substitutions before they have time to generate suppression events. For accounts with large catalogs, this is where automated screenshot comparison tools become necessary rather than optional — manual verification of hundreds of product pages weekly is not a sustainable operational workflow.

    Quarterly Audits: Full Catalog Compliance Review

    Every 90 days, conduct a full catalog compliance review against current Amazon image standards. The purpose of the quarterly cadence is to catch two types of drift: enforcement threshold drift (where Amazon’s automated detection becomes stricter, making previously-accepted images newly vulnerable) and product accuracy drift (where product updates, label changes, or packaging modifications have made existing images inaccurate).

    The quarterly audit should use the same comprehensive checklist as the pre-launch QA process, applied to every image in the active catalog. Prioritize the audit by revenue impact — high-revenue ASINs first — but complete the full catalog review within the quarter. Any images identified as potentially non-compliant during the quarterly audit should be scheduled for replacement before they become active suppression triggers.

    Tools Worth Using in 2026

    Several third-party tools have developed specific capabilities for image compliance monitoring and suppression detection in the Amazon context. Datahawk, SellerApp, and Jungle Scout all offer suppression monitoring features that alert sellers when listing status changes. For image accuracy and consistency verification across large catalogs, tools that can perform pixel-level comparison between reference images and current displayed images are increasingly available within broader catalog management platforms. Amazon’s own Listing Quality Dashboard — available to Brand Registry members — surfaces image-specific quality flags that can serve as early warning indicators before formal suppression occurs.

    The Opportunity Hidden in Compliance — How Strict Policy Creates Competitive Gaps

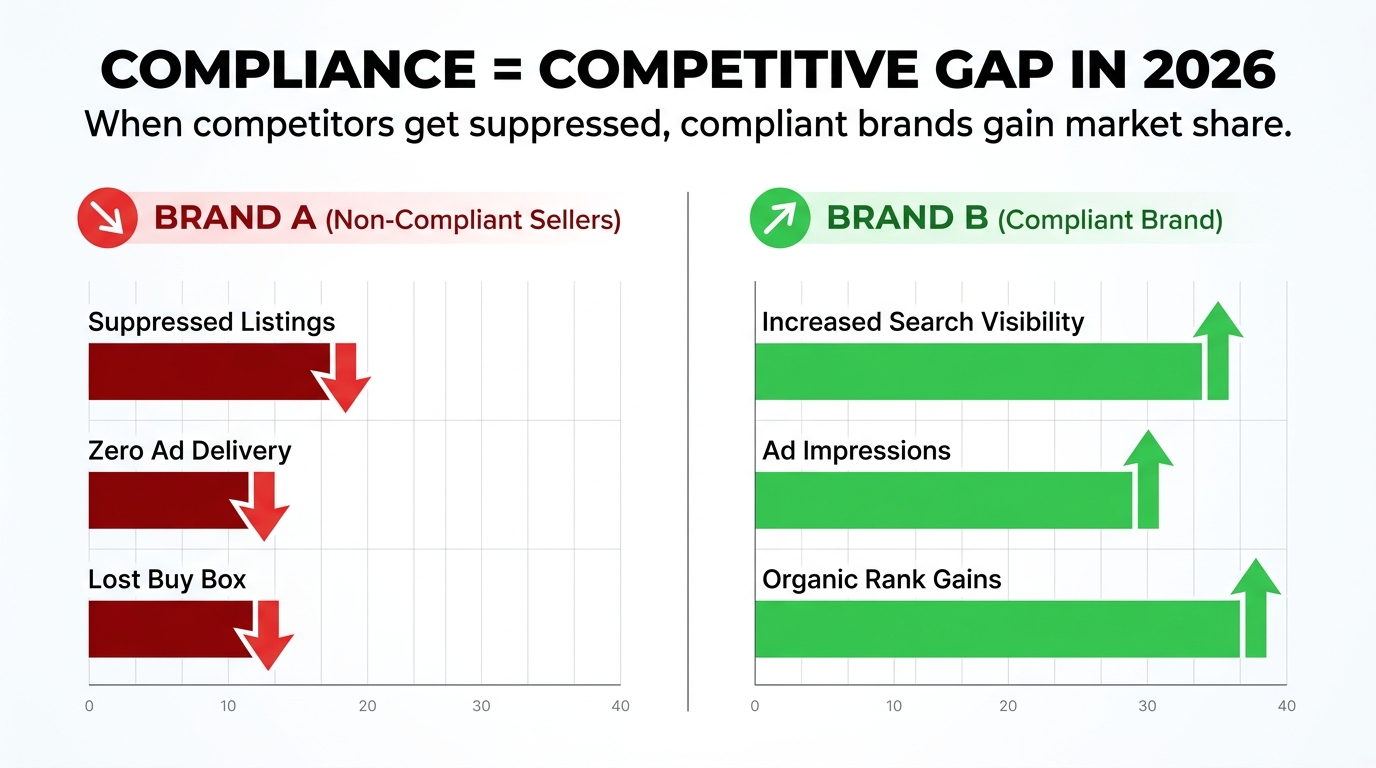
    Competitive advantage bar chart showing compliant brands gaining organic rank and ad impressions while non-compliant sellers face suppression in 2026

    There’s a strategic dimension to Amazon’s stricter image enforcement that most sellers, understandably focused on their own compliance risk, don’t fully consider. When enforcement creates suppression events at scale across a category, it disproportionately affects sellers who are least equipped to manage the operational demands of compliance — and that creates measurable opportunities for brands that maintain clean catalogs.

    Competitive Search Visibility When Rivals Go Dark

    When competing ASINs are suppressed from search results — whether for image violations or any other reason — the search result pages your customers are using don’t disappear. They just become less crowded. Organic rankings that were previously competitive become less contested, and brands with compliant, optimized listings move into visibility positions they couldn’t achieve organically against a full competitive field.

    This is not a minor effect. Category-level suppression events have been associated with measurable increases in organic rank and organic session traffic for remaining visible listings — particularly in competitive product categories where multiple sellers are battling for the same keyword positions. A brand that monitors competitor listing status and has ads pre-positioned to capture increased search traffic during competitor suppression events can generate meaningful incremental revenue from other sellers’ compliance failures.

    Ad Auction Dynamics During Suppression Events

    When competing ASINs are suppressed, their Sponsored Products campaigns stop delivering — because ads can’t drive traffic to suppressed listings. This removes their bidding pressure from the ad auction for shared keywords. For an advertiser with remaining live, compliant listings, the practical effect is lower cost-per-click for the keywords those competitors were previously contesting, at the same or higher impression volume. This is a direct ROAS improvement opportunity that requires no change to your own bidding strategy.

    The brands that capture this opportunity most effectively are those who monitor category-level suppression events as a standard part of their competitive intelligence, and who maintain adequate advertising budgets and bid structures to capitalize on the brief windows when competitor suppression creates more favorable auction conditions.

    Long-Term Brand Quality Signaling

    Amazon’s algorithm evaluates listing quality as an input to organic search ranking. Listings with consistently high image quality scores, stable compliance status, and strong click-through and conversion metrics are treated as higher-quality results and are rewarded with ranking advantages over time. The brands that build and maintain genuinely compliant, high-quality image assets aren’t just avoiding suppression — they’re accumulating a sustained ranking advantage that compounds over time relative to competitors who manage compliance reactively.

    This is the less-discussed dimension of image compliance investment: it’s not purely defensive. Done well, it’s an offensive capability that builds durable organic rank advantages and reduces the cost of maintaining visibility in competitive categories.

    Putting It Together: The 2026 Portfolio Protection Framework

    The operational reality that sellers need to internalize is that image compliance in 2026 is a permanent, ongoing cost of doing business on Amazon — not a one-time setup task. The brands that are building suppression-resilient catalogs are doing so through systems, not through one-off audits. Here’s the framework that holds up:

    Layer 1: Prevention (Pre-Launch QA)

    Every image that enters the catalog passes through a documented, category-aware technical checklist before upload. No exceptions for time pressure, budget constraints, or “this one looks fine.” The checklist covers RGB background verification, frame fill measurement, element audit, shadow check, resolution confirmation, and accuracy verification against the physical product. This layer eliminates preventable suppression events before they happen.

    Layer 2: Protection (Asset Control and Brand Registry)

    Catalog lock is applied to every high-revenue branded ASIN via Brand Registry. Approved images are stored in a version-controlled asset library with documented metadata. Brand Registry’s monitoring tools are configured to alert for unauthorized content changes. This layer eliminates the hijacking-based suppression category.

    Layer 3: Detection (Continuous Monitoring)

    Daily account health checks, weekly image integrity verification for high-value ASINs, and quarterly full-catalog compliance audits form a monitoring cadence that catches enforcement issues as early as possible. Automated alerts from Seller Central integrations reduce detection latency. This layer minimizes the duration of any suppression events that do occur despite prevention and protection efforts.

    Layer 4: Recovery (Rapid Remediation)

    Pre-prepared compliance-ready backup images for all high-revenue ASINs enable same-day replacement when suppression occurs. A documented escalation process — who does what, in what order, using which tools — means the response to a suppression event is a procedure rather than a crisis. This layer minimizes the organic rank and revenue loss from unavoidable suppression events.

    Together, these four layers create a portfolio-level system that doesn’t eliminate suppression risk entirely — Amazon’s enforcement environment is too dynamic for absolute guarantees — but that dramatically reduces both the frequency and the duration of suppression events, and positions compliant brands to capture competitive advantage when the market around them is affected by enforcement actions they’re protected against.

    Key Takeaways

    • Suppression is now retroactive and portfolio-wide. Images that passed upload checks months ago can be re-flagged during automated re-audit sweeps. Treating compliance as a launch-day task is no longer adequate.
    • The six most dangerous non-obvious triggers are off-white backgrounds that look white, product shadows, props not included in the sale, hidden watermarks, post-compression resolution failures, and composite/inset images in the main slot.
    • The cascade from a single suppressed ASIN can destroy organic rank, pause ad delivery, disrupt variation family performance, and generate account health flags — all from one non-compliant image.
    • Category-specific rules are where experienced sellers get surprised. Apparel, electronics, grocery, and children’s products all carry additional image requirements that generic compliance guides don’t fully address.
    • AI-generated images are allowed but not safe by default. The accuracy requirement applies equally to AI-generated imagery — synthetic images that don’t accurately represent the physical product are a misrepresentation violation, not just a technical one.
    • Image hijacking is a suppression risk you didn’t create but are responsible for recovering from. Catalog lock via Brand Registry is the operational control that prevents it.
    • Four-layer portfolio protection — prevention, protection, detection, and recovery — is the operational framework that makes suppression management systematic rather than reactive.
    • Compliance is competitive advantage. Every competitor suppression event is an organic rank and ad auction opportunity for brands that remain visible and compliant.