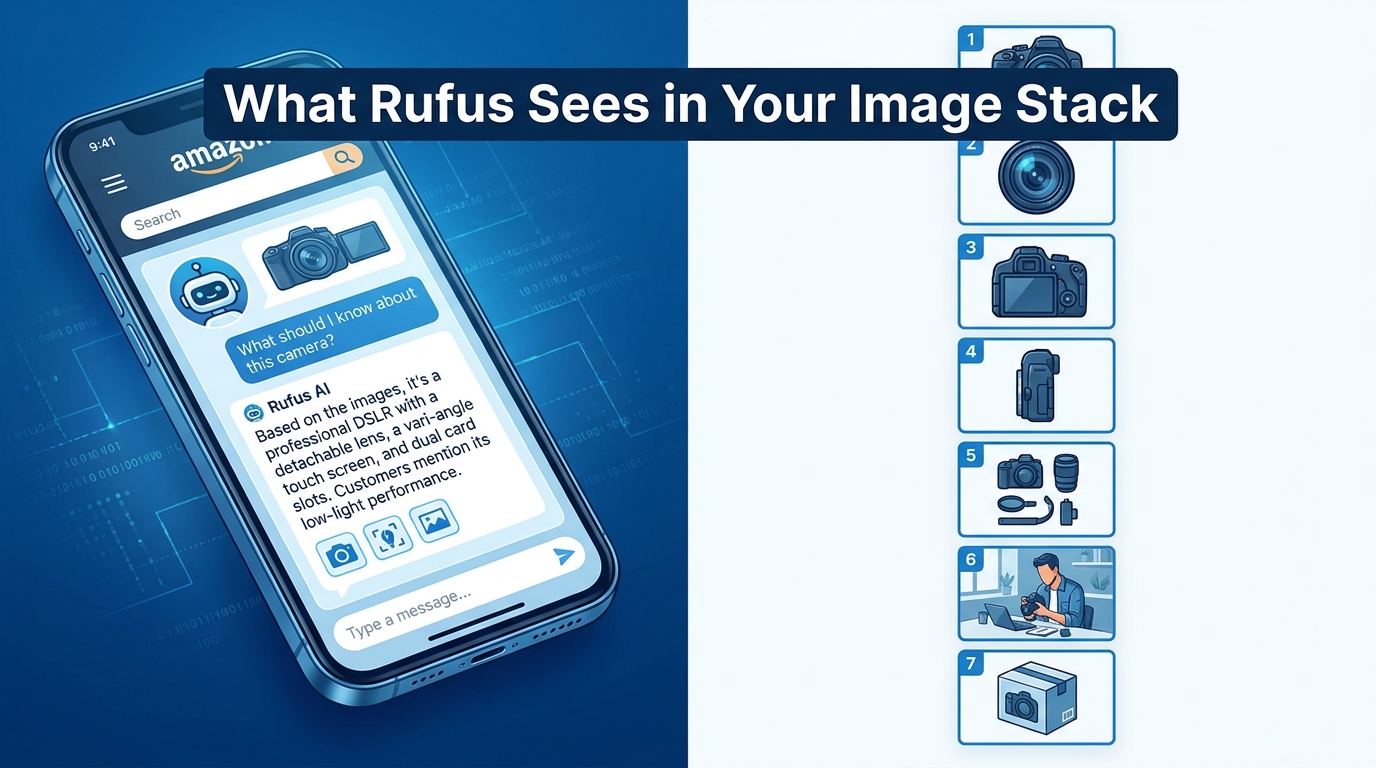
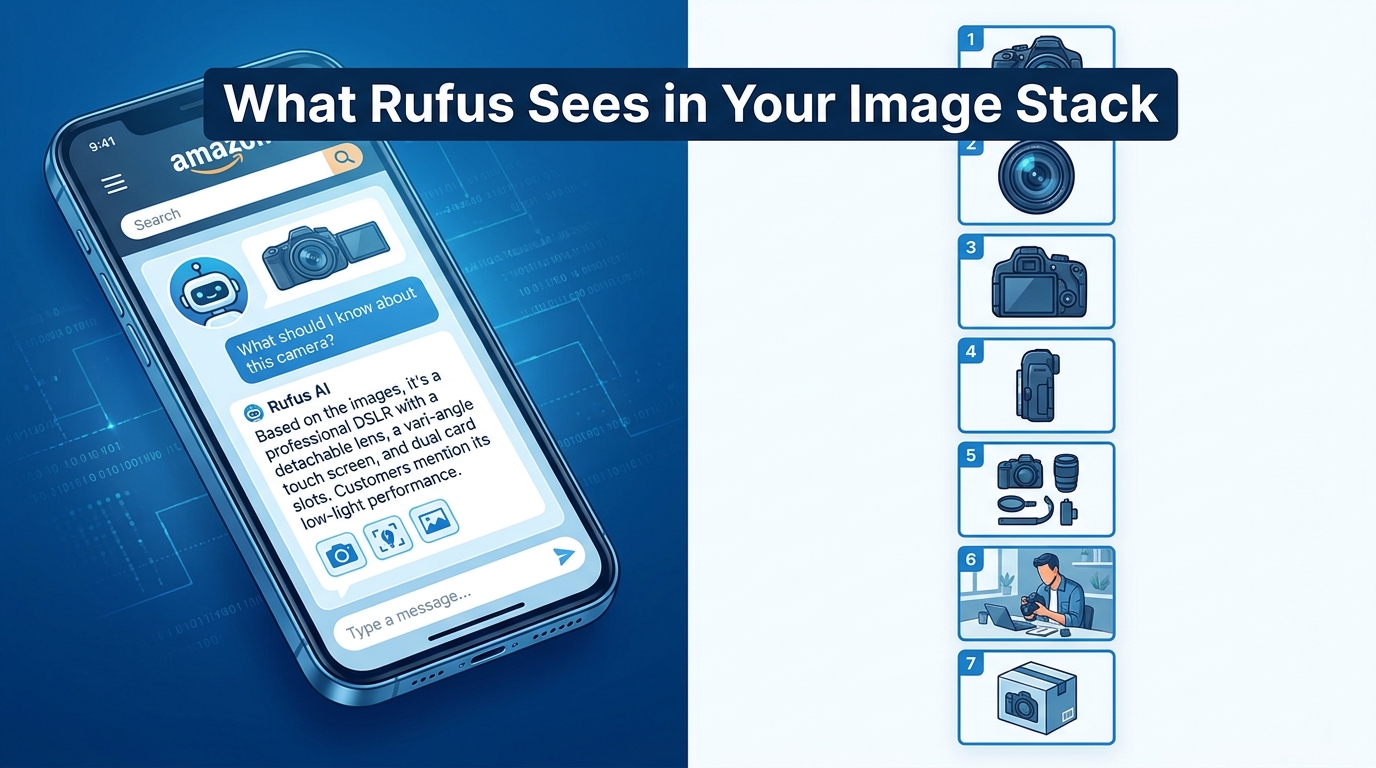
There’s a quiet assumption baked into most Amazon image strategies: images are for humans. You shoot a clean hero, drop in some lifestyle photos, maybe add a spec callout or two, and call it a complete listing. The buyer scrolls through, decides they like what they see, and clicks Add to Cart. Job done.
That model worked fine for keyword-driven search. It’s increasingly wrong for the way Amazon’s AI surfaces and recommends products in 2026.
Amazon’s Rufus — now integrated into the broader Alexa for Shopping experience — handles roughly 274 million queries per day and has driven an estimated $10 billion in incremental annualized sales. It doesn’t browse listings the way a shopper does. It parses them. It reads your image text through OCR. It classifies lifestyle context through computer vision. It generates embedding vectors from your visuals and matches them against what shoppers describe in natural language. And then it decides whether your product is worth surfacing in a conversational recommendation — or quietly skipping.
Most image stacks aren’t built for that. They’re built for a human browsing session, laid out in a sequence that feels intuitive to a product photographer but communicates almost nothing to a multimodal AI model trying to answer “What’s a good BPA-free water bottle for hiking that fits in a cup holder?”
This piece isn’t about making your images prettier. It’s about understanding what Rufus and Catalog Intelligence 2.0 actually extract from your visual stack — and restructuring your images so that extraction produces the right signals. Frame by frame.
The Shift Nobody Announced: From Keyword Matching to Visual Embeddings
Amazon didn’t publish a changelog when it started treating images as structured data. There was no seller announcement, no help doc update, no Seller Central notification. The shift happened gradually — and then, with the June 2026 rollout of Catalog Intelligence 2.0, significantly all at once.
To understand why this matters, it helps to understand what changed architecturally. Before Catalog Intelligence 2.0, Rufus primarily relied on three data sources to match products to conversational queries: listing text (titles, bullets, descriptions), customer review language, and structured catalog attributes (brand, category, dimensions, material). Images were decorative — included in the listing but not meaningfully parsed for discovery purposes.
The Three-Layer Stack Now Running Under the Hood
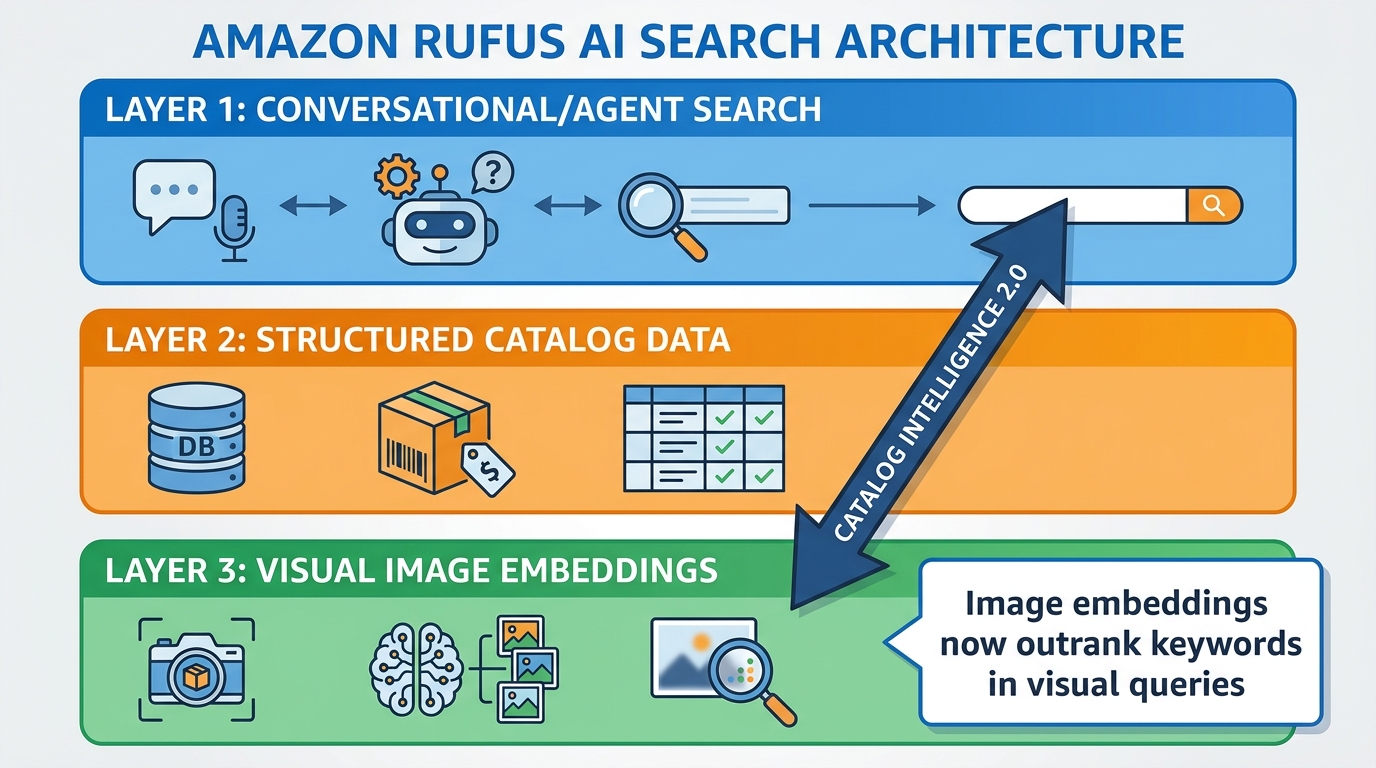
Catalog Intelligence 2.0 introduced a fundamentally different architecture. Rather than treating product matching as a text retrieval problem, Amazon now runs three parallel layers:
- Conversational/Agent Layer: This is the Rufus interface itself — the natural language understanding engine that processes shopper questions and determines intent. “What sunscreen won’t break me out?” is matched to product attributes using semantic understanding, not keyword presence.
- Structured Catalog Layer: Traditional catalog data — category, attributes, ASINs, parent-child relationships, brand registry data. This is the backbone of how products are filed and retrieved.
- Visual Similarity Layer: The new addition. Image embeddings — dense numerical vectors generated from your product photos — are used for grouping, similarity matching, and visual retrieval. When a shopper uploads a photo to Amazon Lens, or when Rufus tries to find “something that looks like this but comes in black,” the visual layer takes precedence.
The critical implication: image embeddings now influence product retrieval in ways that are completely decoupled from your text copy. A listing can have perfectly optimized bullet points and still rank poorly in visual queries because the images themselves don’t communicate the right signals to the embedding model.
What “Image Embeddings” Actually Means in Practice
An image embedding is a compressed mathematical representation of visual content. When Amazon’s models process your product photo, they’re not saving the pixels — they’re generating a vector that encodes what the image represents: shape, color, texture, context, objects in the scene, spatial relationships, and yes, any text that appears in the frame.
These vectors are then stored and compared. A shopper describing “a minimalist matte black desk lamp that’s adjustable” generates a query embedding. Amazon’s retrieval system finds ASINs whose image embeddings are closest to that query vector. If your lamp’s images show a cluttered workspace, heavy shadows, and no clear demonstration of the adjustable arm, your embedding won’t match — even if your bullet points say “minimalist, matte black, adjustable” three times.
This is the core mechanic most sellers are missing: what your images say visually now determines whether you appear in AI-driven searches, independent of what your text copy says.
How Rufus Processes an Image (Step by Step)
Understanding the processing pipeline helps you make better creative decisions. Rufus doesn’t evaluate your image stack the way a shopper scrolls through it. It runs multiple passes, each extracting different data.
Pass 1: Object and Category Recognition
The first pass identifies what category of product is in the image and extracts primary attributes: product type, dominant colors, visible materials, approximate dimensions relative to context objects. This is where your hero image does its heaviest lifting. A clean white background isn’t just a visual convention — it removes noise from this classification step. Background objects, shadows, and clutter introduce competing signals that degrade classification confidence.
At this stage, Amazon’s vision model is answering: “What kind of product is this, and what are its primary visible attributes?” The cleaner and more unambiguous your main image, the higher the confidence score on this classification — which correlates directly with how accurately your product is indexed and grouped.
Pass 2: Context and Use-Case Extraction
Secondary images are analyzed for scene context. A product photographed in a kitchen registers differently from the same product on a hiking trail. This context isn’t decorative — it’s used to answer questions like “Is this appropriate for outdoor use?” or “Would this work in a home office?” without requiring that information to be explicitly stated in your bullet points.
This is the pass where lifestyle images contribute to discovery. A running shoe photographed only on a white background misses the opportunity to register “outdoor running” as a contextual signal. The same shoe photographed on a trail, in motion, in natural lighting generates a context embedding that ties it to queries about trail running, outdoor footwear, and active lifestyle categories.
Pass 3: OCR — Reading Your Image Text
This is arguably the most underutilized signal in most image stacks. Amazon’s OCR pipeline reads text that appears in your product images — callout boxes, spec tables, feature annotations, claim headers — and adds that text to the product’s indexed data. This is separate from and additive to your listing copy.
A feature callout saying “48-Hour Battery Life” in your infographic frame is read as text, indexed, and can influence whether your product surfaces for conversational queries like “wireless headphones that last more than two days.” If that claim only appears in your bullets and not in your images, you’re getting half the signal strength you could have.
Pass 4: Semantic Consistency Check
Perhaps the most sophisticated pass: Rufus cross-references what it extracts visually against what your listing copy claims. Misalignment between the two — products that appear to be one thing in images but are described differently in text — lowers confidence scores and can suppress your listing in AI-driven placements. This is partly a quality signal, and partly a trust/accuracy signal that feeds into how reliably Amazon thinks your listing represents the actual product.
The Conversion Data Behind Rufus-Optimized Stacks
None of this optimization work matters if it doesn’t move conversion. Fortunately, the data is compelling — though it requires some context to interpret correctly.
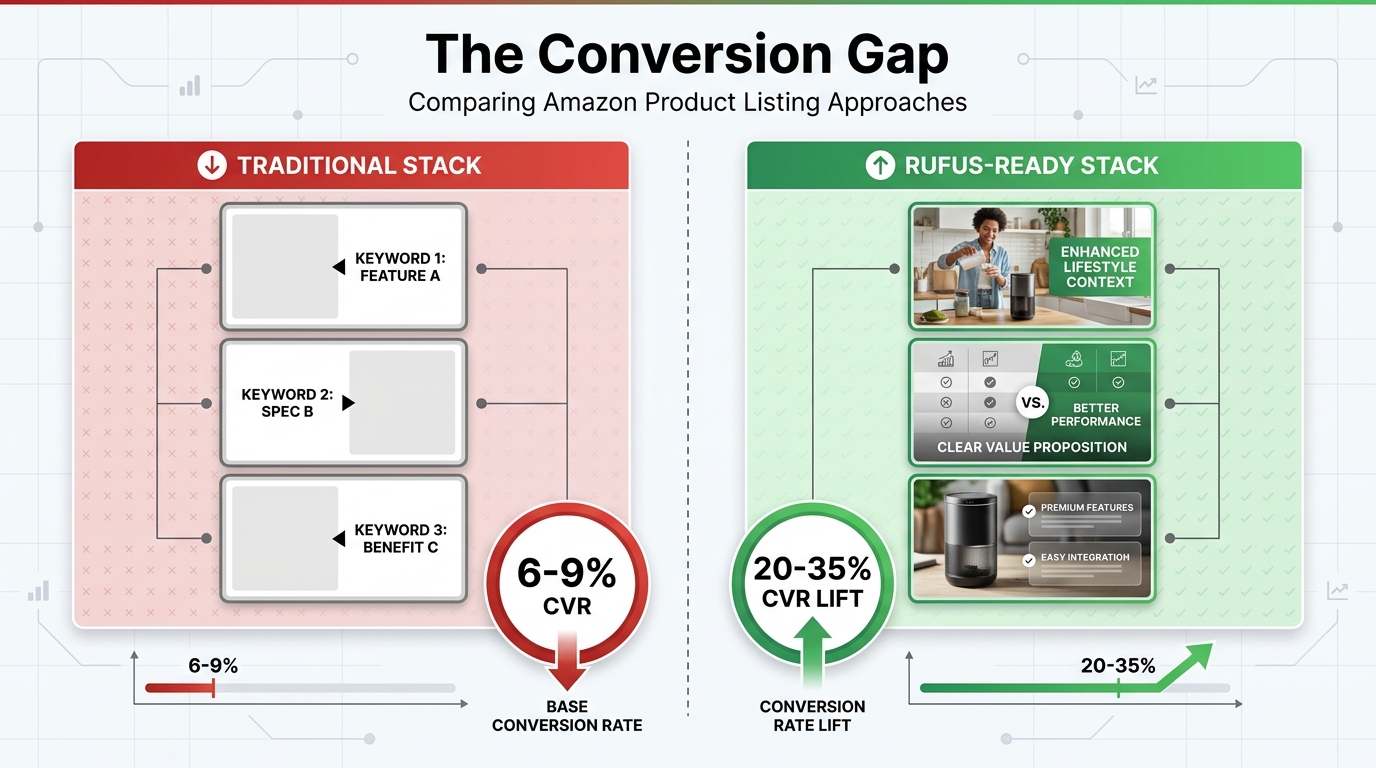
Rufus-engaged shoppers convert at roughly 2.7x the rate of non-Rufus shoppers. Sessions where Rufus is actively involved in the discovery path show conversion rates in the 8–14% range, compared to the 6–9% baseline for traditional search. For products with fully optimized visual stacks, practitioners report conversion lifts in the 20–35% range versus listings with minimal or unstructured images.
Why the Lift Is So Large
The magnitude of the conversion lift is worth examining. A 20–35% CVR increase from image optimization alone is a substantial number — larger than most A/B tests on copy variations or pricing experiments. There are two mechanisms driving it.
First, Rufus-engaged shoppers have higher purchase intent to begin with. They asked a specific question, got a curated answer, and your product was surfaced as relevant to that specific need. You’re not just getting a browse — you’re getting a qualified referral. When someone lands on your listing because Rufus told them “this matches what you described,” they arrive pre-sold on the category fit.
Second, a well-structured image stack does conversion work that your text copy can’t fully replicate on mobile. With more than 70% of Amazon traffic now mobile, shoppers frequently scan images before reading a single bullet. A stack that visually communicates use case, scale, key features, and differentiation in the first three frames converts shoppers who never scroll to your bullets. The image stack is doing independent conversion work — and Rufus optimization forces you to build stacks that are genuinely information-dense, which benefits human shoppers too.
The Visibility Prerequisite
It’s important to be precise about causality here. Image optimization doesn’t guarantee a conversion lift in isolation — it first has to generate a discovery lift. A beautifully optimized stack on a suppressed or low-visibility listing will show minimal conversion improvement because the traffic volume is too low to move the needle.
The sequence is: better image embeddings → improved AI-driven discovery → higher-quality traffic → elevated conversion rate → stronger sales velocity → improved organic ranking. Each step depends on the previous one. Sellers who report the largest lifts from visual stack optimization are typically those who saw meaningful increases in impressions from Rufus-driven placements first, followed by the conversion rate improvement on that incremental traffic.
The 7-Frame Architecture Built for AI Parsing
Amazon allows up to nine images in most categories. Most sellers use somewhere between four and six. The research consistently points to seven as a high-performing configuration — enough to cover each functional category of visual information without padding the stack with redundant shots that dilute signal quality.
Here’s how a Rufus-ready 7-frame stack should be structured, and why each position exists.
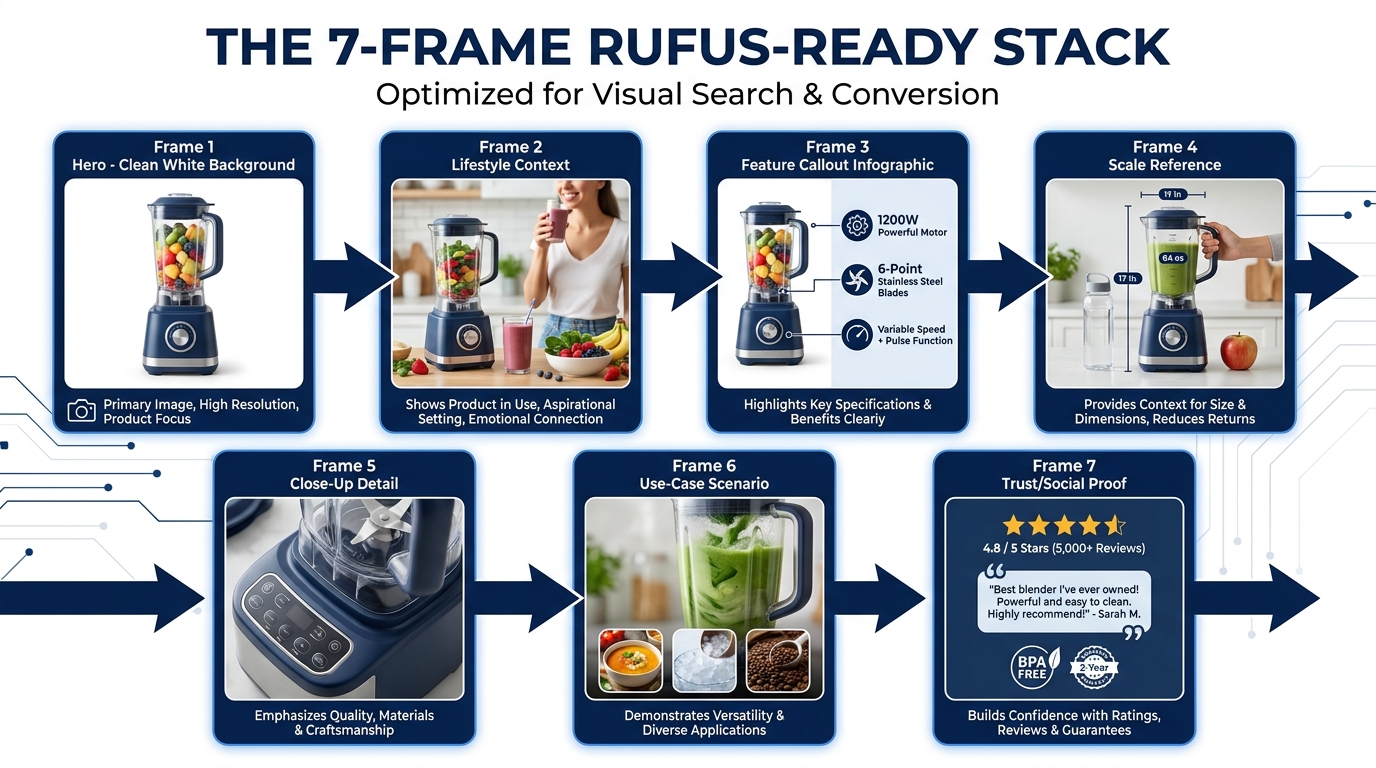
Frame 1: The Compliance Hero
This is non-negotiable: pure white background (RGB 255,255,255), product filling at least 85% of the frame, no props, no people, no text overlays. Amazon’s main image policy hasn’t changed, and neither has its function. Frame 1 is your classification anchor — the primary input to Amazon’s object recognition pass. Every deviation from compliance introduces noise into that classification step and risks suppression.
Resolution matters here more than most sellers realize. Amazon requires a minimum of 1,000 pixels on the longest side to enable zoom, but Catalog Intelligence 2.0 image embedding models produce more accurate, higher-confidence vectors from images at 2,000 × 2,000 pixels or above. Higher resolution gives the model more pixel data to work with, which produces richer embeddings. Shoot at 2,500+ pixels and downscale for upload — don’t shoot at spec.
Frame 2: The Lifestyle Context Shot
This is where most stacks make their first mistake. Convention says Frame 2 is a second angle of the product, still on white. That’s the wrong call for Rufus-era optimization. Frame 2 should establish scene context — where this product lives, who uses it, and in what setting. This is the primary input to Rufus’s use-case extraction pass.
The scene should be unambiguous and specific. “A kitchen” is weaker than “a modern kitchen counter at breakfast time.” “Outdoors” is weaker than “a trail runner on a mountain path.” The more precisely the scene context communicates a specific use case, the more accurately your product gets categorized for related conversational queries. Natural light, realistic settings, and human interaction all strengthen context signal — provided the product remains clearly visible and central to the composition.
Frame 3: The Primary Feature Infographic
Frame 3 carries the heaviest informational load. This is your main OCR-indexed frame — a clean product shot overlaid with callout text highlighting two to four primary features or differentiating claims. The text in this frame is machine-read and indexed as searchable data, so the language matters as much as the design.
Write callouts the way a shopper would ask for them. “BPA-Free” is good. “Dishwasher Safe” is good. “Professional-Grade Stainless Steel” is marginal — it’s a vague claim that doesn’t map well to specific queries. Think about the exact questions shoppers ask Rufus (“Is this safe to put in the dishwasher?”) and write callouts that answer them literally.
Frame 4: The Scale Reference
Size misrepresentation is one of the top return reasons across most categories. A dedicated scale reference frame — showing the product next to a common object (hand, coffee cup, laptop, ruler) — reduces return risk and gives the AI a dimensional anchor for image embedding accuracy. It also directly answers one of the most common conversational queries: “How big is this actually?”
Frame 5: The Close-Up Detail
Material texture, build quality, connection ports, threading, stitching, screen quality — whichever physical detail drives purchase confidence in your category should be isolated here. Close-up shots improve embedding specificity for material and quality attributes, which matters for queries filtering by build quality or material composition (“real leather,” “heavy duty,” “medical grade”).
Frame 6: The Secondary Use-Case Scene
A second lifestyle frame showing a different use scenario broadens the contextual footprint of your listing. If Frame 2 shows the product in a home kitchen, Frame 6 might show it in an office break room or outdoor camping setting. Each distinct use-case scene adds to the contextual diversity of your image embeddings, which increases the range of conversational queries your product can surface for.
Frame 7: The Trust Signal Frame
The final frame should communicate proof — awards, certifications, warranties, compatibility standards, sustainability claims, or a social proof summary (star rating callout, review count). This frame is less about AI parsing and more about finalizing the human conversion journey, but it also provides indexed claim data for certification-specific queries (“FDA approved,” “Certified organic,” “Compatible with Alexa”).
Infographics as Machine-Readable Data — Not Just Design Assets
Most sellers think of infographic frames as visual aids for shoppers who won’t read bullet points. That’s true — but it’s only half the story. In a Rufus-era stack, an infographic frame is also a structured data input for OCR indexing. How you design it determines how much indexed data you’re generating.

The Text Legibility Threshold
Amazon’s OCR pipeline performs significantly better on text that meets specific legibility standards. Minimum effective font size in a 2,000-pixel image is approximately 30 points — smaller text is frequently missed or misread. High contrast between text and background is critical: black on white or white on dark backgrounds produce the most reliable reads. Styled or decorative fonts with unusual letterforms have lower recognition rates than clean sans-serif typefaces.
This isn’t just about design aesthetics — it’s about whether the claims in your infographic actually get indexed. A beautifully designed frame where “Hypoallergenic Formula” appears in a 20pt italic script over a gradient background may look great in the gallery but generate zero indexed text. The same claim in a 36pt bold sans-serif with adequate contrast gets read, indexed, and cross-referenced against conversational queries about hypoallergenic products.
Claim Specificity and Query Matching
The language of infographic callouts should be optimized for the way shoppers phrase queries, not the way marketers write features. There’s an important difference. Marketing language tends toward the aspirational: “Superior Performance,” “Advanced Formula,” “Engineered for Excellence.” Query language is functional and specific: “lasts all day,” “won’t cause irritation,” “fits in a backpack.”
Rufus answers natural language questions. The closer your infographic text matches the natural language patterns shoppers use, the more directly it contributes to query matching. Run your top-performing search terms through a conversational filter — ask yourself how a real person would phrase that need as a question — and rewrite your callouts to match those phrasings where possible.
Spec Tables Versus Feature Callouts
Both work for OCR indexing, but they serve different query types. Spec tables — formatted grids showing dimensions, weight, capacity, voltage, compatibility — are optimized for attribute-specific queries (“What voltage does this run on?” “How much does it weigh?”). Feature callouts are optimized for benefit-driven queries (“Will this fit in a carry-on?” “Is this waterproof?”).
A high-performing infographic frame for complex products often combines both: a feature callout header with a compact spec table below. This satisfies both query types from a single indexed frame and works well for categories like electronics, sporting goods, and kitchen appliances where shoppers ask both types of questions.
Lifestyle Images: Context Signals for Conversational Queries
Lifestyle photography has always served a conversion purpose — showing the product in use creates aspiration and reduces imagination friction. In the Rufus era, it’s doing something additional: providing context embeddings that determine which conversational queries your listing surfaces for.
Scene Composition as Keyword Strategy
Everything in a lifestyle scene generates signal. The demographic of the model using the product suggests who the product is for. The setting establishes use-case context. Props and background objects add category and occasion signals. This means lifestyle scenes should be composed with the same strategic intent as keyword research — because in a multimodal search environment, they’re performing the same function.
Before shooting a lifestyle scene, list the top three to five conversational queries you want your product to surface for. Then ask: does this scene communicate the context, demographic, and use case that a shopper would describe in those queries? If someone asks Rufus for “a gift for a dad who likes camping,” does your camping-adjacent lifestyle scene feature a middle-aged man? If not, you’re missing a demographic context signal that could be generating relevant traffic.
The Difference Between Scene-Rich and Scene-Cluttered
More context is not always better. Lifestyle images that are visually crowded — too many competing objects, overly complex backgrounds, poor product-to-scene ratio — generate noisier embeddings. The AI has more objects to classify, more scene relationships to parse, and a lower confidence score on what the image is actually communicating about the product.
The product should occupy at least 40% of the visual frame in any lifestyle shot. Background complexity should support rather than compete with the product’s visual presence. A single clear contextual message per frame — this product, this setting, this use — outperforms multi-message scenes that try to communicate everything at once.
Mobile-Optimized Composition
With over 70% of Amazon sessions happening on mobile, lifestyle images need to read clearly at 375–414 pixels wide — typical smartphone screen widths. This means foreground subjects should be large enough to be recognizable at thumbnail scale, text overlays (if any) should be readable without zooming, and the primary subject should be unambiguous in the first half-second of viewing.
A useful test: view all your images in the Amazon app at natural scroll speed. Whatever you can’t process in roughly one second per frame is too visually complex for the average mobile browsing session. Simplify compositions until each image communicates its primary message at a glance.
The OCR Factor: Writing Image Text That AI Can Read and Index
OCR indexing through product images represents one of the clearest, most actionable opportunities in current Amazon optimization — and it’s almost entirely overlooked. The mechanism is straightforward: Amazon reads text in your images, indexes it, and uses it to match your listing to relevant queries. But getting that mechanism to work reliably requires understanding its constraints.
What Gets Read and What Gets Missed
Amazon’s OCR pipeline performs well on standard Latin characters in common typefaces at adequate size and contrast. It struggles with: stylized or script fonts, text on complex or gradient backgrounds, text rotated beyond approximately 15 degrees from horizontal, text smaller than roughly 30pt in a 2,000px frame, and text that overlaps with the product itself in ways that create visual interference.
A practical approach: for any text claim you want indexed, test it by photographing the image at a reasonable distance, then running a standard OCR tool (Google Vision, AWS Textract, or similar) against the exported JPG. If a standard commercial OCR tool misreads or misses your text, Amazon’s pipeline likely will too. Fix legibility issues before uploading.
The Additive Indexing Benefit
The reason OCR indexing is so valuable is that it’s additive to your listing text. You’re capped on bullet point space. Your title has character limits. Your product description can only say so much before it becomes walls of text that shoppers won’t read. Your image text has no direct character limits (beyond practical legibility), and it indexes as additional data for your listing’s search profile.
A listing with seven infographic-rich images can effectively double or triple the amount of indexed claim text associated with the ASIN compared to a listing relying only on text copy. For competitive categories where the top ten listings share similar keyword coverage in their text fields, that additional indexed image text can provide meaningful differentiation in AI-driven matching.
Consistency Between Image Text and Listing Copy
Amazon’s semantic consistency check — the fourth processing pass described earlier — compares what image OCR extracts against listing copy. Claims that appear in images but nowhere in your listing text aren’t necessarily problematic, but claims that contradict your listing text or appear only in images with no supporting copy create lower confidence scores in cross-modal validation.
Best practice: every claim in your infographic text should be reflected somewhere in your listing copy, even if not in identical language. “48-Hour Battery Life” in your infographic should be supported by at least a mention of battery duration in your bullets or description. This reinforces the consistency signal and ensures both text and image data point in the same direction for the claims you most want matched.
A+ Content and the Metadata Layer Rufus Also Reads
The image stack in the main gallery isn’t the only visual layer Rufus processes. A+ Content — enhanced brand content below the fold — contains its own set of images, and those images come with an often-ignored feature: alt text fields.
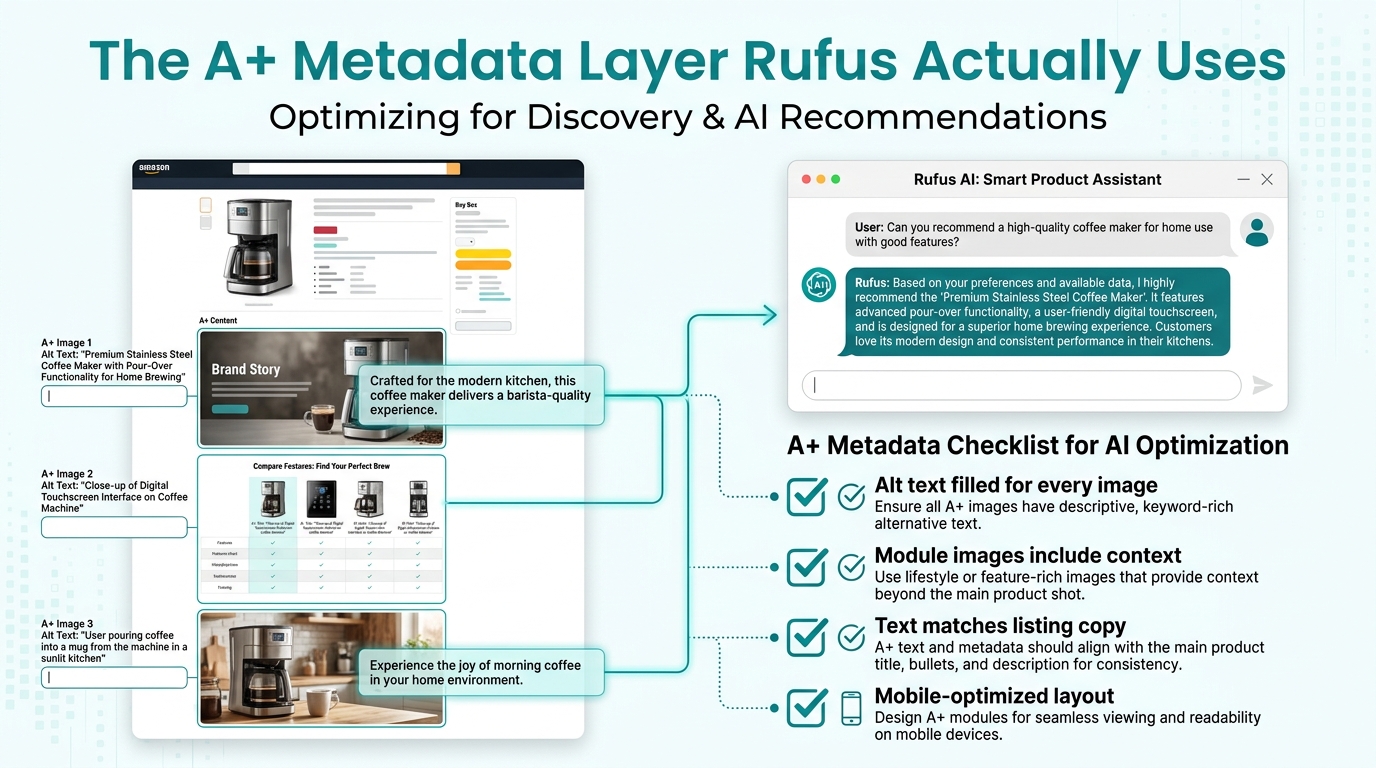
A+ Alt Text: The Least-Used Optimization in Seller Toolkits
Every image module in Amazon’s A+ Content builder has an alt text field. The vast majority of sellers either leave these blank or fill them with generic placeholders like “product image 1.” This is a significant missed opportunity.
Alt text in A+ Content modules is indexed by Amazon’s search and AI systems. It’s essentially free structured text tied directly to specific visual contexts. A 150-character alt text description for a comparison chart image — “Comparison table showing Model X at 48-hour battery life, 32oz capacity, and waterproof IPX7 rating versus competitor models” — adds indexable claim data that neither your main listing text nor your gallery images may cover.
The framework for writing effective A+ alt text: describe what the image shows (the visual content), what it demonstrates (the product attribute or claim being communicated), and why it matters to the shopper (the benefit or use case). This three-part structure ensures the alt text contributes to discovery, conversion, and accessibility simultaneously.
Module Structure and the AI Reading Order
Amazon’s A+ module templates have different visual layouts, but they all share one common characteristic from a data perspective: the text fields and alt text fields associated with each module are processed in order, creating a sequential narrative that Amazon’s AI can follow. The order in which you present modules matters — not just visually, but structurally.
A+ modules should follow the same information architecture logic as your main image stack: lead with use-case context, progress through feature specifics, provide comparison data mid-way, and close with trust and brand signals. This creates a coherent narrative that the AI can follow and summarize — which matters because Rufus sometimes generates product summaries from A+ content for conversational responses.
Premium A+ and Video Consideration
Premium A+ content (available to brand-registered sellers who meet eligibility thresholds) includes additional module types, including video embeds, interactive hotspot images, and comparison carousels. From a Rufus optimization perspective, these are valuable primarily because they increase the amount of parseable, indexable content below the fold.
Video in A+ is worth special attention: Amazon can extract both visual frames and audio transcriptions from embedded product videos, adding another data layer. A product demonstration video with clear narration — “I’m placing the 32-ounce bottle upside down to show the leak-proof seal” — generates both visual scene context and indexed text from the transcript. Sellers in competitive categories with strong Premium A+ programs are building meaningful informational advantages that pure text or gallery optimization can’t replicate.
Testing Your Stack for Rufus Readiness — A Practical Audit Framework
Optimization without measurement is just guesswork. Here’s a structured approach for auditing your existing image stacks and prioritizing improvements.
The Five-Question Audit
Run each ASIN’s image stack through these five questions before deciding what to change:
- Does Frame 1 meet technical compliance without ambiguity? Pure white background, 85%+ product fill, minimum 2,000px resolution, no text or props. If not, this is your first fix — gallery suppression or deprioritization in object classification costs everything downstream.
- Do Frames 2–6 collectively cover all major use cases for this product? Map each frame to a specific query type: demographic use, setting context, feature claim, dimensional reference, material quality. Missing categories mean missing query coverage.
- Is every text claim in your infographic frames readable by a standard OCR tool? Export your infographic frames as JPGs and test them. Fix legibility issues before worrying about anything else in the infographic design.
- Is there semantic consistency between your image text and listing copy? Every claim in your images should have a corresponding mention in your text fields. Identify gaps and patch them in bullets or description.
- Are your A+ alt text fields populated with descriptive, claim-specific content? If not, this is often the fastest, lowest-effort optimization available — it requires no reshooting, no design work, just writing.
Using Rufus Itself as a Diagnostic Tool
One of the most underused testing approaches is simply asking Rufus (now Alexa for Shopping) about your own products. Log in with a test account, open the AI assistant, and ask the kinds of questions your target shoppers would ask. Does your product surface? What does Rufus say about it? Does its summary accurately reflect your key claims, or does it describe your product in ways that suggest the AI parsed it differently than you intended?
Pay attention to which features Rufus mentions in product summaries. Those are the signals it successfully extracted from your listing and images. Features it doesn’t mention — even if they’re prominent in your bullets — may indicate extraction failures that image optimization can address. This diagnostic approach can reveal specific gaps much faster than broad optimization testing.
Prioritizing Changes by Impact
Not all image stack changes deliver equal ROI. In order of expected impact based on available practitioner data:
- Hero image compliance and resolution upgrade — Highest impact, affects all downstream AI processing.
- OCR legibility fixes on existing infographic frames — High impact, low cost, no reshooting required.
- A+ alt text completion — High impact, zero cost, purely a writing task.
- Moving lifestyle context to Frame 2 — Medium-high impact, may require reshooting or reordering.
- Adding missing use-case frames — Medium impact, requires new photography.
- Claim language optimization in infographic text — Medium impact, requires design iteration.
Start with the highest-impact, lowest-cost interventions. Items 1–3 can often be completed without any new photography, making them week-one priorities. Items 4–6 require production investment but deliver the most significant long-term improvement to AI-driven discovery.
What This Means for Product Launch Strategy
The implications of Rufus-era image optimization extend beyond existing listings. For new product launches, the image stack is now a pre-launch strategic asset — not a post-launch optimization task.
Building the Stack Before the Shoot
The most efficient approach for new launches is to define your image stack architecture before booking the photo shoot. Identify which queries you want to surface for. Map those queries to scene contexts, feature claims, and demographic signals. Then brief your photographer on specific scenes, compositions, and prop requirements derived from that query mapping — not from generic “Amazon photography best practices.”
This reverses the traditional workflow where photography happens first and then gets optimized for listing requirements. In a Rufus-optimized workflow, listing requirements (specifically, AI query coverage) drive photography briefs. The difference in outcomes is substantial: a photographer briefed to “shoot lifestyle scenes that answer specific shopper questions” will produce very different images than one briefed to “shoot the product in use.”
Category-Specific Stack Considerations
Different product categories have different AI parsing priorities. In electronics, spec legibility and compatibility signals dominate — a buyer asking “Does this work with my MacBook?” needs to find that compatibility claim in your image text. In apparel, fit, material, and styling context matter most — lifestyle scenes need to communicate how the item looks on real bodies in real settings. In supplements and health products, certification and ingredient claim visibility is primary — “Third-party tested,” “No artificial colors,” “NSF certified” need to be OCR-indexed and not just buried in description copy.
Audit the top-performing listings in your category (not your current competitors — the category leaders) and analyze what their image stacks are doing. What types of claims appear most consistently in infographic frames? What scene contexts do their lifestyle images share? What trust signals appear in Frame 7? This competitive visual analysis will give you a category-specific optimization template that goes beyond generic best practices.
Conclusion: Your Image Stack Is a Data Structure, Not a Photo Gallery
The fundamental shift Rufus and Catalog Intelligence 2.0 require is a change in how you think about product images. A gallery is passive — it waits for a shopper to scroll through it and decide whether the product looks appealing. A data structure is active — it communicates specific signals to an AI system that uses those signals to match your product to shopper queries you may never see directly.
Sellers who continue to build image stacks as galleries will see increasing marginalization in AI-driven discovery. Sellers who rebuild their stacks as structured visual data — with each frame serving a specific parsing function, text claims optimized for OCR legibility and query matching, lifestyle context deliberately mapped to target queries, and A+ metadata populated with indexed claim text — are building a compounding advantage in how Rufus surfaces and recommends their products.
The 274 million daily Rufus queries aren’t going away. The $10 billion in incremental sales they represent will flow disproportionately to listings that communicate clearly to AI — not just to shoppers. The conversion data is clear: Rufus-engaged sessions convert at 2.7x the baseline rate, and optimized stacks drive 20–35% CVR lifts on top of that. The only question is whether your image stack is earning those recommendations or being quietly skipped.
Actionable Takeaways
- Audit Frame 1 for compliance and resolution first. Everything downstream depends on accurate object classification. Upgrade to 2,500px minimum and ensure pure white background compliance.
- Move lifestyle context to Frame 2. Scene context extraction happens early in the processing pipeline. Don’t waste that position on a second angle shot.
- Test all infographic text with a commercial OCR tool before uploading. If it can’t be read by standard OCR, Amazon’s pipeline likely misses it too.
- Write infographic callouts in query language, not marketing language. Think “How would someone ask for this feature in a Rufus chat?” and write to match.
- Complete every A+ alt text field with descriptive, claim-specific copy. It’s the fastest, zero-cost optimization currently available and almost universally neglected.
- Audit your own ASINs through Rufus/Alexa for Shopping. What Rufus says about your product tells you exactly what signals it successfully parsed — and what it missed.
- Brief photography shoots from query mapping, not generic best practices. Build the stack architecture before the shoot, not after it.
The image stack has always been a conversion asset. In 2026, it’s also a discovery asset, a data structure, and increasingly, the primary input to AI-driven product matching. Build accordingly.