Most Amazon advertisers treat Sponsored Brands Video the way they treat a TV commercial: months of planning, one big production, one polished asset, and then hope. They spend weeks refining a single concept, film it once, launch it carefully, and then watch it slowly plateau. When the CTR starts sliding three months later, they circle back to the creative discussion — and the cycle restarts.
That model is not wrong because it values quality. It is wrong because it confuses quality with singularity. The assumption buried inside it — that one great video is better than ten testable ones — is exactly backwards from how Amazon’s ad auction actually rewards creative.
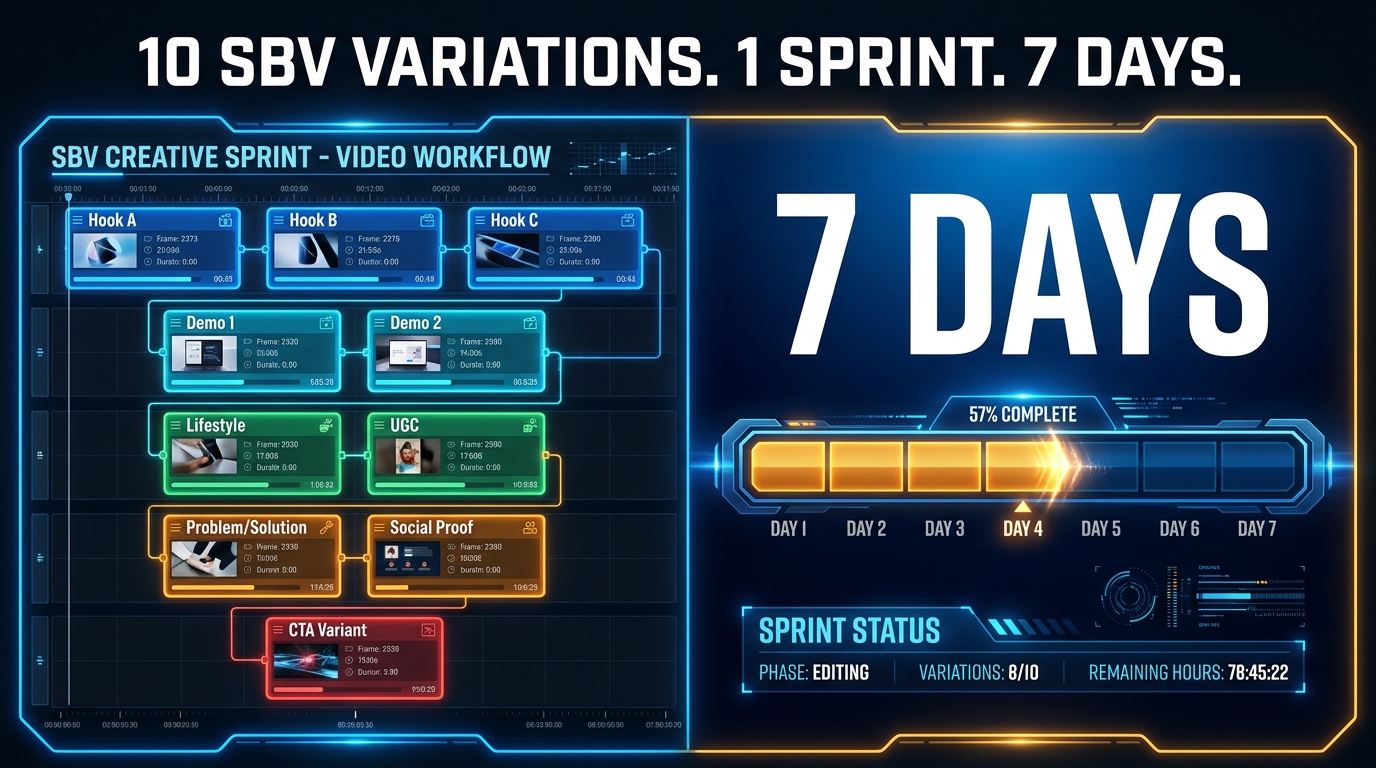
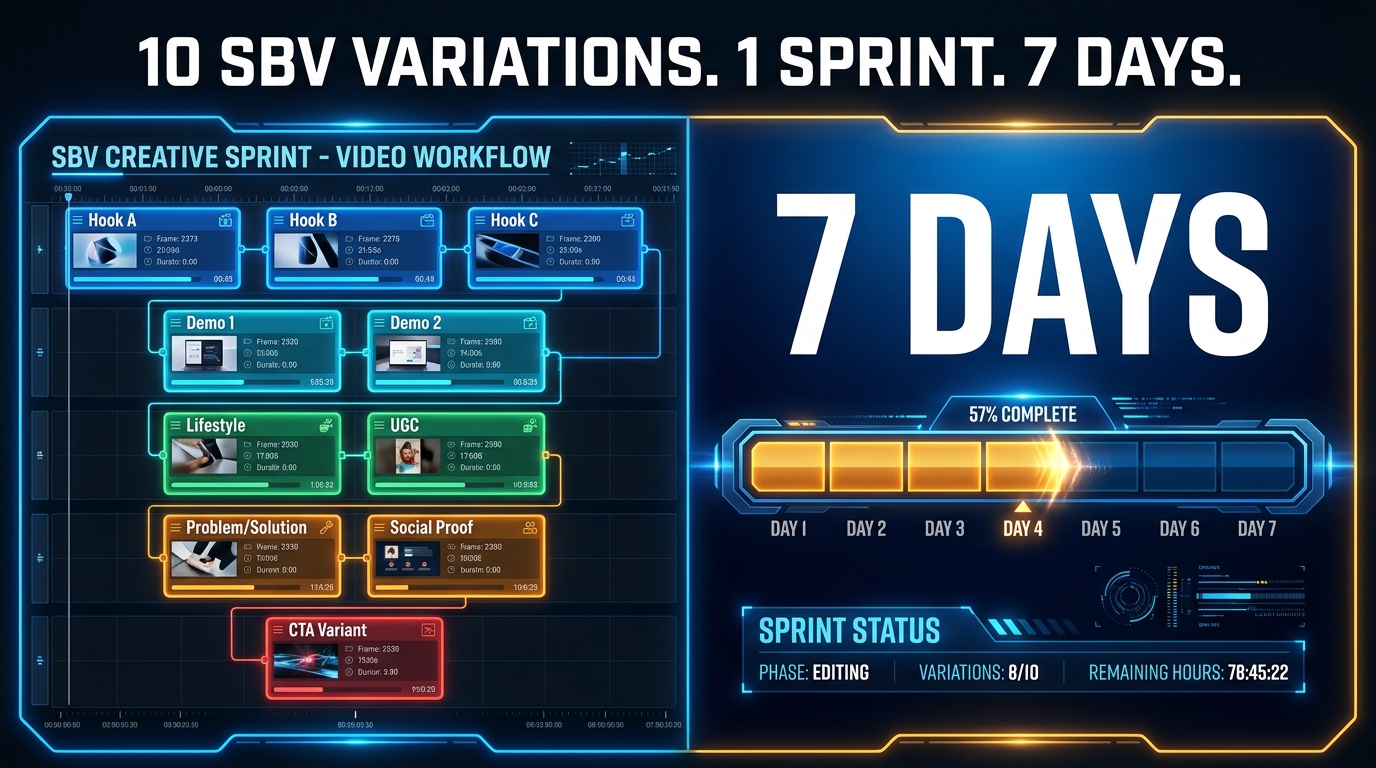
The brands quietly outperforming their categories in 2026 are not making one great SBV. They are running creative sprints: structured, repeatable, seven-day workflows that produce ten distinct video variations from a single asset bank, launch them simultaneously, read the performance signal, and use it to inform the next sprint. They are treating Sponsored Brands Video as a data-generating machine, not a finished product.
This post lays out precisely how that works — the sprint structure, the ten variation angles worth testing, the variable isolation logic that keeps your data readable, and the team setup that makes this repeatable rather than a one-time scramble. If you have ever felt like your SBV program was stuck, this is why, and here is what to do about it.
What Makes SBV the Highest-Leverage Ad Format on Amazon Right Now
Before designing a sprint, it helps to understand why Sponsored Brands Video commands this level of attention in the first place. The format earns it on the data alone.
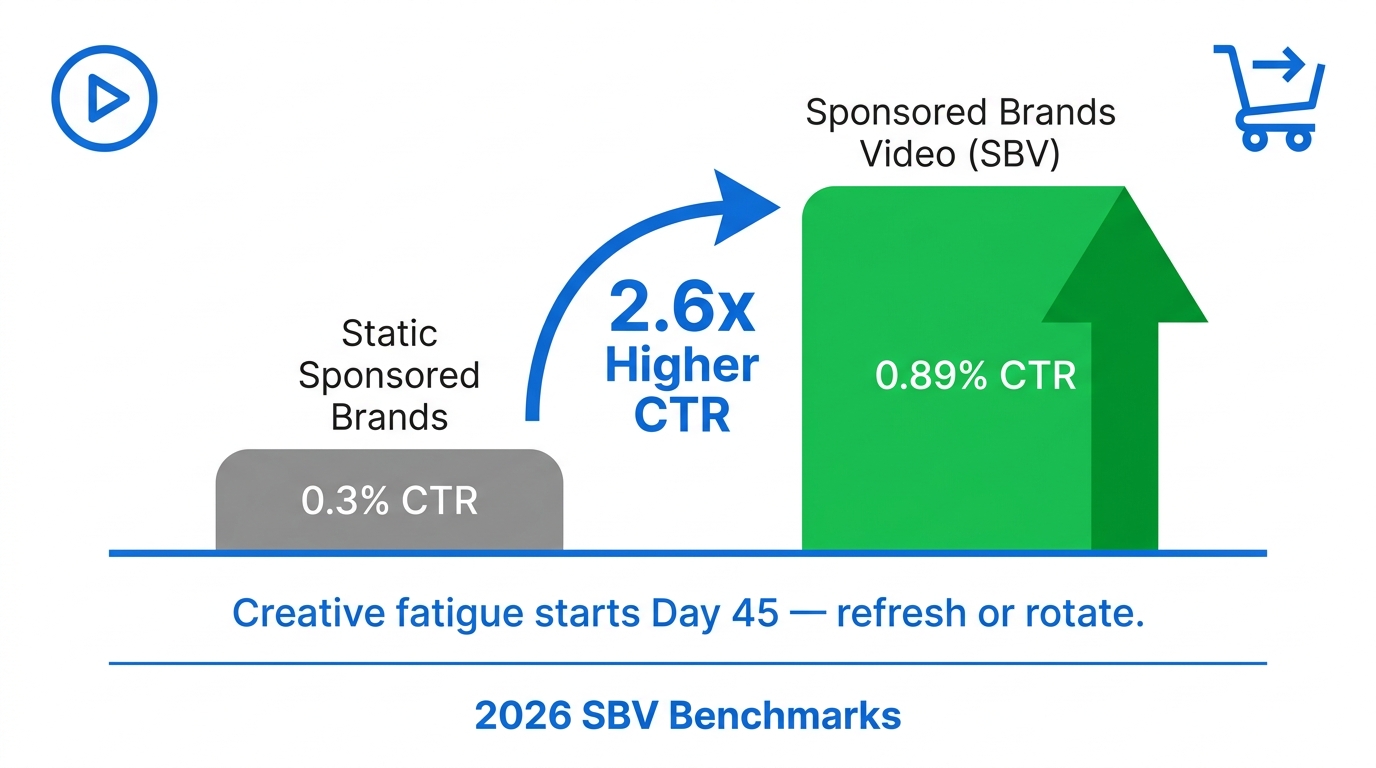
Across 2026 benchmark aggregations, SBV is delivering CTRs in the range of 0.6% to 1.0%, with well-optimized creatives frequently hitting 1.0% or above. Compare that to static Sponsored Brands, which typically sits between 0.20% and 0.40%. The gap — roughly 1.6x to 2.6x — is not a rounding error. At that magnitude, the format difference alone can determine whether your product lands on a shopper’s shortlist or gets scrolled past entirely.
Why the Gap Exists
Amazon’s search results pages are dense. Dozens of products compete for attention in static grids of images and price points. SBV breaks that pattern at the placement level. It moves. It occupies screen real estate differently. And critically, it communicates product value within the first few seconds in a way that a hero image — however optimized — simply cannot replicate.
A customer scrolling for a portable blender can see a product image and infer roughly what it is. A well-executed SBV shows the blender in action, communicates noise level through a visual metaphor, demonstrates cleanup in three seconds, and delivers a headline message — all before a shopper has consciously decided whether to engage. That compression of information is why the CTR delta exists.
The Conversion Signal Matters Too
CTR is the attention metric, but the downstream signal is just as compelling. SBV campaigns in 2026 are associated with conversion rates in the range of 6% to 11% depending on category — noticeably higher than formats that send shoppers to a detail page cold. The video pre-qualifies intent. Shoppers who click through after watching even a few seconds of SBV tend to have a clearer idea of what they are buying, which reduces abandonment.
For high-consideration products — anything with a learning curve, a specific use case, or a strong size/fit dimension — this pre-qualification effect is especially significant. The video does part of the detail page’s job before the shopper even arrives.
SBV in the Auction Context
There is also an auction-level advantage worth noting. Amazon’s ad auction rewards relevance, and CTR is one of the signals used to assess it. A creative that consistently earns a higher click-through rate effectively lowers your cost per click over time, because the algorithm interprets high CTR as a relevance signal and adjusts accordingly. Running SBV is not just a creative decision — it compounds into a structural cost efficiency advantage for brands that run it well.
None of this matters, however, if you are running one video and hoping it holds. The real leverage is in velocity: getting to the right creative faster than your competitors by running more experiments per unit of time.
The Problem With “Perfect” Video — And Why Velocity Beats Perfection
The instinct to perfect a video before launching it is deeply intuitive. Nobody wants to put out creative that looks rough, that misses the brief, or that wastes budget on a bad concept. This instinct is not wrong in principle — execution quality does matter for SBV, more than it might for some other formats. But it becomes a liability when it causes teams to collapse ten potential creative hypotheses into one final choice before they have any performance data.
The core problem is this: you cannot predict which creative angle will resonate with your audience until your audience tells you. Seasoned creative directors get this wrong. Research panels get this wrong. Internal stakeholders get this wrong with impressive consistency. The only reliable oracle is live performance data — and you can only gather that by shipping creative and reading the signal.
The Cost of Waiting
A brand that spends six weeks developing one SBV, launches it, and watches it fatigue over 45 days has run approximately 1.5 creative experiments in a quarter. A brand running weekly sprints that each produce 10 variations has potentially run 130 distinct creative experiments in the same period. The creative learning curve those two programs are on is not comparable.
This is not a theoretical argument. It describes the actual divergence happening between top-performing brands and mid-tier performers on Amazon right now. The gap is rarely in budget — it is in creative throughput and the learning that velocity generates.
What “Good Enough to Test” Actually Looks Like
High-velocity creative does not mean low-quality creative. There is an important distinction between rough and lean. A lean SBV is tightly conceived, well-lit, clearly audio-designed for muted playback, and hits its key visual moment in the first two to three seconds. It does not need a $50,000 production budget to do any of those things. Many of the highest-CTR SBV creatives in 2026 have been produced by teams running a smartphone, a white paper background, and a clear script.
The threshold is not “polished.” The threshold is “clear, credible, and hypothesis-testable.” If a video communicates its intended message clearly to a cold shopper and isolates a single variable from its companion videos in the sprint, it is ready to run.
The Hidden Tax of the Perfection Mindset
There is also an organizational cost to prolonged creative development cycles that rarely gets measured: the opportunity cost of the budget you are spending on a fatigued creative while your next sprint sits in review. Every week a single SBV continues running past its peak CTR is a week of ad spend subsidizing a declining asset instead of generating fresh learning. The perfection mindset does not just slow iteration — it actively extends the decay window.
Anatomy of a High-Velocity SBV Sprint (The 7-Day Structure)
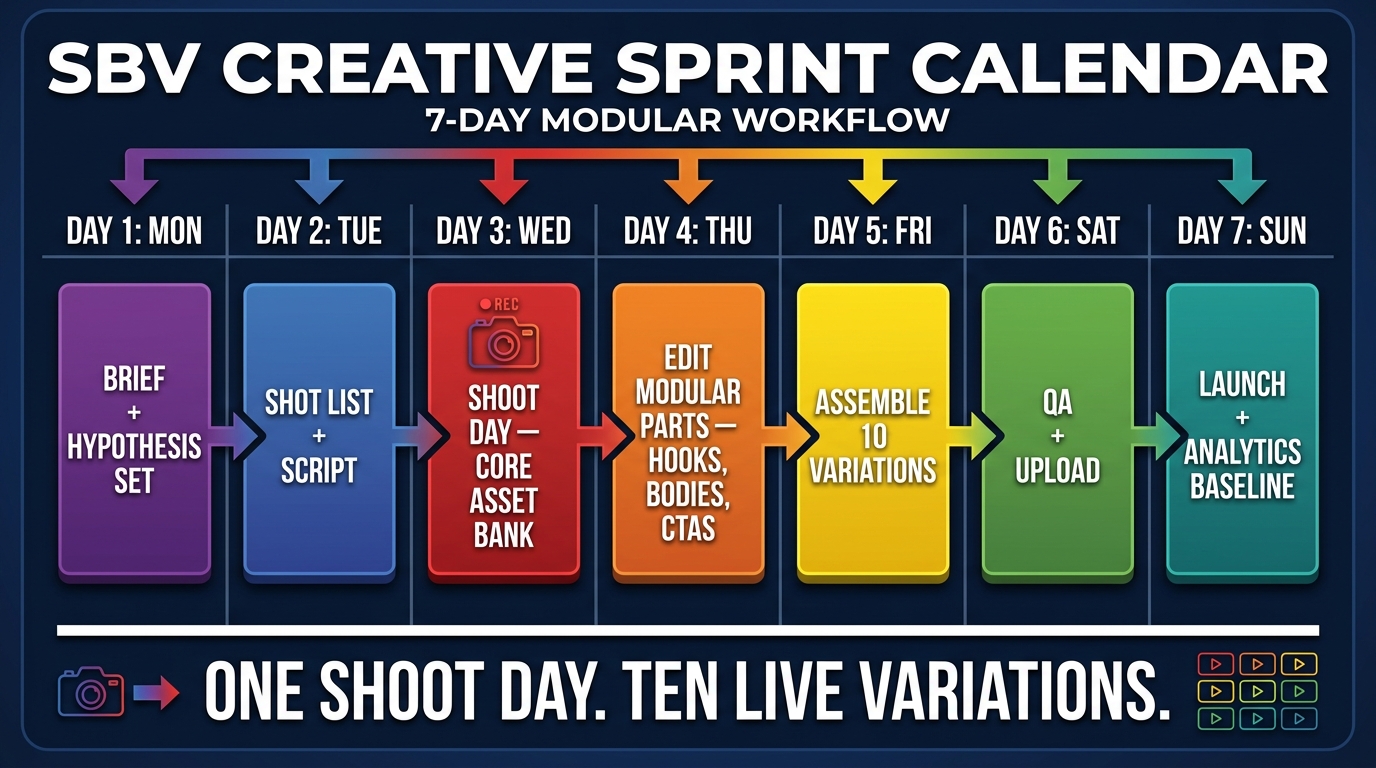
A seven-day creative sprint is not seven days of chaos. It is a highly structured sequence of discrete phases, each with a specific deliverable. The goal is to collapse the distance between “we have a hypothesis” and “we have live performance data” to one week. Here is how the days break down.
Day 1: Brief and Hypothesis Set
The sprint begins not with cameras but with clarity. On Day 1, the team assembles (or a lead strategist works alone) to define the sprint brief. This document answers five questions: What is the one product or offer being featured? What is the specific performance goal — CTR threshold, ROAS target, or conversion rate lift? What are the 10 creative hypotheses being tested? Which single variable will differ across each variation? And what will constitute a “winner” at the end of the sprint’s data window?
The 10 hypotheses are the most important output of Day 1. Each one should be phrased as a testable statement: “A hook that leads with the customer’s pain point will outperform a hook that leads with the product feature.” That framing keeps the team honest during production and makes the results interpretable.
Day 2: Shot List, Scripting, and Storyboards
Day 2 converts the 10 hypotheses into a production plan. The critical insight here is that the 10 variations are not 10 separate shoots — they share a common “body” section (the 10-20 seconds that follow the hook) and a common CTA. Only the hooks vary in the first sprint’s hook-testing phase, or only the body angles vary if you are testing messaging, or only the CTAs vary if you are testing conversion triggers.
The shot list therefore has two distinct sections: shared assets (everything that appears in the common body across all 10 variations) and variation-specific assets (the 10 different hooks, each scripted to a maximum of 5 seconds). This modularity is what makes one shoot day viable. You are not shooting 10 full videos — you are shooting the building blocks of 10 videos.
Day 3: Shoot Day
This is the only full production day in the sprint. For most SBV use cases, a 6-8 hour shoot is sufficient to capture all shared assets plus 10 distinct hook variations. The order matters: capture the shared body content first while energy is high and the setup is fresh, then work through each hook variation systematically.
Capture extras of everything. Multiple takes of each hook, alternative camera angles on the body content, product close-ups from different perspectives. The time spent overshooting on Day 3 pays dividends in editing flexibility on Day 4 and 5, and it prevents costly reshoot requests from derailing the sprint.
Day 4: Modular Editing — Parts, Not Films
Day 4 is where the editor works on components, not complete videos. Each hook is cut to its cleanest version (typically 3-5 seconds). The shared body is assembled into a master segment. Each CTA variant is rendered. These are stored as labeled, reusable modules — not assembled into final videos yet. This modular approach is what enables the speed of Day 5.
Day 5: Assembly — 10 Variations From One Set of Parts
With all modules ready, Day 5 is assembly. The editor sequences Hook A + Body + CTA to produce Variation 1, then Hook B + Body + CTA to produce Variation 2, and so on. Captions, text overlays, and any format-required elements (SBV requires silence-first legibility, so all key messages should be readable without audio) are added at this stage. The 10 final files are exported, named with a consistent convention, and handed off for QA.
Day 6: QA, Spec Check, and Upload
Amazon’s SBV specs are non-negotiable: video must be between 6 and 45 seconds, no letterboxing or black bars, minimum 1280 x 720 resolution, and no pricing information in the creative. Day 6 is for verifying every variation against these requirements, uploading to Amazon Ads, configuring each variation in its own campaign structure (more on why this matters in the testing section), and setting baseline tracking parameters.
Day 7: Launch and Baseline
All 10 variations go live on Day 7. The first 72 hours of data are directional, not definitive — but they establish the baseline from which all future decisions are made. Budget is distributed evenly across variations at launch. Nothing is scaled or paused until you have at least 200-300 impressions per variation with meaningful click data. Day 7 is also when you document your hypotheses against the live assets so that analysis does not require archaeology later.
The Modular Asset Bank — How to Shoot Once and Edit Into 10+ Variations
The sprint model only works because of modular production logic. Understanding this deeply is what separates teams that pull off one sprint from teams that build a repeatable creative program.
Think of every SBV as having three structural zones: the Hook (seconds 0-5), the Body (seconds 5-25), and the Close (seconds 25-30 or to end). Each zone carries a different functional weight in the viewer’s journey, and each zone can be varied independently.
Building the Hook Library
The hook is the highest-value creative real estate in any SBV. It determines whether the shopper pauses or scrolls. It sets the emotional frame. And because it can be swapped without changing anything else, it is the ideal starting point for your first sprint’s variable.
A well-built hook library for one sprint captures 10 distinct opening sequences, each targeting a different angle — problem-first, product-first, lifestyle-first, social proof-first, and so on (detailed in the next section). Each hook is filmed in the same visual style as the body, so the edit does not feel jarring. The hook and body share lighting, location, and talent so continuity is seamless even when they are assembled from different clips.
Building the Body and Close Templates
The body is your product demonstration zone. This is where you show the product in action, communicate the primary benefit, and build the rational case for clicking. Because the body is shared across all 10 variations in a hook-testing sprint, it gets the most production attention. It should be tight (10-18 seconds), visually clear for muted playback, and deliberately structured: show the product, demonstrate the key benefit, surface the use case.
The Close is the CTA zone. Like the hook, it can be independently varied. In a hook-testing sprint, you will likely hold the CTA constant. But a subsequent sprint — after you have identified your best hook — might swap the CTA across 10 variations to identify the most conversion-efficient closing message.
Naming Conventions and Asset Management
Modular production creates an asset management challenge if you do not solve it from the start. Every raw clip, every rendered module, and every assembled variation should follow a consistent naming convention from the moment it is captured. A format like [BRAND]_[PRODUCT]_[SPRINT#]_[ZONE]_[VARIANT_LETTER] (e.g., APEX_BLENDER_S01_HOOK_B) takes 30 seconds to apply and saves hours of archaeology when you are scaling into Sprint 3, Sprint 4, and Sprint 5 with an expanding library of reusable assets.
Reusing Across Sprints
One of the compounding advantages of the modular approach is that assets do not expire after one sprint. A body segment that performed well in Sprint 1 can be paired with entirely new hooks in Sprint 3. A hook that won a hook test can become the permanent opening of a hero SBV that runs for 60 days. The asset bank grows with each sprint, and so does your creative optionality.
10 Creative Variation Angles to Test in Your First Sprint
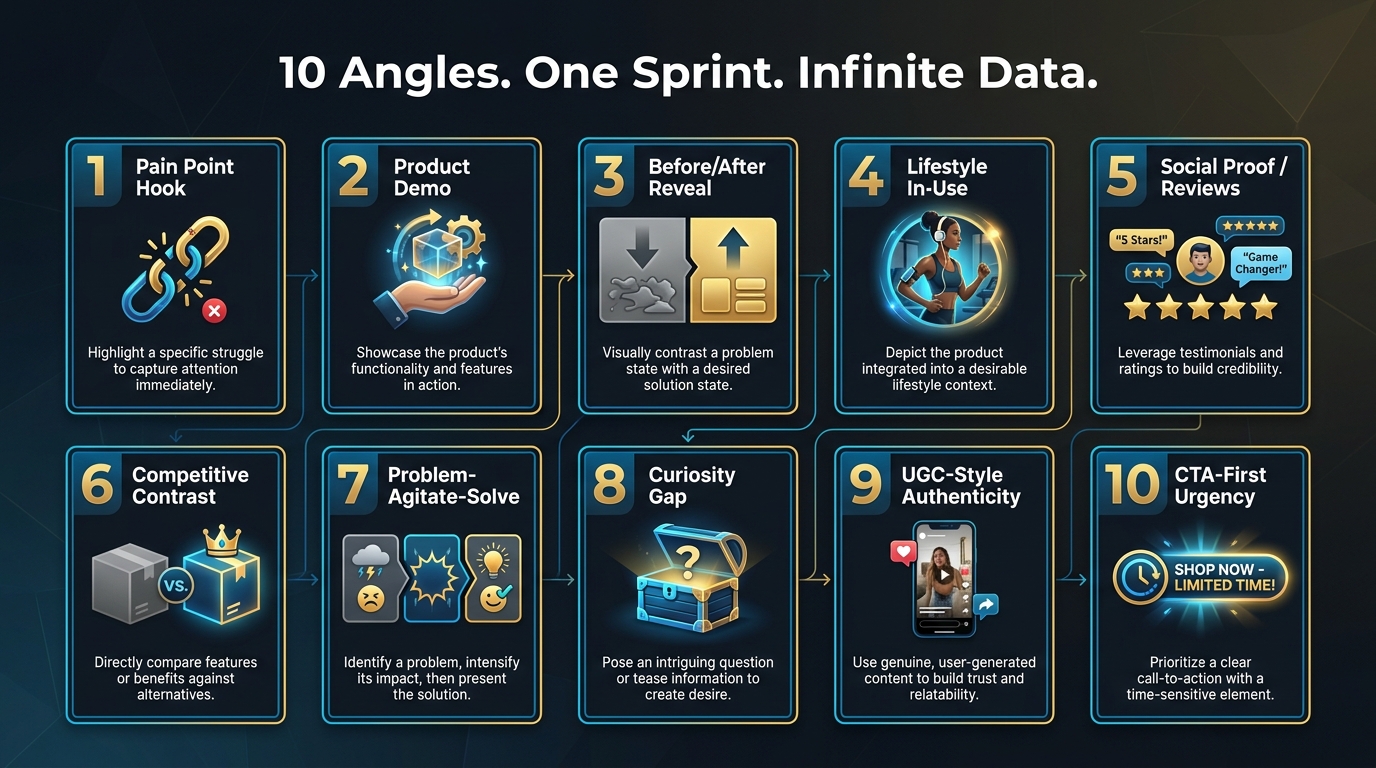
Your first sprint is most valuable when it tests fundamentally different angles — not minor execution tweaks. The goal is to surface which creative category your audience responds to, so subsequent sprints can drill deeper into the winner. Here are the 10 angles structured for maximum signal value.
Variation 1: The Pain Point Hook
Opens with the customer’s problem, stated directly or shown viscerally. No product in the first frame — just the frustration, the inconvenience, or the failure state the product solves. This angle works exceptionally well for products in categories where shoppers are actively looking for relief: cleaning tools, health aids, organizational products, and kitchen items. The viewer self-selects by recognizing their own problem.
Example opening: A closeup of a cluttered drawer. Text overlay: “Tired of digging through this every morning?” Cut to product at second 3.
Variation 2: The Product Demo Hook
The product appears in the very first frame, doing the thing it is best at. No preamble. No setup. Just the action. This angle assumes the shopper already has category intent and rewards them with immediate relevance. It tends to perform well on high-purchase-frequency categories where the audience is efficient and knows what they are looking for.
Example opening: Product in hand, demonstrating primary function in one clean motion. Text overlay: the primary feature claim. No narration needed.
Variation 3: The Before/After Reveal
A two-frame contrast — the state before the product, then the transformed state after. This is one of the most intuitive creative structures for human brains, because it delivers a narrative arc in under five seconds. For transformation-oriented categories (skincare, fitness equipment, home improvement, organization), this angle consistently generates strong click-through because it makes the product’s value immediately tangible.
Variation 4: The Lifestyle In-Use Hook
Opens with a real-world scene showing the product being used in context — a morning kitchen routine, a camping setup, a home office desk. The product is secondary to the setting; the viewer is drawn in by the lifestyle aspiration or relatability first. This angle performs especially well when the product’s appeal is partly aspirational or identity-based rather than purely functional.
Variation 5: The Social Proof Hook
Opens with a customer-voice element: a review excerpt overlaid on screen, a star rating, a testimonial quote, or a “verified purchase” callout. In a marketplace environment where trust is a primary purchase barrier, leading with evidence that other customers have already made the decision can dramatically lower resistance. This angle often outperforms in lower-awareness categories where the brand name carries less inherent credibility.
Variation 6: The Competitive Contrast Hook
Opens by implying or showing what competitors’ solutions look like — without naming competitors — then pivoting immediately to your product’s differentiated approach. “Most [product category items] require [frustrating process]. This one doesn’t.” This angle works when your product has a genuine structural advantage that can be visualized quickly. It is particularly effective in crowded categories where the differentiation story is the primary purchase driver.
Variation 7: The Problem-Agitate-Solve Structure
The classic persuasion sequence compressed into five seconds. The hook names the problem (one second), amplifies it briefly (one to two seconds), then introduces the product as the specific solution (one to two seconds). PAS works across nearly every category because it aligns with how shoppers arrive at a purchase decision: they feel the problem first, then search for relief. Starting your hook at that emotional starting point creates immediate alignment.
Variation 8: The Curiosity Gap Hook
Opens with a statement or visual that creates an information gap the viewer needs to close. “We tested 47 versions of this before getting the formula right.” “Most people who try this once never go back to [old method].” “This is not what it looks like.” These hooks exploit the brain’s drive for completion — the viewer clicks because they need to resolve the open question. Curiosity gap hooks require more specific knowledge of your category to execute well, but when they land, they often produce outsized CTR.
Variation 9: The UGC-Style Authenticity Hook
Deliberately shot to look like organic user content rather than an ad: handheld camera, natural lighting, conversational tone, relatable setting. This angle can perform exceptionally well because it disrupts the visual language of typical ad creative. Shoppers who have developed ad-blindness from constant exposure to polished commercial formats respond to the perceived authenticity. The key is to make it look organic without crossing into deception — the product should be the genuine subject of the content.
Variation 10: The CTA-First Urgency Hook
Opens with the action you want the viewer to take, combined with a reason to act now. “Click before we run out — we’re down to 200 units.” “This deal ends Sunday.” “Shop the #1 rated [category] on Amazon.” This is a directional hook that works best when paired with a genuine scarcity or urgency signal. It tends to attract high-intent shoppers who are close to the purchase decision already and just need a trigger. Do not use it with fabricated urgency — sophisticated shoppers see through it quickly and it will suppress credibility.
Hypothesis-Driven Testing: The Variable Isolation Framework
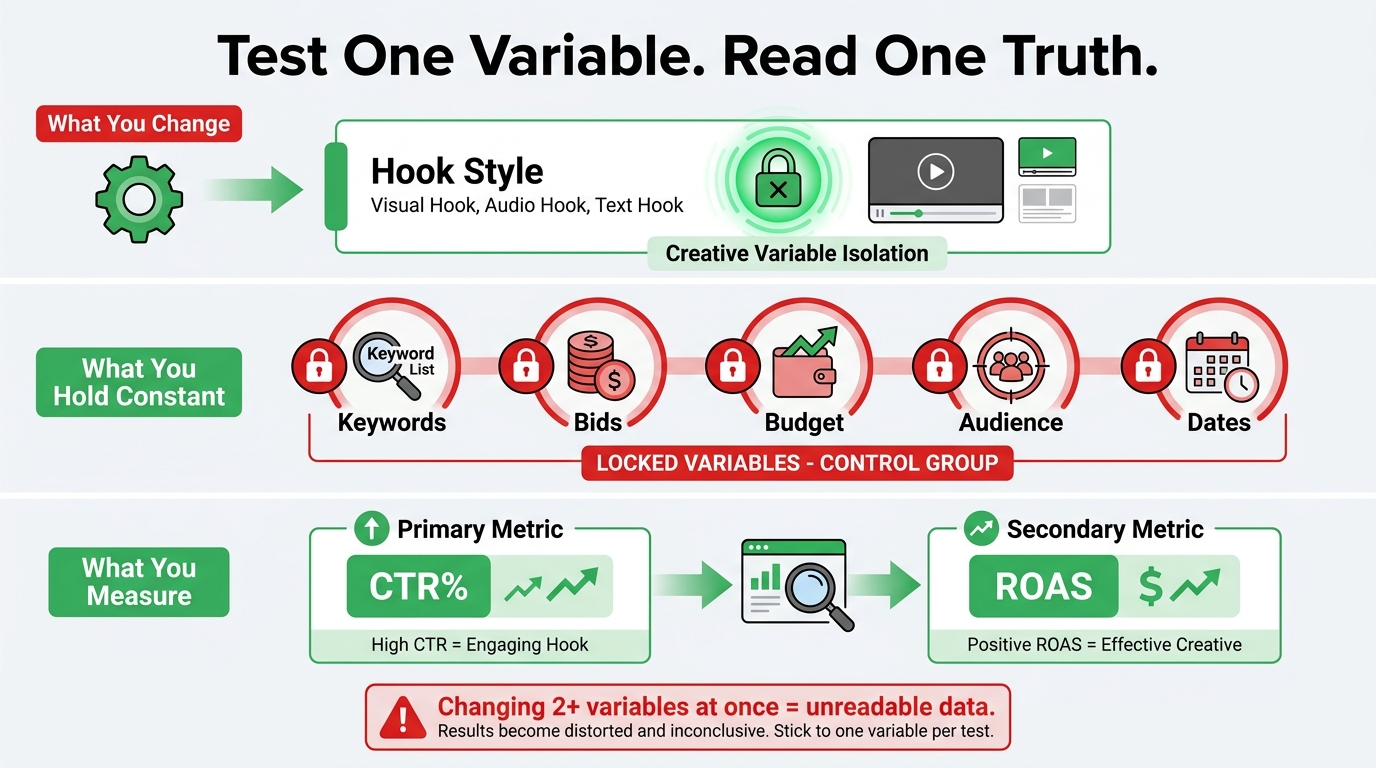
Ten variations only generate useful data if they are set up to be readable. The most common mistake teams make in creative testing is changing multiple things simultaneously and then trying to draw conclusions from the result. That is not a test — it is noise with a budget attached.
The One Variable Rule
Each sprint should test exactly one variable category. If you are testing hooks, every variation must have the same body, the same CTA, the same text overlay style, and the same music. If you are testing CTAs, every variation must have the same hook and body. If you are testing messaging angles in the body, every variation must have the same hook and the same CTA.
The discipline this requires is uncomfortable. Teams will want to also “fix” the CTA while they are in there, or “improve” the text overlay on a few variations. Resist this completely. Any change that is not the designated test variable is contamination. It makes the results uninterpretable, which wastes the entire sprint’s data value.
Writing the Hypothesis Statement
Every variation should have a pre-written hypothesis statement before it goes live. The format is simple: “IF we lead with [specific creative approach], THEN we expect [specific metric] to increase by [estimated magnitude] BECAUSE [customer behavior rationale].“
This is not bureaucracy. Writing out the “because” forces the team to articulate why they believe a creative choice will work — and that articulation is what gets smarter over sprints. When Variation 4 (Lifestyle Hook) beats Variation 2 (Product Demo Hook) and your hypothesis had predicted the opposite, the gap between prediction and reality is where the most valuable learning lives.
Campaign Structure for Isolated Testing
On Amazon Ads, variable isolation requires a specific campaign structure. Each SBV variation should run in its own campaign — not as different ads within the same campaign. This ensures that each variation receives its own impression allocation and that Amazon’s delivery algorithm does not internally optimize toward one variation and starve the others of data before you have had a chance to read the results.
Keep the following variables constant across all 10 campaigns: keyword targeting (same keyword list), match types, bid strategy, daily budget (equal across all), placement settings, start and end dates. The only thing that should differ is the video creative asset. Everything else is locked.
Minimum Data Thresholds Before Declaring a Winner
Calling a winner too early is one of the most expensive testing mistakes in PPC. A variation that generates 30 clicks in the first 48 hours may look like a strong performer — but with that sample size, the confidence interval is too wide to act on. A general minimum threshold before making pause/scale decisions on SBV creative tests is:
- Impressions: At least 1,000 per variation
- Clicks: At least 30-50 per variation for CTR decisions
- Time: At least 7-10 days of live running to smooth out day-of-week patterns
- Orders: At least 10-15 per variation before making ROAS-based decisions
For lower-volume products or smaller budgets, these thresholds may take longer to hit — which is a reason to prioritize CTR as the primary sorting metric, since it accumulates faster than purchase data.
Reading Your Results: The Metrics That Tell You What to Keep, Kill, or Scale
Data without a reading framework is just noise in a spreadsheet. Here is the decision logic for interpreting SBV sprint results.
Primary Metric: CTR (Click-Through Rate)
CTR is the attention signal. It tells you whether the hook captured intent. In the context of a hook-testing sprint where everything except the first five seconds is identical, a material CTR difference between variations is almost entirely attributable to the hook. This is the cleanest creative signal available in Amazon Ads.
What “material” means depends on your category baseline. If your current SBV is running at 0.65% CTR and a new variation hits 0.95%, that is a 46% lift — clearly meaningful. If the range across your 10 variations spans 0.60% to 0.70%, the signal is weak and no single variation has a definitive edge; in that case, run a follow-up sprint with more extreme hook differences.
Secondary Metric: CVR (Conversion Rate) and ROAS
A variation that wins on CTR but loses on CVR is generating curiosity it cannot convert. This is possible — a hook that overpromises or sets the wrong expectation can attract clicks from shoppers who then land on the detail page and feel misled. Always layer CVR analysis on top of CTR analysis before declaring a winner.
The ideal creative is one that wins on both — high CTR indicating strong hook performance, and a CVR that matches or exceeds your campaign baseline, indicating that the shopper the hook attracted was the right shopper. When you find that combination, that is your winner, and it deserves to be scaled.
The Keep/Kill/Scale Framework
- Scale: Top 2-3 CTR performers with CVR at or above baseline. Increase budget, move to a hero campaign.
- Keep/Monitor: Variations with middle-tier CTR but strong CVR — these may be attracting lower volume but higher-quality intent.
- Kill: Bottom-quartile CTR with no compensating CVR signal after reaching data thresholds. Pause and do not rerun without a fundamental creative change.
- Investigate: High CTR but below-baseline CVR. This indicates a hook-to-page alignment problem. The hook may be conceptually sound but setting an expectation the listing cannot fulfill. Fix the landing page, or revise the hook’s specific promise.
Feeding Results Into the Next Sprint
The output of every sprint is not just a winner — it is a brief for the next sprint. If Variation 3 (Before/After) won the hook test, the next sprint brief starts from that insight and drills deeper: what specific before state resonates most? What after state matters most to this shopper? Does the transformation moment need to appear earlier or later? Sprint 2 does not start from zero — it starts from Sprint 1’s winning hypothesis and refines it.
This is the compound effect of sprint-based creative development. Each cycle generates learning that makes the next cycle faster, more targeted, and more likely to produce a lift rather than a wash.
Creative Fatigue and the 60-90 Day Refresh Cycle
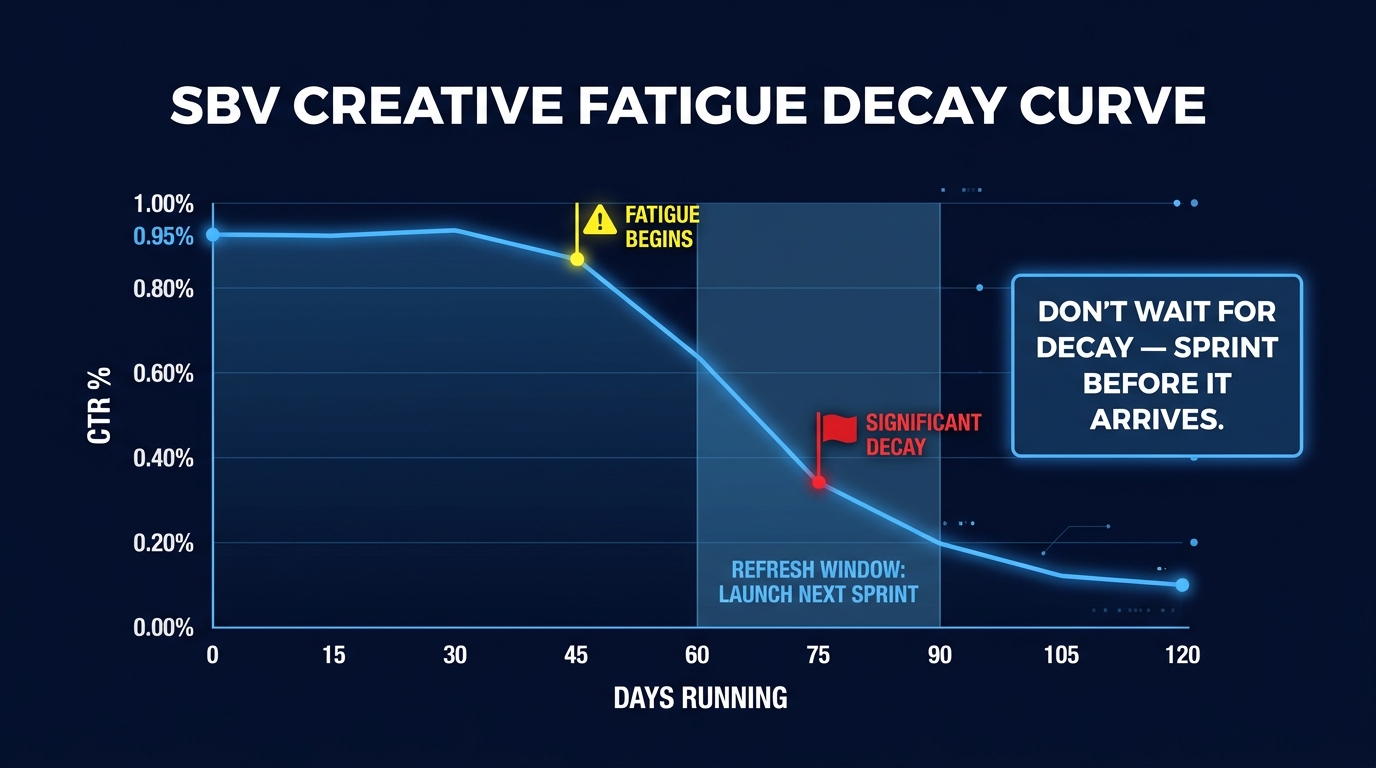
Even a winning creative has a shelf life. The data on SBV creative fatigue in 2026 is fairly consistent: measurable CTR decay typically begins around Day 45 of continuous serving, with significant degradation visible by Day 75. By Day 90, a creative that launched at 0.90% CTR may be running at 0.55% or lower — a decline that is quietly eroding both performance and ad efficiency without triggering any obvious alert.
Why Fatigue Happens in Amazon’s Environment
Amazon’s search audience is not a static pool. But for any given keyword set, the overlap between repeat visitors is higher than most advertisers assume. A shopper who searches for “stainless steel travel mug” multiple times in a month will see the same SBV repeatedly. After three or four exposures, the hook that originally stopped their scroll becomes familiar — and familiarity kills the pattern interrupt effect that generates CTR.
This is not a failing of your creative. It is physics. Even the best TV spots become wallpaper after enough exposures. The answer is rotation frequency, not hoping your winner lasts longer than it will.
The Proactive Refresh Approach
The sprint model is specifically designed to solve this problem at the root. Rather than waiting for fatigue to register in the data and then scrambling to produce new creative, the sprint cadence means you always have the next creative wave in development before the current one starts declining.
A practical schedule for a brand running consistent SBV looks like this:
- Weeks 1-2: Sprint 1 launches. 10 variations running. Data accumulating.
- Weeks 3-4: Sprint 1 winner identified and scaled to hero campaign. Sprint 2 brief being developed.
- Weeks 5-6: Sprint 2 runs. New 10 variations tested. Sprint 1 hero creative approaching Day 45.
- Weeks 7-8: Sprint 2 winner identified. Sprint 1 hero creative rotated or refreshed based on fatigue data.
This staggered cadence means you are never in the position of running a fatigued creative because nothing new is ready. The pipeline always has something in production, something in testing, and something scaling.
Leading Indicators of Fatigue
Do not wait for ROAS to decline before investigating creative fatigue. The earlier signal is almost always in CTR. If your SBV CTR drops more than 15-20% from its running average over any 7-day window, treat it as a fatigue signal and move the scheduled refresh forward. Catching the decline early means you can rotate in a fresh variation before the conversion impact becomes material.
Amazon’s Ads console now surfaces video-specific metrics — completion rate, mute/unmute interactions, and engagement rate — that can provide early warning signals before CTR visibly drops. Monitor these weekly, not monthly.
Team Structure and Tooling for a Repeatable Sprint Machine
The sprint model described above is achievable for a lean team. It does not require a full creative studio. But it does require clear role definition and the right tooling to prevent the workflow from collapsing under its own volume.
The Minimum Viable Sprint Team
A functional sprint team needs five roles covered. Those roles can be distributed across fewer people — a brand with a strategic marketer, a videographer, and an editor can run this — but each function must be owned by someone:
- Sprint Lead / Strategist: Owns the brief, the hypotheses, the testing framework, and the results analysis. This person understands the data and translates it into creative direction.
- Scriptwriter / Creative Director: Converts the hypotheses into specific, shootable concepts. Writes each hook script. Ensures the body and close are tight and on-brief.
- Videographer / Producer: Executes the shoot day. Manages lighting, shot list, talent (if any), and asset capture. Overshoots systematically.
- Video Editor: Builds the modular parts and assembles the 10 variations. Manages the asset library and naming convention.
- Ads Manager / Campaign Operator: Sets up the campaign structure, uploads assets, configures targeting and bids, monitors data, and runs the keep/kill/scale framework.
Tooling Stack for Sprint Operations
The tools required are not exotic, but they do need to be configured before Sprint 1 launches:
- Project management: Notion, Asana, or ClickUp with a dedicated sprint template that tracks each variation’s hypothesis, status, and performance
- Asset storage: Google Drive or Dropbox with a consistent folder structure (Sprint > Modules > Final Variations)
- Video editing: DaVinci Resolve, Premiere Pro, or CapCut for Business — the key is that your editor is fluent in whichever tool and can work fast on Day 4 and 5
- Performance tracking: Amazon Ads console supplemented by a custom data pull into Google Sheets or a third-party tool like Perpetua, Pacvue, or Helium 10 Adtomic for cross-campaign comparison
- Sprint log: A running document (Google Sheets or Notion database) that records every sprint’s hypotheses, results, and key learnings — this becomes your institutional creative memory
AI-Assisted Speed Boosts
In 2026, AI tooling has entered the sprint workflow at several specific points without replacing human judgment:
- Hook scripting: AI can generate 20-30 hook script drafts from a brief in minutes, which the creative lead then culls and refines to 10 production-ready options
- Caption and text overlay generation: Auto-captioning tools dramatically reduce the time required to make SBV legible for muted playback
- Background music selection: AI music tools can match tempo and mood to brief specs without licensing concerns
- Data analysis: AI can summarize comparative performance across 10 campaigns and flag statistical outliers faster than manual spreadsheet review
These tools shave hours off Days 2, 4, and 5 without changing the fundamental creative logic of the sprint. The human decisions — which hypotheses to test, what constitutes a meaningful lift, how to brief the next sprint — remain firmly in the hands of the strategist.
Common Sprint Mistakes That Quietly Sabotage Results
Even teams that understand the sprint model conceptually tend to make a set of predictable mistakes on first execution. These are the ones worth specifically guarding against.
Mistake 1: Testing Variations That Are Too Similar
If your 10 hook variations are all minor wording changes to essentially the same concept, the sprint will produce tight, undifferentiated results that cannot guide creative direction. The variations need to represent genuinely different creative hypotheses — different emotional entry points, different visual approaches, different audience assumptions. If you look at your 10 scripts and they all feel like versions of the same thing, the brief needs to go wider before production starts.
Mistake 2: Treating CTR as the Only Metric
CTR measures attention. It does not measure purchase intent quality. A hook that generates 2.0% CTR by being sensationalist or ambiguous is not a winner if the conversion rate on those clicks is 1%. Always layer CVR and, where you have sufficient data, ROAS before declaring a creative the champion.
Mistake 3: Inconsistent Campaign Setup Across Variations
This is a mechanical error, but it is surprisingly common. If one campaign has exact match targeting and another has broad match, or if budgets differ, or if bid strategies differ, the performance differences between variations are no longer interpretable as creative signals. The campaign setup discipline has to be enforced without exception, every sprint.
Mistake 4: Pausing Too Early Based on Early Data
The urge to pause underperforming variations within the first 48-72 hours is understandable — it feels like responsible budget management. But SBV campaigns on Amazon often need 5-7 days to exit the learning period and reach statistically meaningful impression volumes. Variations that look weak on Day 2 sometimes emerge as strong performers by Day 7. Hold the discipline of the minimum data threshold before making any pause decisions.
Mistake 5: Not Documenting the Learning
The sprint log is not optional. Teams that run sprints without documenting their hypotheses and results tend to rediscover the same learnings repeatedly — testing similar angles, finding similar results, and not building on them. The sprint log is the mechanism that converts testing activity into institutional knowledge. Without it, velocity without learning is just expensive noise.
Mistake 6: Shooting for One Sprint and Stopping
The value of the sprint model is cumulative. One sprint gives you data. Two sprints give you a directional hypothesis. Five sprints give you a creative thesis that has been tested and refined through multiple iterations. Brands that run one sprint, find a winner, and then stop testing have captured only the first layer of the model’s value. The competitive advantage is in maintaining the cadence, not completing a single cycle.
Building a Creative Velocity Advantage That Compounds
The sprint model is not just a production technique — it is a compounding investment in creative intelligence. Every sprint that runs adds to a growing body of performance knowledge about your specific audience, your specific category, and your specific product’s strongest creative angles. That knowledge narrows the gap between concept and winner with each iteration.
By Sprint 5, a team running this model will know: which hook categories outperform for their audience (emotional vs. rational vs. social proof), which body structure converts best (demo-forward vs. benefit-forward vs. use-case-forward), which CTA framing drives action most efficiently, and approximately how long each winning creative sustains before fatigue requires a refresh. That is not anecdotal — it is empirically derived from live data across 50 tested variations.
That knowledge is not available to competitors who are still treating SBV as a one-and-done production project. And it does not transfer easily — it lives in your sprint log, in your team’s accumulated pattern recognition, and in the asset bank that gets richer with every sprint.
The Practical Starting Point
If you have never run a sprint, the immediate action is not to redesign your entire creative program. It is simpler: take your next planned SBV production and instead of making one video, commit to making 10 variations from the same shoot. Pick 10 hooks from the angle library above. Write 10 hypotheses. Set up 10 campaigns with identical targeting and budget. Launch them, read the data for 10 days, and apply the keep/kill/scale framework to what you find.
That single sprint will generate more actionable creative insight than most brands gather from three months of running a single SBV. It will also give you a winner that you can be confident in — because it earned the title against nine alternatives, not by being the only entry in the race.
What Changes at Scale
As the sprint cadence matures, the scope of testing expands. Later sprints can test body structures, CTA language, music choices, text overlay placements, caption styles, and talent presentation styles. The variable isolation discipline means each of these tests remains readable. The asset bank means later sprints get cheaper per variation because more modular parts are already built and reusable.
Eventually, a mature sprint program starts to feel less like a creative process and more like a research function — one that continuously generates signal about what your audience responds to, and continuously converts that signal into better-performing SBV. That is precisely what it is. And it is the kind of structural creative advantage that compounds quietly while competitors are still asking which video to make next.
Final Takeaways
- SBV delivers 1.6-2.6x higher CTR than static Sponsored Brands — but only if the creative is continuously tested and refreshed.
- The 7-day sprint structure turns one shoot day into 10 live variations by separating production into modular zones: hook, body, and close.
- Variable isolation is non-negotiable. Test one thing per sprint or your data is unreadable.
- CTR is the primary signal; CVR is the filter. A winner must clear both metrics before scaling.
- Creative fatigue begins around Day 45. Start your next sprint before it arrives, not after you notice the decay.
- The sprint log is the most underrated asset in this entire system. Document every hypothesis and every result without exception.
- The compounding value is in the cadence, not the single sprint. Build the machine, then let it run.