Tag: Creative Testing

  • Why Your SBV Creative Iteration Loop Is Breaking at the Wrong Stage (And How to Fix It)

    Why Your SBV Creative Iteration Loop Is Breaking at the Wrong Stage (And How to Fix It)

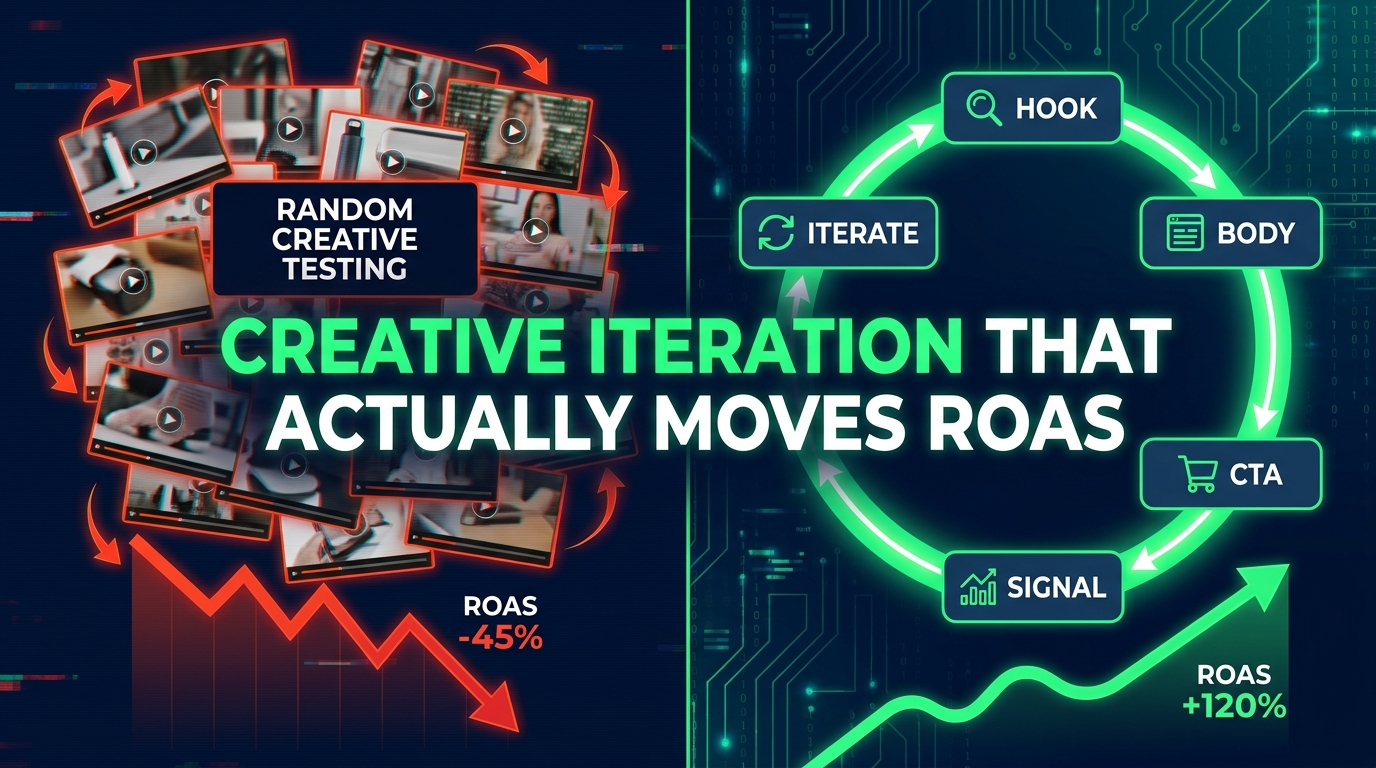
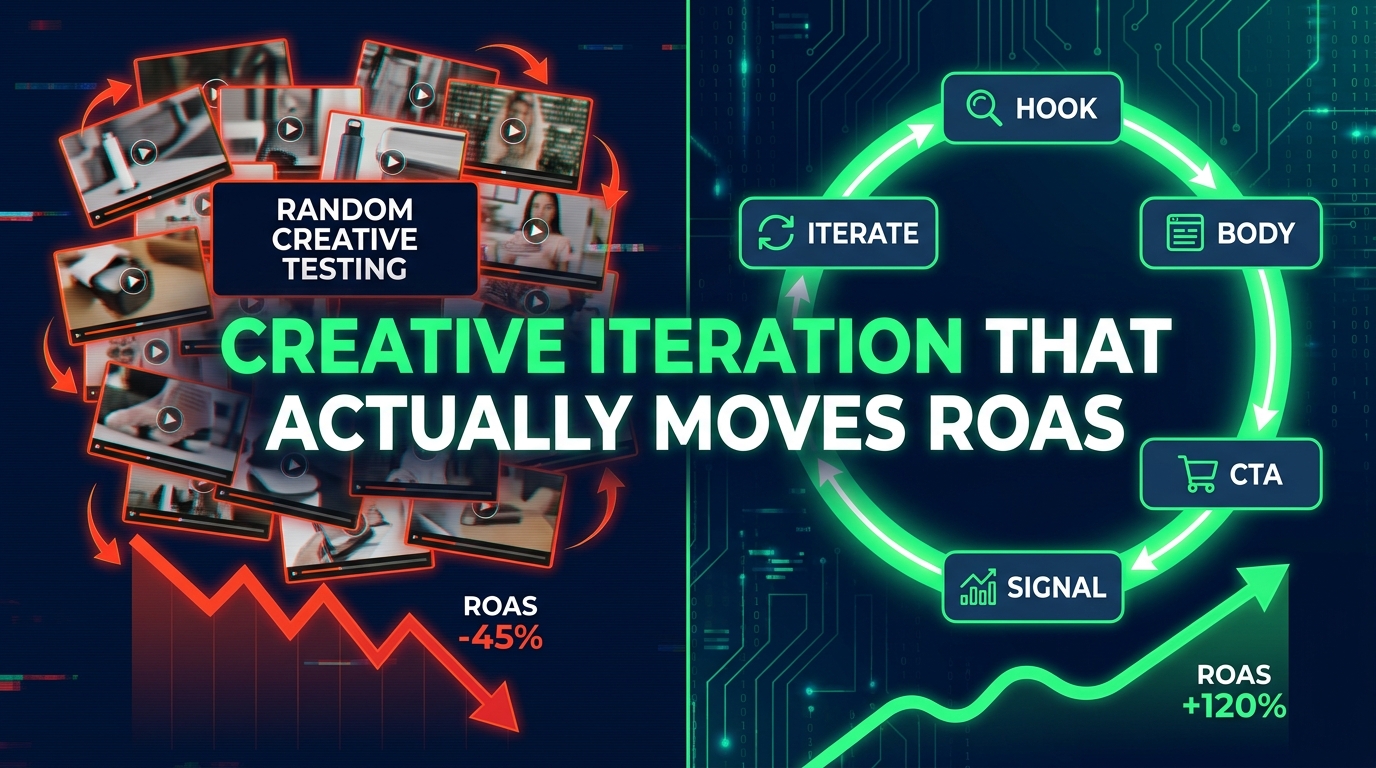
    SBV creative iteration loop vs random testing — ROAS comparison showing structured loop driving growth

    Most Amazon brands running Sponsored Brands Video ads are iterating. They’re swapping out thumbnails, trimming video lengths, rewriting end cards, tweaking music tracks. They call it “testing.” They measure it against ROAS. And they wonder why the needle barely moves.

    The problem isn’t the pace of iteration. It’s the sequence. Brands are testing the wrong variables first, at the wrong stage of the loop, with campaign structures that make it functionally impossible to isolate causality. They get noise, not signal. They scale noise. And then ROAS plateaus at a number that feels permanent but is actually just the ceiling of a broken process.

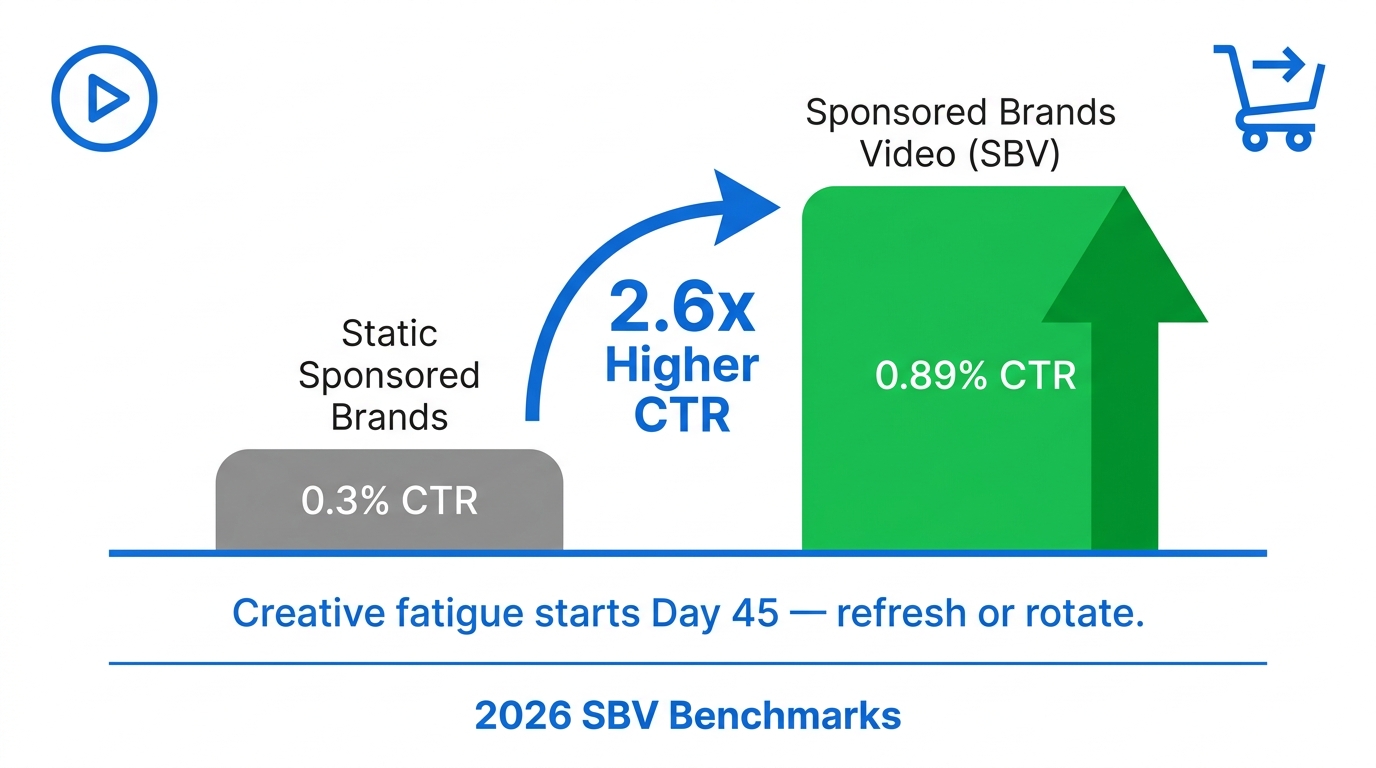
    SBV — Amazon Sponsored Brands Video — is now one of the highest-leverage ad formats on the platform. It occupies full-width placement on search results pages. It autoplays as shoppers scroll. It generates CTRs that consistently outperform static Sponsored Brands units by 2x or more when executed correctly. But “executed correctly” is doing a lot of work in that sentence. The format rewards disciplined creative systems. It punishes guesswork dressed up as testing.

    This post is about building the kind of iteration loop that actually produces measurable ROAS movement — not marginal fluctuations that disappear inside statistical noise. We’ll cover the architecture of a real SBV testing system, what to test first and why, how to read the signals that tell you what to do next, and what happens when you stop treating creative as a one-off production problem and start treating it as an ongoing engineering discipline.

    What “Creative Iteration” Actually Means in the Context of SBV

    The word “iteration” gets used so loosely in performance marketing that it’s become almost meaningless. In most agency decks, it means “we made a new version.” That’s not iteration. That’s production.

    True creative iteration in the context of SBV means something more specific: a structured cycle in which you form a hypothesis about one creative variable, produce variants that isolate that variable, run them against a predefined success metric, extract a directional signal, and use that signal to inform the next hypothesis. The loop is closed. Each cycle teaches you something that narrows the possibility space for the next cycle.

    The Distinction Between Testing and Learning

    Testing produces a winner. Learning produces a principle. The goal of an SBV creative iteration loop is to accumulate principles — durable rules of thumb that hold across products, keywords, and audiences — not just to find a single ad that beats its predecessor before it too fades.

    A principle might sound like: “On our category, hooks that lead with a user problem outperform hooks that lead with product features by roughly 30% on CTR.” That principle is valuable because it doesn’t expire when the winning ad fatigues. It informs every future hook you write. It’s an asset that compounds.

    Testing without learning produces a graveyard of “winners” that each have a lifespan of a few weeks and leave no institutional knowledge behind. This is the trap most SBV programs fall into.

    Why SBV Is Uniquely Suited to Systematic Iteration

    Unlike Sponsored Products or static Sponsored Brands, SBV has a natural modular structure: hook (seconds 0–3), body (seconds 3–15), CTA and end card (final 3–5 seconds). These aren’t arbitrary editorial divisions. They’re distinct functional units that drive distinct behavioral outcomes. The hook drives click-through. The body drives purchase intent and completion rate. The CTA drives conversion.

    Because these functions are separable, the variables that affect each function are also separable — which means you can test them independently. This is what makes SBV a rare opportunity. Most ad formats don’t offer this level of structural granularity. Most teams squander it by changing multiple variables at once and wondering why they can’t explain their results.

    Why ROAS Moves at the Hook Level, Not the Campaign Level

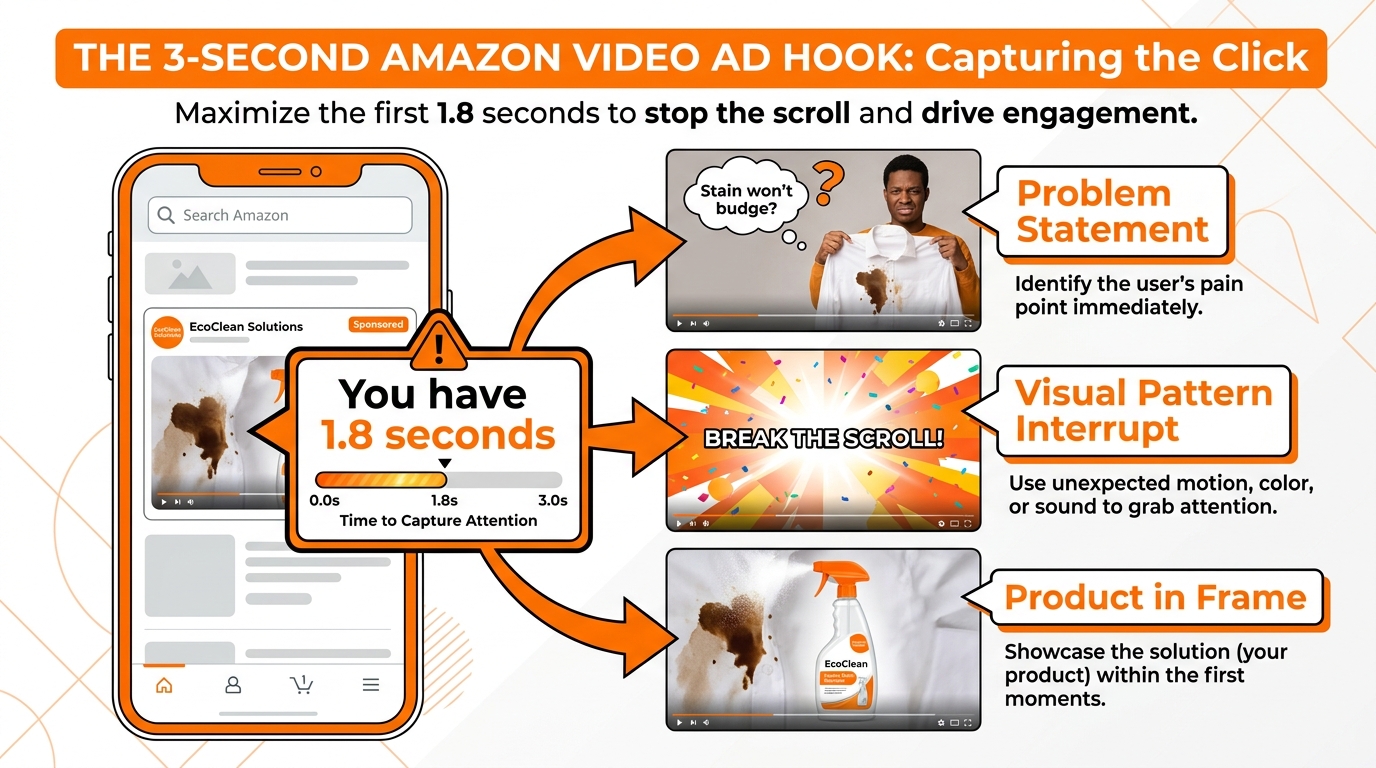
    Anatomy of an Amazon SBV video hook — showing the 1.8-second window with problem statement, visual interrupt, and product in frame

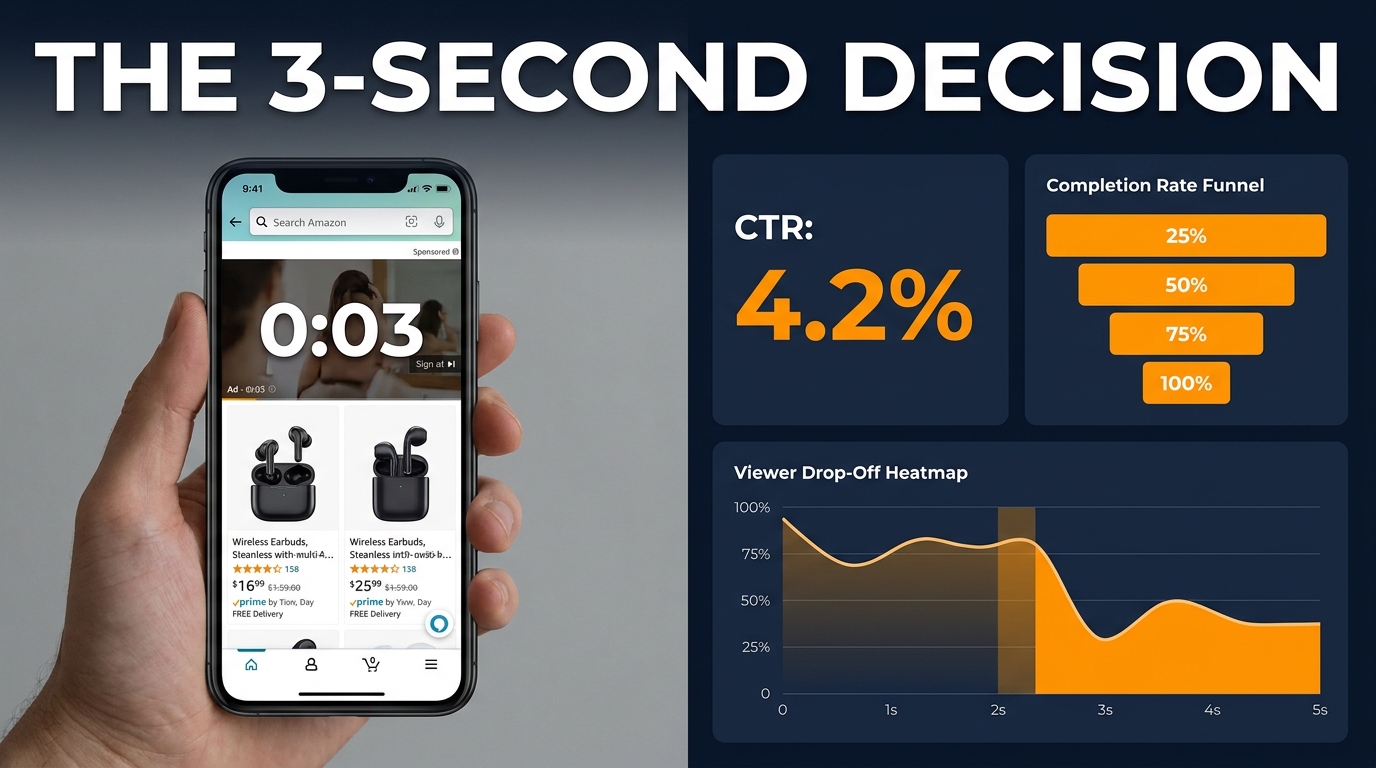
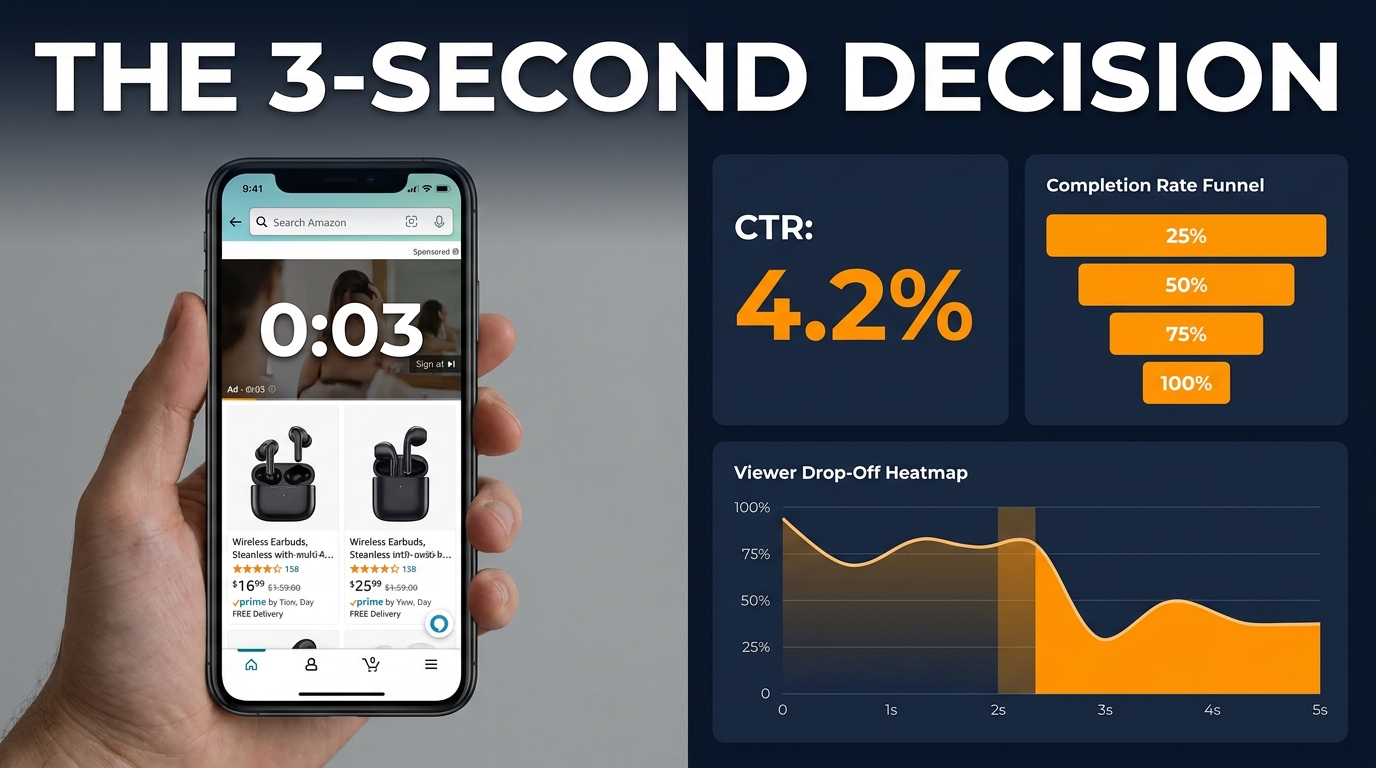
    Here is the counterintuitive truth that separates high-performing SBV programs from average ones: the majority of ROAS variance in an SBV campaign is determined in the first two to three seconds of the video, not in the targeting settings, not in the bid strategy, and not in the end card design.

    This isn’t intuition. It’s a function of how Amazon’s ad auction and delivery system interact with user behavior. When your SBV ad loads in a search result, the shopper is mid-scroll. Their attention is a scarce resource under active competing claims. If the first frame doesn’t immediately signal relevance, their thumb keeps moving. They never see your product demonstration. They never read your end card. Your CPC is spent. Your impression is wasted.

    The 1.8-Second Reality

    Research on scroll behavior and video ad attention consistently points to an effective decision window of under two seconds for autoplay video ads in feed environments. Amazon’s mobile search experience is no different. Shoppers on Amazon are in an active purchase mindset, which actually makes the hook problem harder, not easier — they’re evaluating many options simultaneously and they have well-developed filtering instincts.

    A hook that doesn’t immediately answer the implicit question — “Is this relevant to what I’m searching for right now?” — fails on attention. A hook that answers that question but frames it generically fails on differentiation. A hook that answers the question, signals relevance, and creates a reason to keep watching wins the impression. That’s a high bar, and it’s the bar that separates a 0.5% CTR from a 1.5% CTR. That gap has direct, compounding effects on your ROAS.

    Hook Rate as a Leading ROAS Indicator

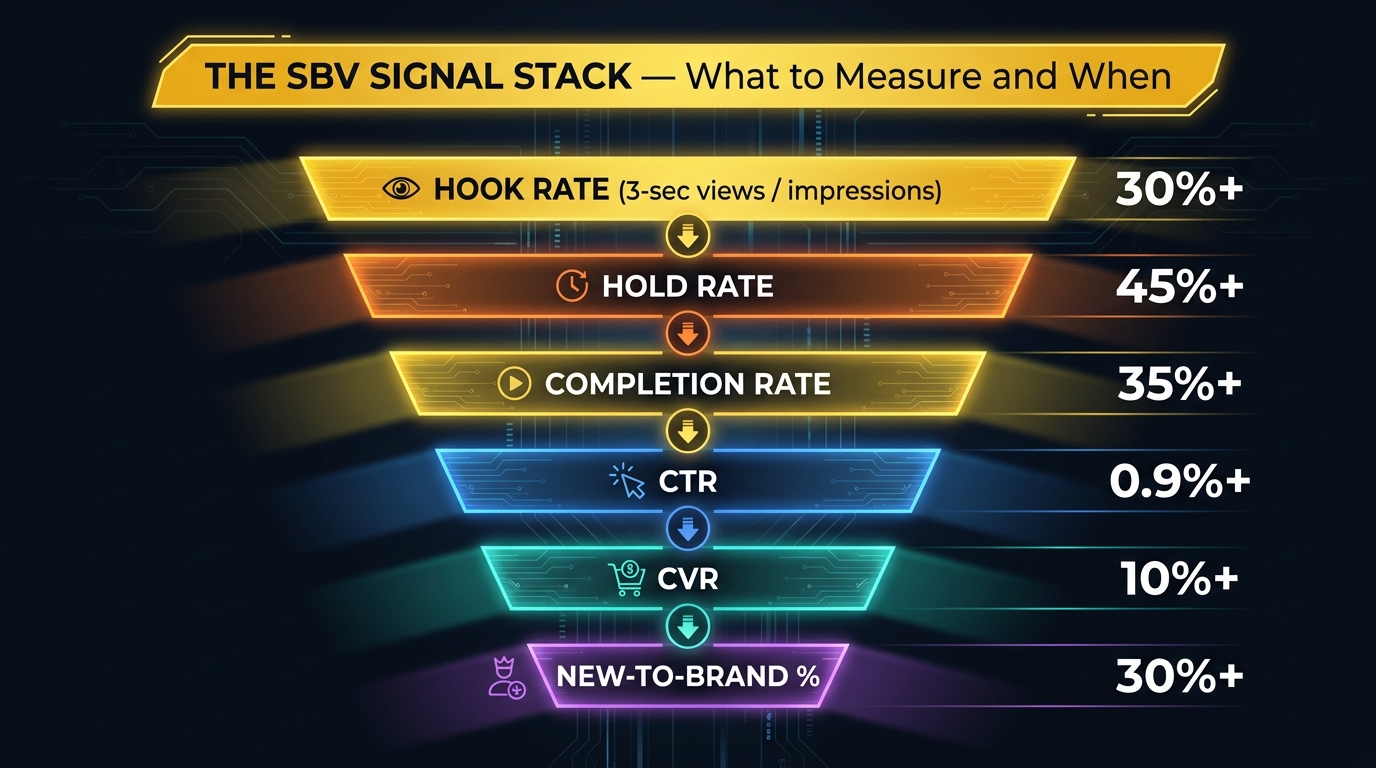
    Hook rate — the percentage of impressions in which a user watches beyond the first 2–3 seconds — is the most important leading indicator of eventual ROAS performance in an SBV campaign. It predicts downstream engagement better than completion rate and better than CTR on its own, because it measures the moment of decision.

    Top-performing SBV programs target a hook rate above 30%. Campaigns with hook rates below 15% are typically structurally broken at the creative level, regardless of how well the rest of the video is executed. No amount of end card optimization will fix a bad hook. No keyword refinement will recover the wasted impressions.

    This is why iteration must begin at the hook. Not because the rest of the video doesn’t matter — it does — but because the hook is the load-bearing variable. It’s the constraint. You solve the constraint first. Then you optimize downstream.

    How Hook Variance Flows Through to ROAS

    The math is relatively straightforward. A 3x improvement in hook rate (from 10% to 30%) translates to 3x more shoppers seeing your product demonstration. If your demo is persuasive, your click-through rate improves. If your PDP is optimized, your conversion rate holds. The same ad spend now generates more clicks and more conversions. ROAS improves not because the bid changed or the keyword list improved, but because the creative is doing more work per impression.

    This mechanism also explains why brands that focus exclusively on bid optimization hit a ROAS ceiling they can’t push through. Bid optimization competes for existing demand. Creative optimization generates more yield from the same demand. They’re different levers. In a mature account with clean keyword coverage, creative is the remaining lever with meaningful headroom.

    The Anatomy of a Real SBV Iteration Loop (Stage by Stage)

    A structured SBV iteration loop has six stages, and the order matters. Skipping stages or rearranging them produces the noise-instead-of-signal problem that keeps most programs stalled.

    Stage 1: Hypothesis Formation

    Before a single frame of video is produced, you need a written hypothesis. The format is simple: “We believe that changing [Variable X] from [Current State] to [Test State] will improve [Metric Y] because [Reason Z].” Every word in that sentence is load-bearing.

    The variable must be singular and isolable. “We’re going to test a new creative direction” is not a hypothesis — it’s a production order. “We’re going to test a hook that leads with the problem our product solves versus our current hook that leads with product features, and we expect this to improve hook rate because our shopper research indicates customers are searching for solutions, not products” — that’s a testable hypothesis.

    The reason matters because it forces you to think mechanistically about why one variation should outperform another. If you can’t articulate a mechanism, you’re guessing. Guessing occasionally produces a winner, but it never produces a principle.

    Stage 2: Variant Production with Controlled Isolation

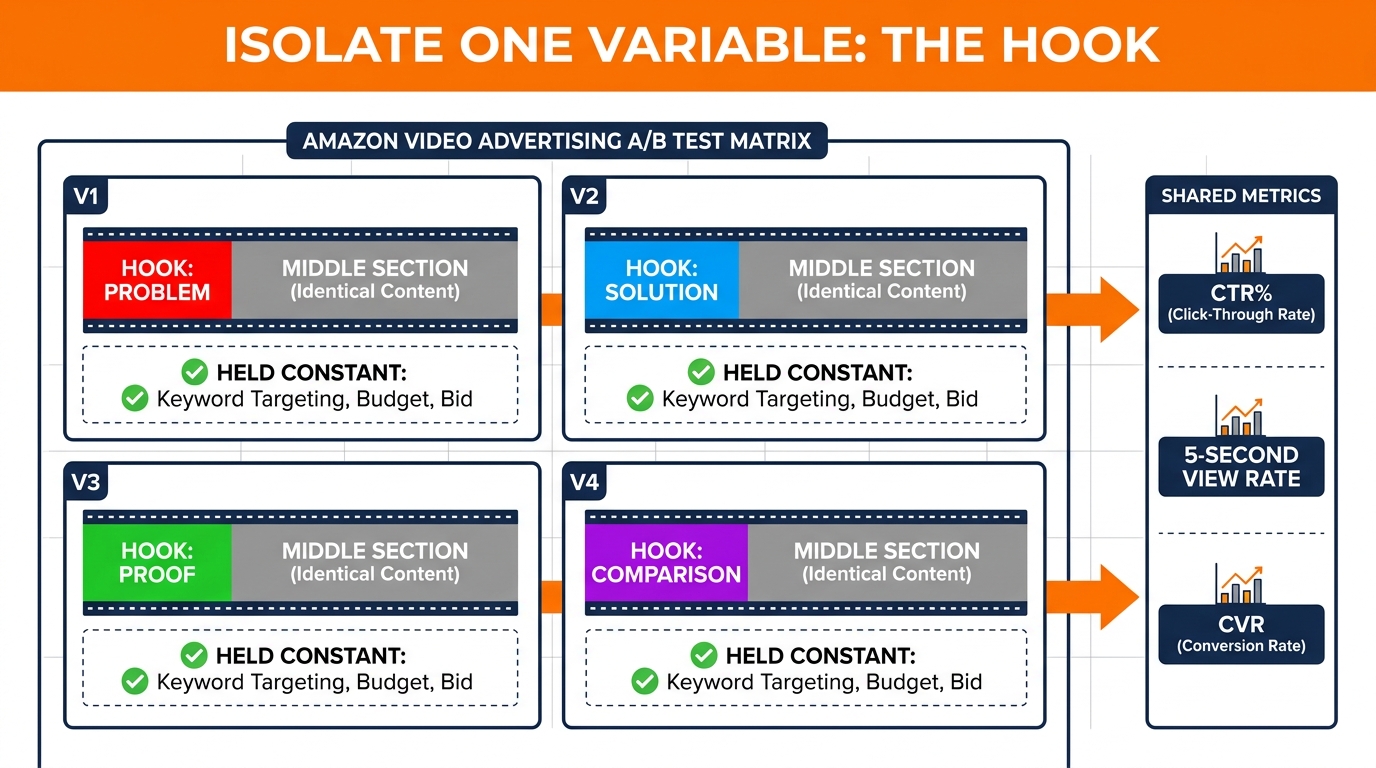
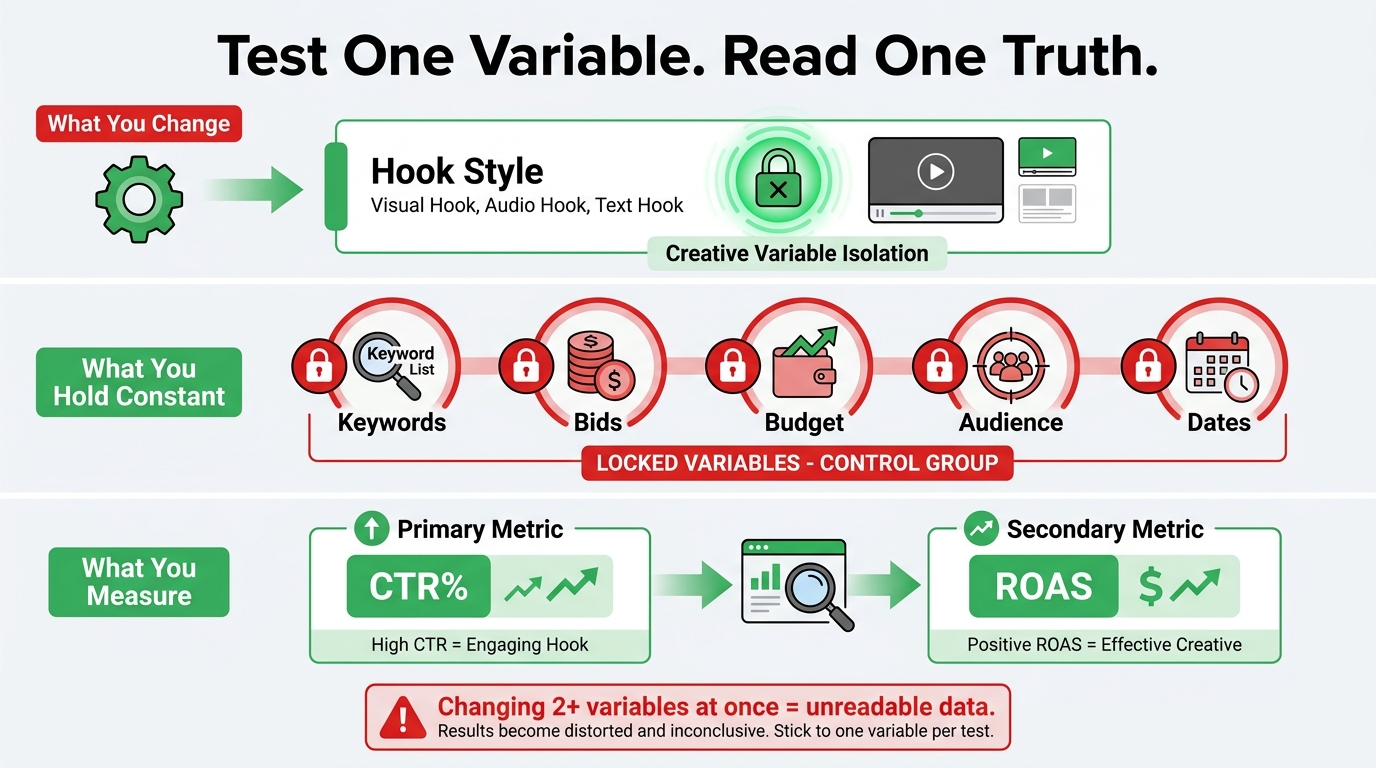
    Once the hypothesis is written, produce two to three variants — the control (your current best performer) and one or two test variations that isolate the variable you’re testing. Everything outside the test variable should be held constant: same run length, same body content, same end card, same keywords, same bids.

    This is where most teams introduce contamination. They change the hook AND update the background music AND add captions for the first time. When the test variant outperforms the control, they don’t know which change drove the result. The insight is lost. The process has to restart.

    Production discipline at this stage feels constraining. It is. That’s the point. Constraints generate signal. Creative freedom generates noise.

    Stage 3: Campaign Structure for Signal Isolation

    Each creative variant must run in its own ad group, targeting the same keyword set, with the same bids. Amazon’s one-ad-group-per-SBV-campaign structure actually enforces some of this discipline by default, but many advertisers work around it in ways that muddy the data. The key is that impression volume should be distributed across variants in a way that gives each variant enough data to reach statistical significance before you make a call.

    A common mistake is running variants inside a single campaign where Amazon’s optimization algorithm starts funneling spend toward whichever creative the algorithm prefers in the early days — before you have enough data to know whether that preference is meaningful. Isolating ad groups preserves your ability to gather balanced data.

    Stage 4: Signal Gathering with Predefined Thresholds

    Define your success thresholds before the test launches, not after you see the results. Decide: at what CTR differential will you call this test? At what hook rate? Over what time window and minimum impression count? Without predefined thresholds, you’re subject to the human tendency to call tests early when results look promising and extend them indefinitely when they don’t.

    A reasonable framework: run for a minimum of 7 days (to capture weekly behavioral patterns), require at least 1,000 impressions per variant, and set a minimum CTR or hook rate differential of 15–20% before calling a directional winner. Below that threshold, you’re in noise territory.

    Stage 5: Winner Identification and Principle Extraction

    When a winner emerges, document two things: the result (which variant won, by how much) and the principle (what this tells you about your shopper’s decision-making). The principle is the durable asset. Results expire when the winning ad fatigues. Principles travel across campaigns.

    Stage 6: Next Hypothesis Formation from the Winner

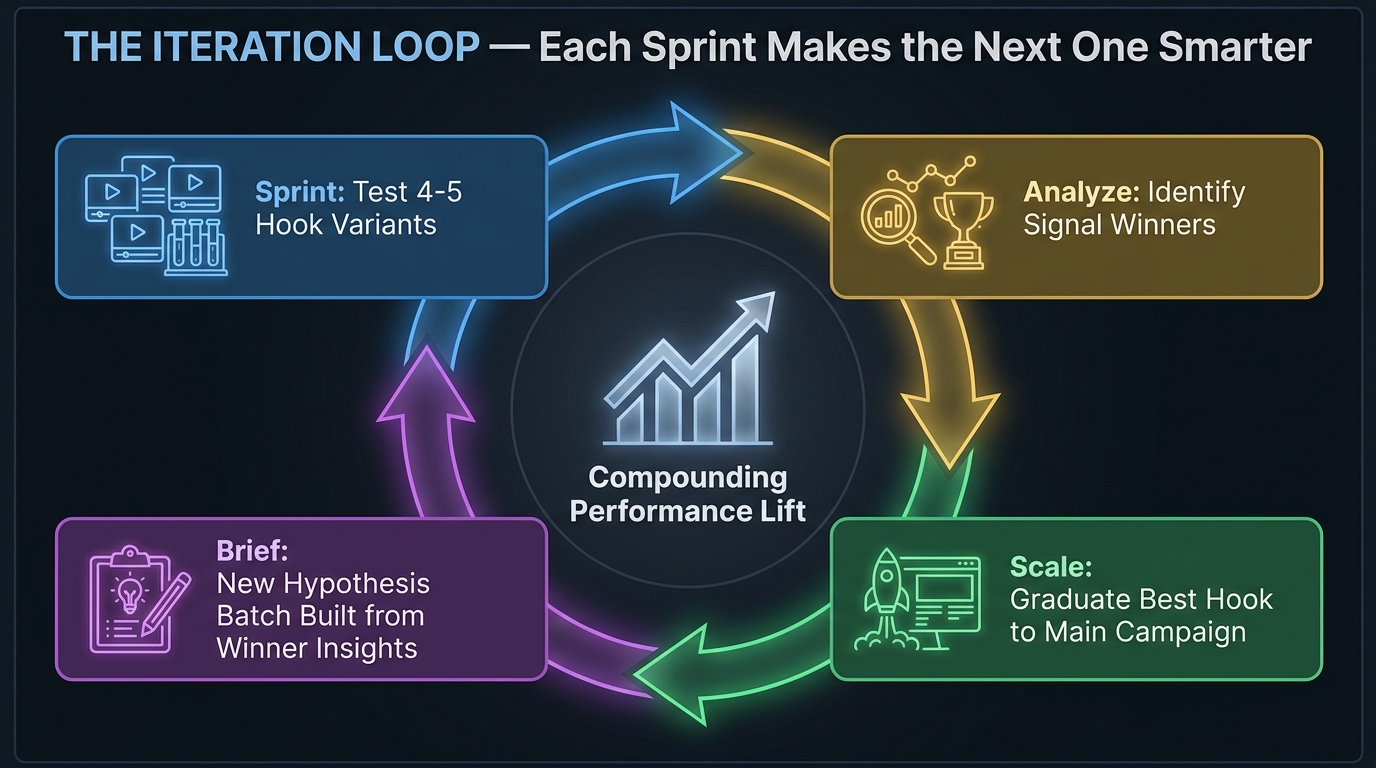
    The winning variant becomes the new control. You form a new hypothesis based on what you learned. The loop closes. If hook variant A beat hook variant B because problem-framing outperformed feature-framing, your next hypothesis might test two different problem framings against each other — drilling deeper into the mechanism rather than returning to the top level. This is how the loop compounds.

    The Three Variables You Should Test First (And the Three Most Brands Test Instead)

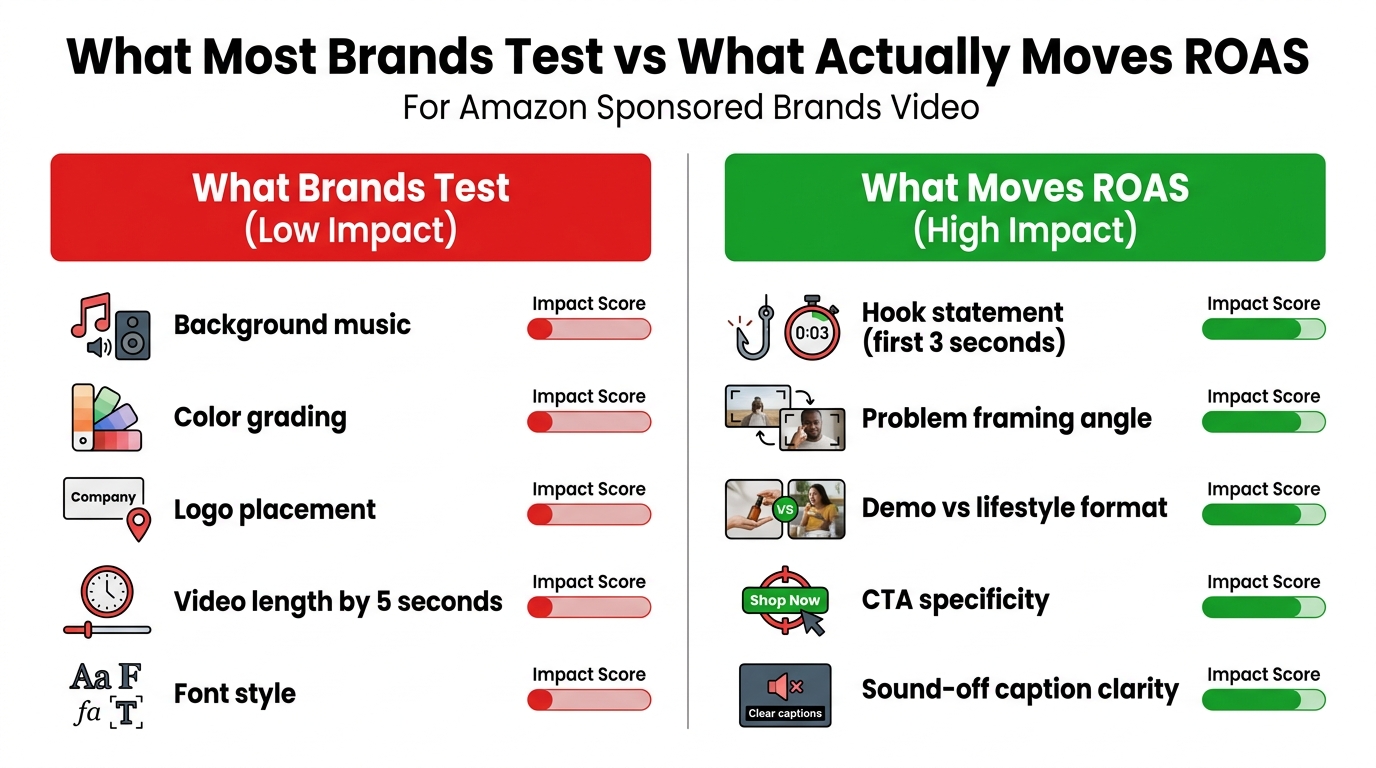
    Comparison of what brands test vs what actually moves ROAS for Amazon SBV ads — high-impact vs low-impact variables

    Creative testing is subject to a strong availability bias. Teams test what’s easiest to change — color grades, music tracks, logo placement, video length by a few seconds — because those changes require the least production effort and the least creative risk. They’re also the variables with the lowest ROAS impact. Meanwhile, the variables that actually move performance require more courage to test because they imply that fundamental assumptions might be wrong.

    The Three You Should Test First

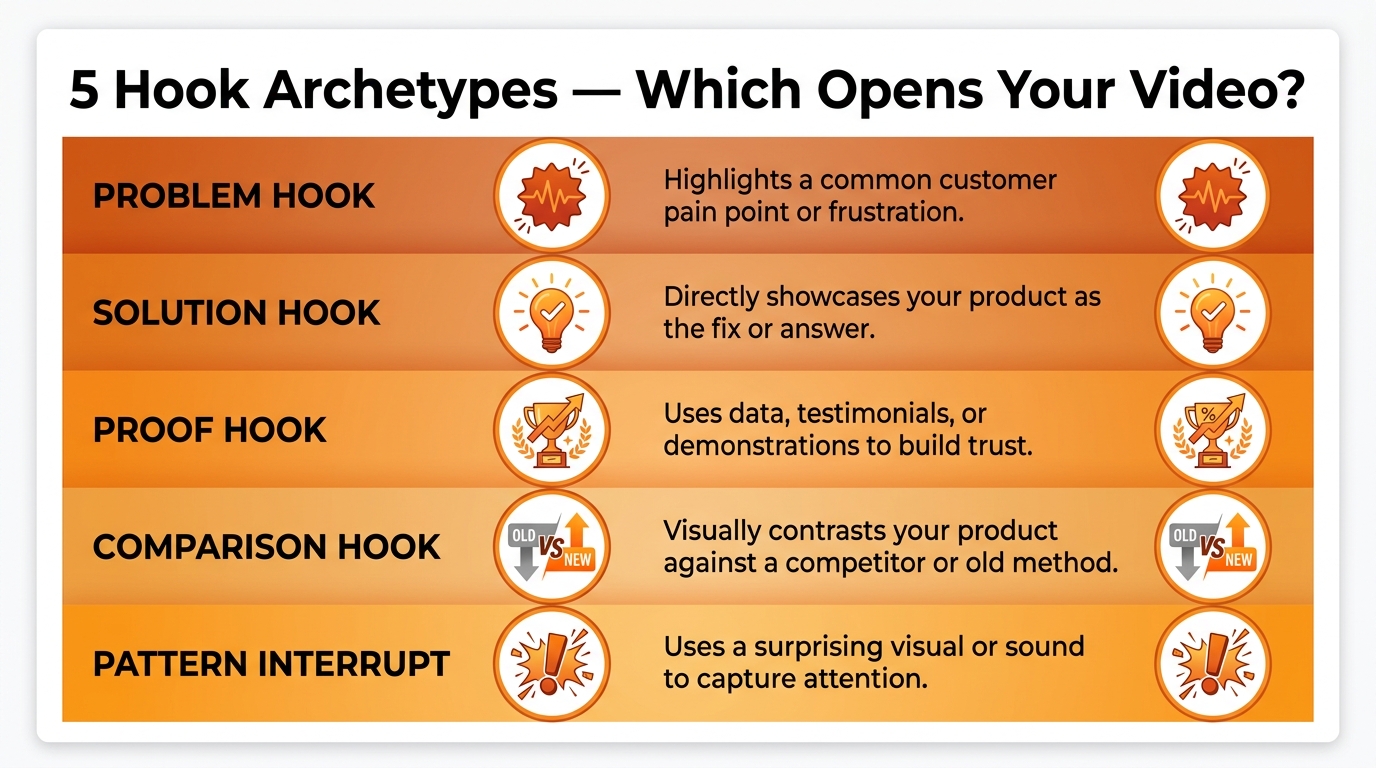
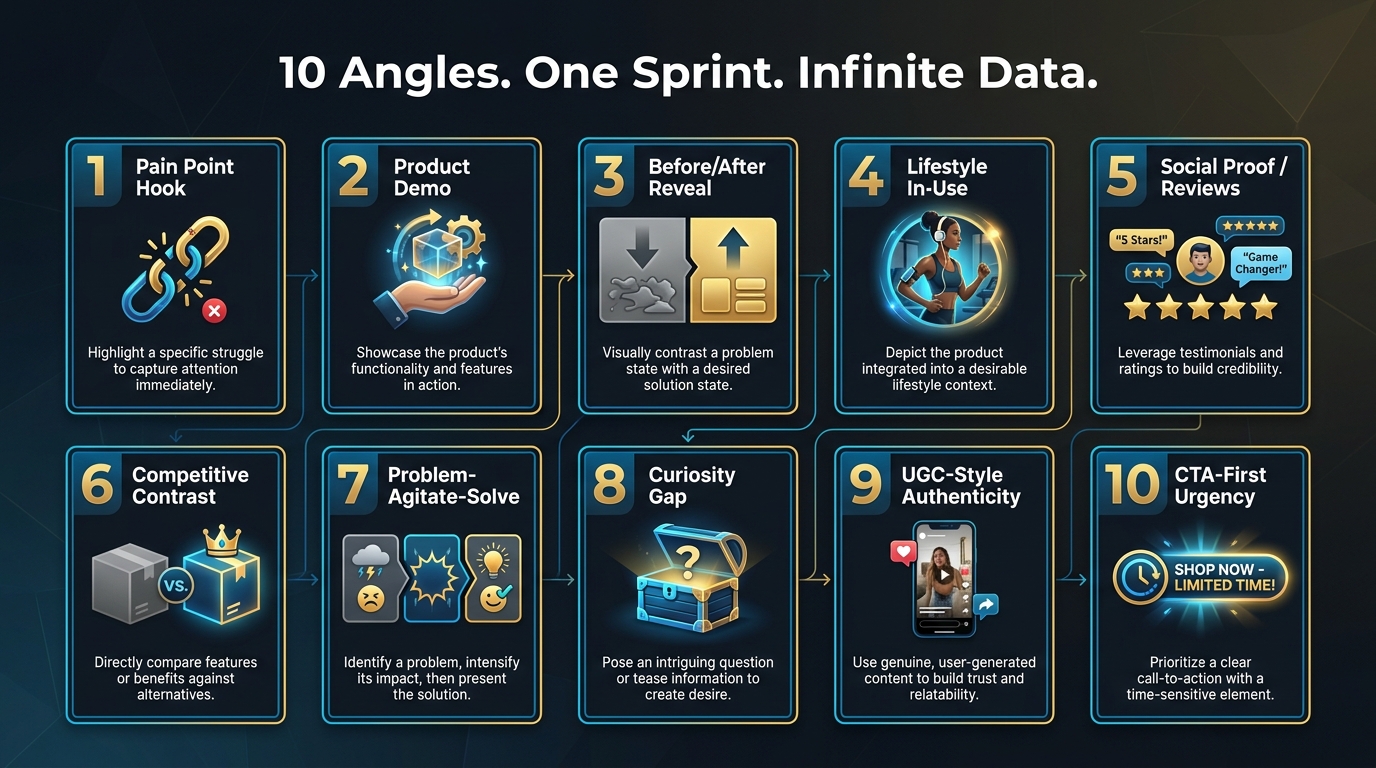
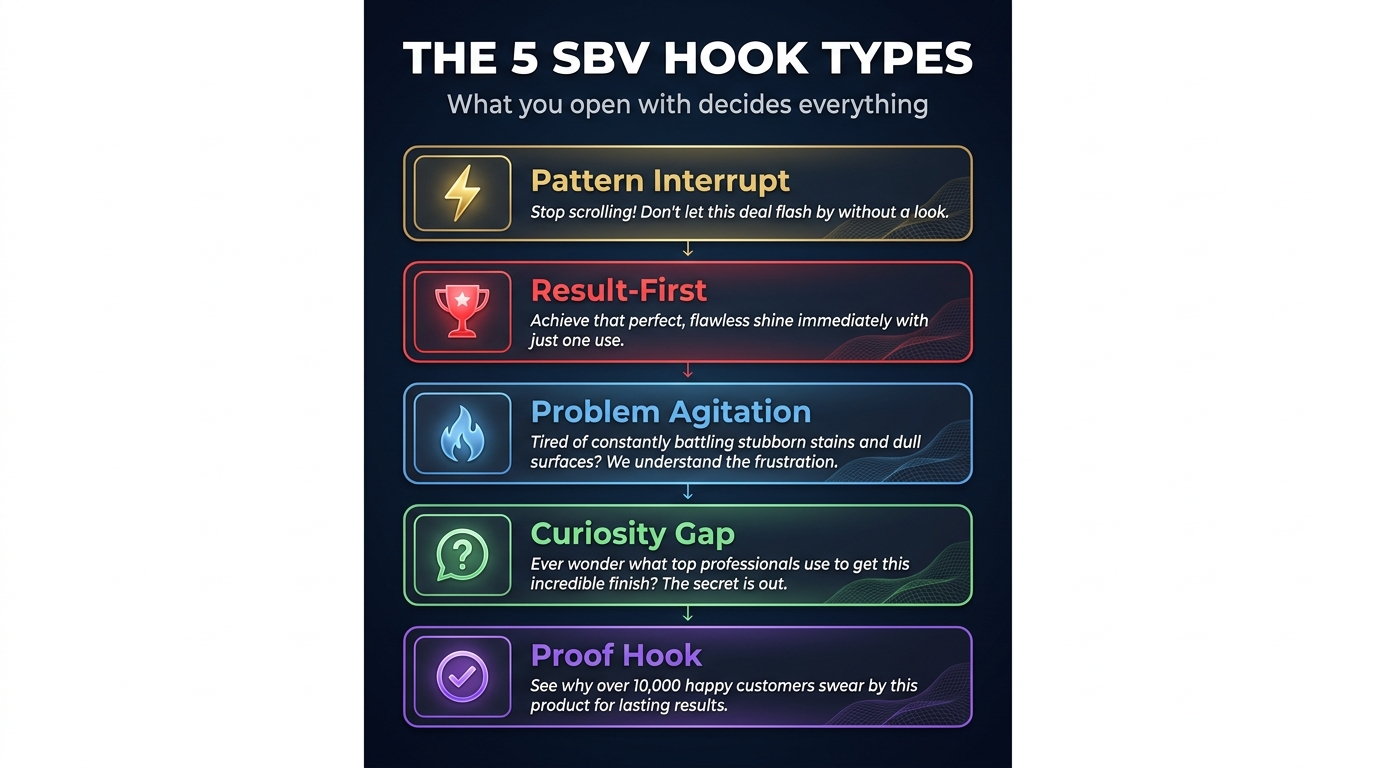
    1. Hook angle and opening statement. This is the highest-impact variable in an SBV ad and should be the first thing tested in any new creative program. The angle — problem-first vs. feature-first vs. social proof-first vs. curiosity-gap — determines whether your hook connects with the shopper’s current state of mind. Different angles work differently across categories, price points, and search intent types. You need to know which angle your specific audience responds to before optimizing anything else.

    2. Demo format: live action vs. product-in-use vs. graphic/motion. The visual language of your video body has a significant effect on purchase intent. Live action featuring real people using the product typically performs best for categories where trust and use-case demonstration matter (supplements, kitchen tools, fitness equipment). Motion graphics and product-focused animation perform better for categories where the product’s visual design or technical specifications are the main differentiator (electronics, beauty tools). This variable is category-dependent, which is exactly why it needs to be tested — assumptions about which format works are frequently wrong.

    3. Sound-off vs. sound-on optimization of the first five seconds. The majority of SBV impressions are delivered in sound-off environments. Shoppers on mobile in public spaces, or simply with their phone on silent, see the video without audio. A creative optimized for sound-on experiences — where narration carries the message and captions are an afterthought — will systematically underperform for the silent majority. Testing a sound-off-first version against your existing creative frequently produces hook rate improvements of 15–25% in mobile-heavy categories.

    The Three Most Brands Test Instead (And Why They’re Low-Leverage)

    1. Background music and audio track. This variable matters only to shoppers who are watching with sound on, which is a minority of your impression volume. Swapping music tracks rarely produces more than a single-digit CTR change and has near-zero effect on hook rate in sound-off environments.

    2. Color grading and visual tone. Unless your current color grading is actively creating a quality perception problem (extreme saturation, inconsistent brightness, or a palette that clashes with Amazon’s search page environment), aesthetic refinements to color are noise-level variables. Shoppers aren’t consciously evaluating color temperature in a 1.8-second hook window.

    3. Video run length within the “acceptable” range. Testing a 20-second video against a 25-second version produces minimal insight because the variable doesn’t affect the hook (the only dimension that determines whether the shopper clicks) and barely affects completion rates. The meaningful run length question is whether a dramatically shorter video — 10 seconds or under, essentially a hook-plus-CTA format — outperforms a traditional 20-second structure. That’s a different test with a real hypothesis behind it.

    Ad Group Architecture That Makes Iteration Measurable

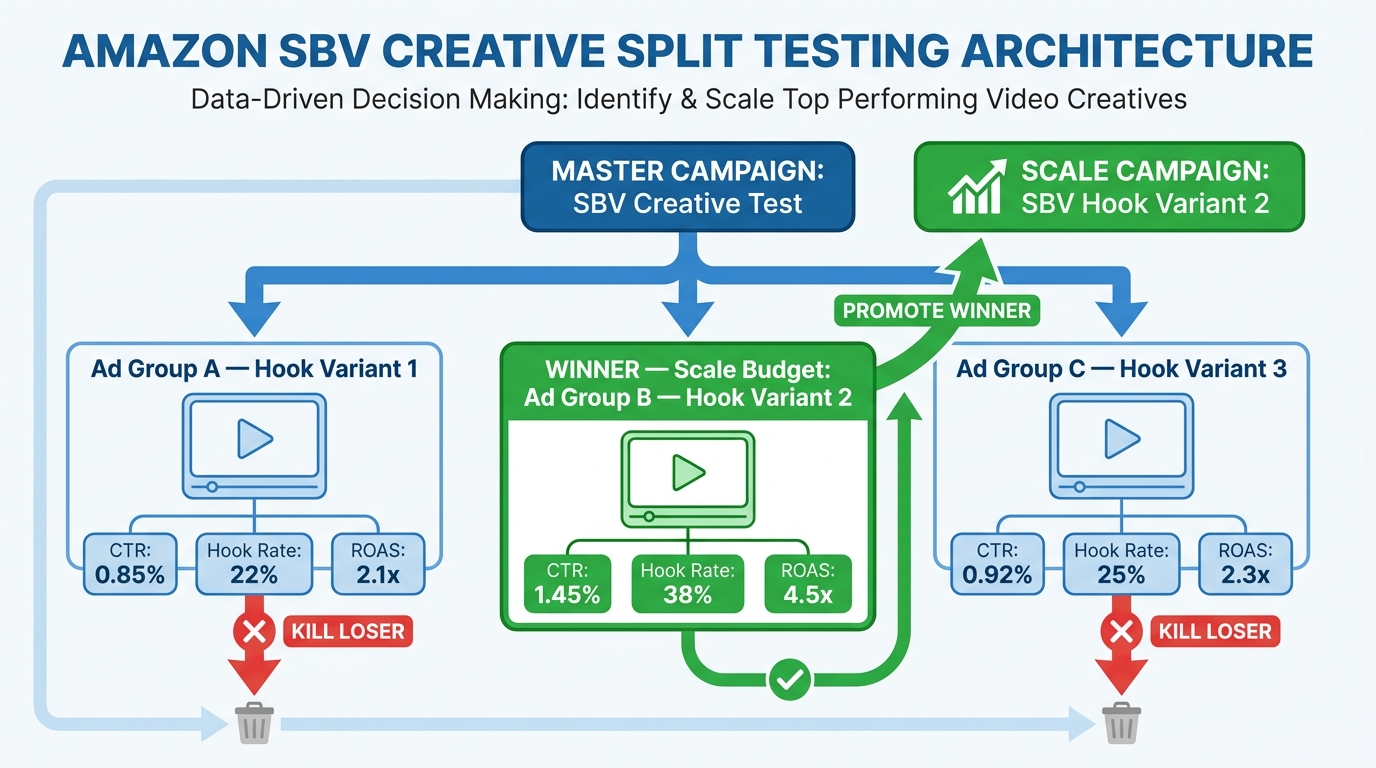
    Amazon SBV ad group architecture for creative split testing — campaign structure showing winner promotion workflow

    The mechanics of SBV campaign structure impose some constraints that you need to understand and build around. Unlike Sponsored Products, where you can run multiple ads within a single ad group, SBV campaigns are structured one-to-one: one campaign, one ad group, one creative. This has implications for how you run parallel tests.

    The Parallel Campaign Structure for Testing

    For creative iteration testing, build parallel campaigns that share the same keyword targets and bids but each contain a different creative variant. Label them clearly: [Product] | SBV | Hook Test | Control, [Product] | SBV | Hook Test | Problem-Angle, [Product] | SBV | Hook Test | Feature-Angle, and so on. Run them simultaneously with matched daily budgets.

    The risk with parallel campaigns is budget distribution — Amazon may deliver differently to each campaign based on Quality Score signals it generates early in the flight. To minimize this risk, run tests over a minimum of seven days (the first two to three days often show high variance as campaigns exit the learning phase) and evaluate results on impression-normalized metrics (CTR as a percentage, hook rate) rather than on raw spend, since absolute spend may not be perfectly matched across variants.

    The Isolation Protocol

    When running a creative test, apply a strict isolation protocol:

    • Same keyword list, same match types — keyword-level differences will contaminate results since different search queries attract shoppers at different intent stages
    • Same bid levels — bid differences affect placement, which affects the quality of the audience that sees each variant
    • Same daily budget caps — budget constraints create artificial delivery throttling that can mimic creative underperformance
    • Same product targeting (if used) — ASIN and category targeting bring different audience signals than keyword targeting, so mixing them between variants destroys comparability
    • Same attribution window for evaluation — Amazon offers 1-day, 7-day, and 14-day attribution windows. Choose one and stick with it for the duration of the test

    Scaling the Winner Without Losing the Architecture

    When a variant wins, pause the losing variants but do not delete them. Archive the data from the losing campaigns before pausing — you’ll want those performance numbers when you’re forming the next hypothesis. Scale the winning campaign by increasing daily budget incrementally (20–30% increases, not overnight doubles, which can disrupt delivery consistency) and maintain the naming convention so your account structure remains interpretable six months from now.

    Reading the Signals: When to Kill, When to Scale, When to Iterate

    One of the most operationally important skills in a creative iteration program is knowing when to make a call. Running tests too long wastes budget. Calling tests too early wastes learning. The signals that should drive your decisions are ordered — some are leading indicators, some are lagging. Using the wrong indicator at the wrong stage is a common source of bad calls.

    Leading Indicators: Act on These Early

    Hook rate is the earliest reliable signal. It’s observable within the first 48–72 hours of a campaign if impression volume is sufficient. A hook rate significantly below 15% (especially for variants in a category where your control runs at 25–30%) is a strong signal of structural creative failure. At sub-10% hook rate, there’s no version of the downstream video that will recover the campaign performance. Call it early. Redirect the budget.

    CTR is also available early but should be read alongside hook rate, not instead of it. A low CTR with a high hook rate means shoppers are watching but not clicking — a body or CTA problem. A low CTR with a low hook rate means you’ve lost them before the body begins — a hook problem. These diagnoses require different interventions.

    Lagging Indicators: Wait for These Before Scaling

    ROAS and ACOS are the definitive scaling signals, but they require a longer observation window (minimum 7–14 days with the 7-day attribution window active) to stabilize. ROAS on day 2 of a campaign is nearly meaningless — it’s subject to attribution timing effects, early audience self-selection (early clickers in a campaign’s life are often atypical), and learning phase volatility. Brands that scale winners based on 3-day ROAS data frequently scale noise.

    Video completion rate is relevant for body optimization tests (testing different demo formats, narrative structures, or product demonstrations). A high completion rate with a low CTR indicates the video is engaging but failing to generate purchase intent — a common pattern in lifestyle-forward videos that are beautiful to watch but too vague in their product communication.

    The Kill Threshold vs. The Scale Threshold

    These should be different numbers, not symmetric. Your kill threshold — the performance level at which you stop spending on a variant — should be set lower and evaluated earlier. You don’t need statistical certainty to kill a loser; you just need enough data to recognize that a variant is not competitive. Your scale threshold — the performance level at which you increase budget behind a winner — should be set higher and evaluated later. Scaling a false positive is more expensive than being slow to scale a real winner.

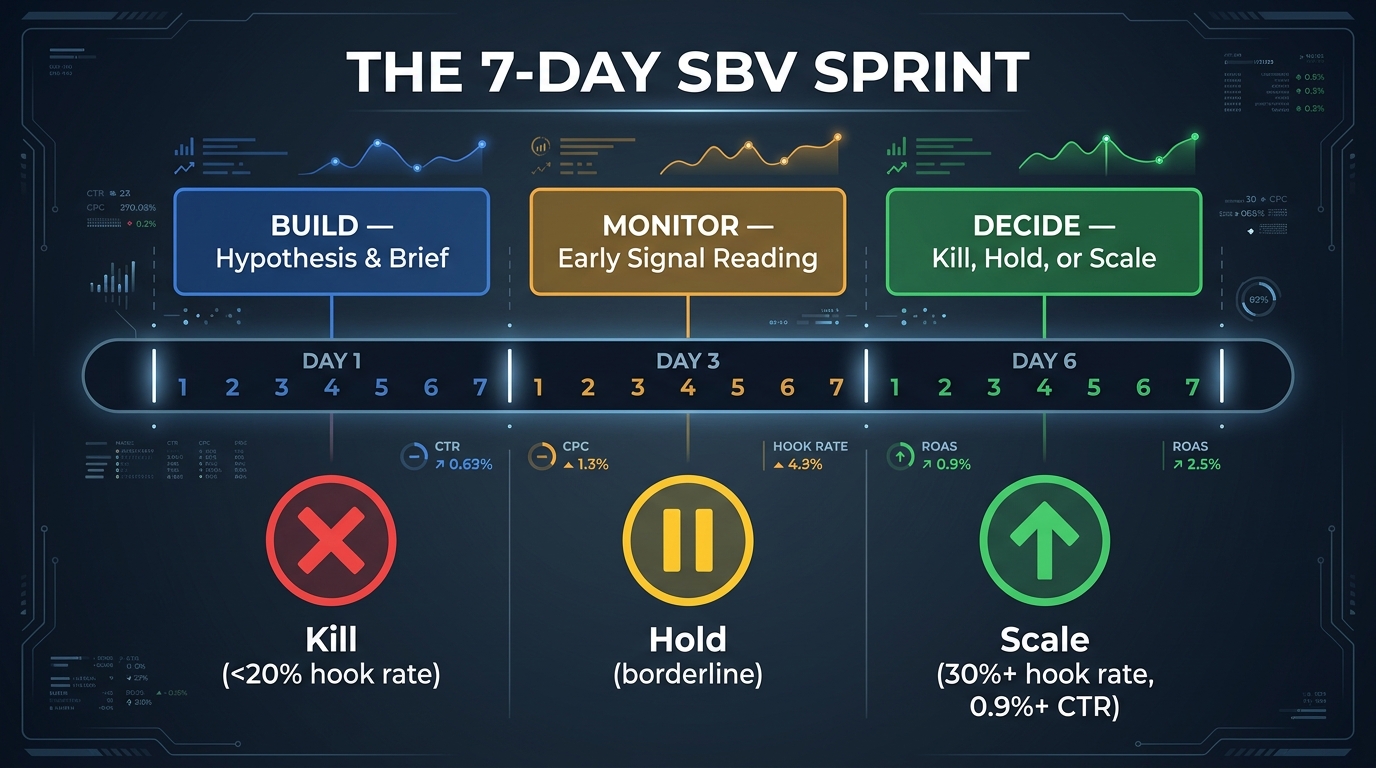
    A practical calibration: kill a variant if it’s underperforming the control on CTR by more than 30% after 5 days and 500+ impressions. Scale a winner if it’s outperforming the control on ROAS by more than 20% after 14 days and 1,500+ impressions. The asymmetry is intentional.

    Creative Fatigue Is Faster Than You Think — The Timeline Data

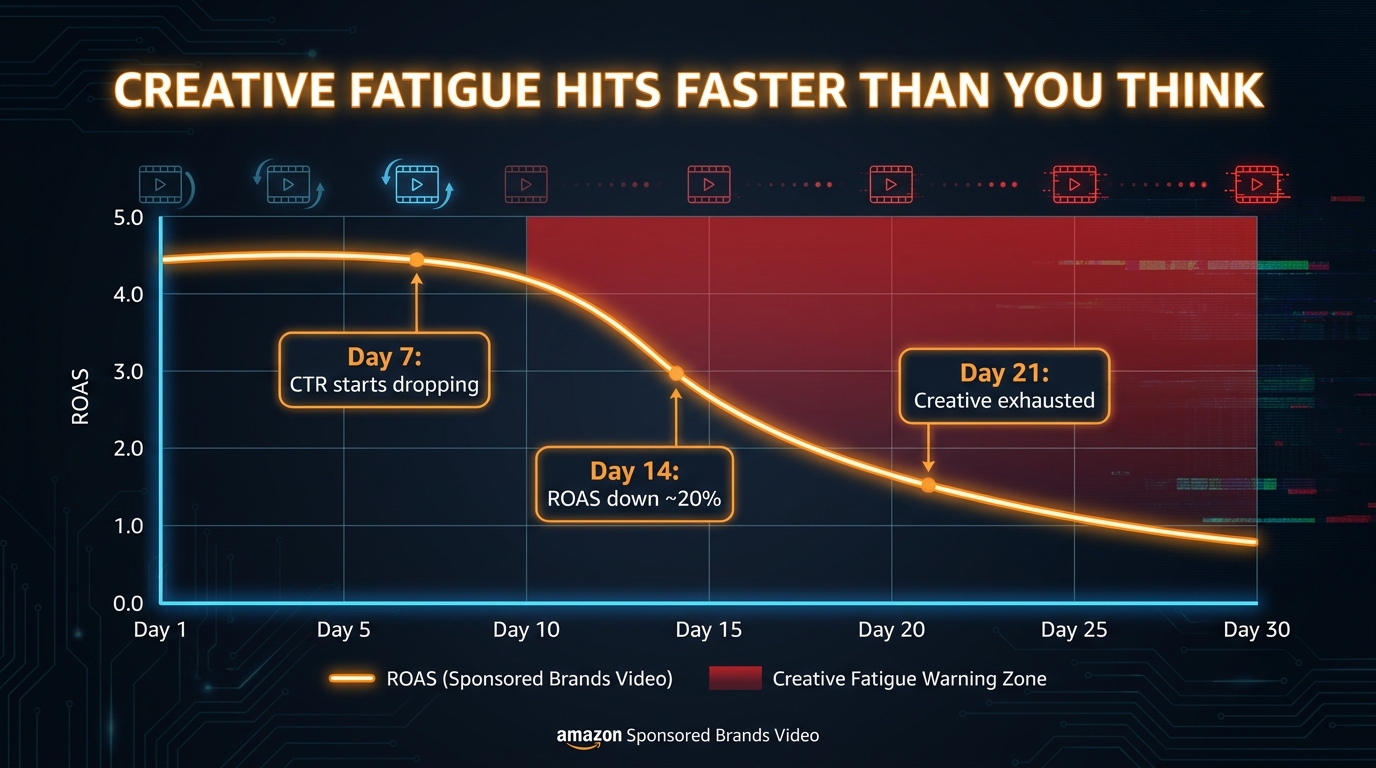
    Creative fatigue timeline for Amazon SBV ads showing ROAS decline beginning around Day 7-14 with warning zones marked

    Creative fatigue is not a hypothetical risk in SBV programs — it’s an operating constraint that needs to be baked into your production and iteration planning. And in 2026, the fatigue timeline is measurably faster than it was in prior years, for reasons that are structural rather than incidental.

    Why Fatigue Is Accelerating

    Amazon’s advertising ecosystem is more saturated than it was 24 months ago. Category-level impression volume has grown, but so has the number of advertisers competing for that inventory, and the frequency at which any individual shopper sees the same SBV creative has increased correspondingly. Amazon’s category benchmark data shows that SBV ads now account for approximately 3.5% of all top-20 search result placements — up roughly 34% year over year. More SBV ads in more positions means faster audience exhaustion for any single creative.

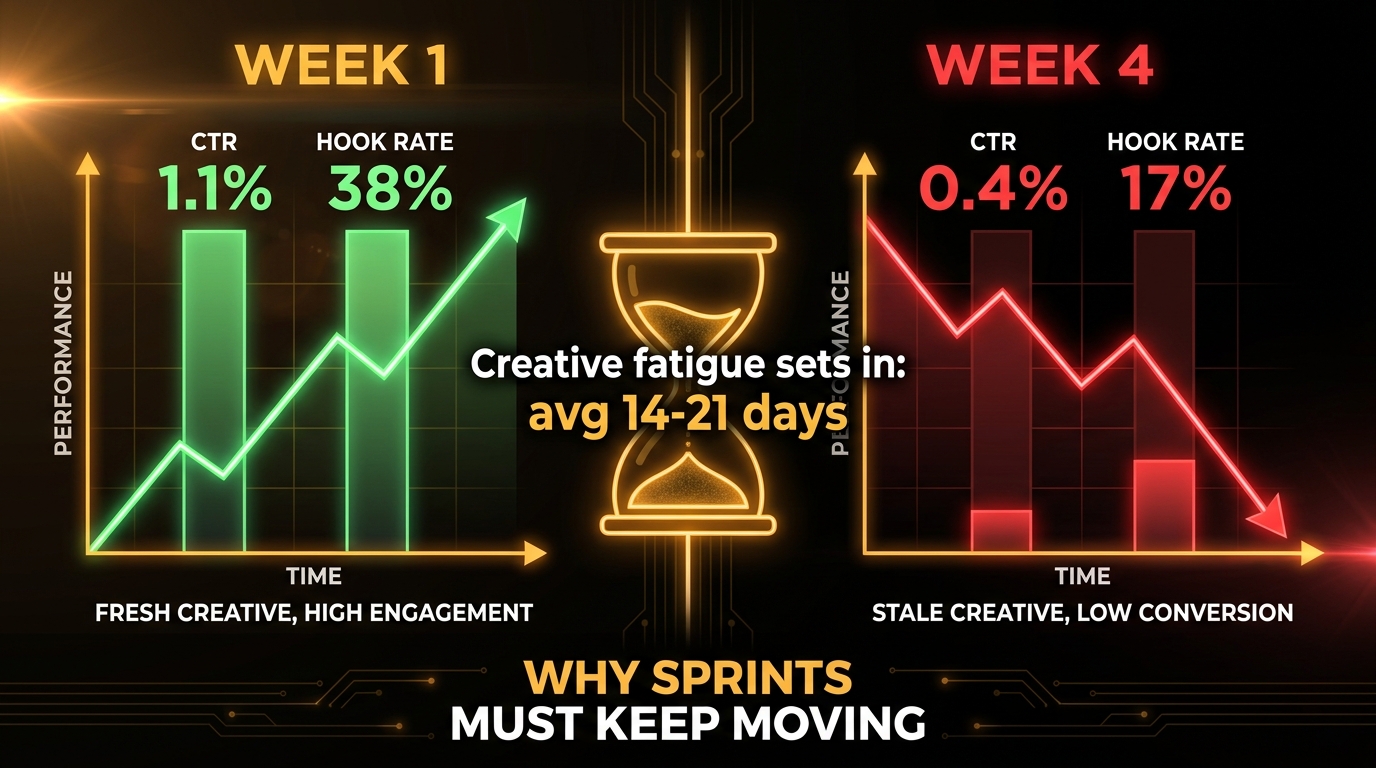
    The pattern is consistent: for high-spend accounts targeting competitive, high-volume keywords, creative CTR typically begins to soften after seven to ten days. By day fourteen, ROAS has often declined 15–25% from the first-week baseline for the same creative unit. By day twenty-one, most creatives are performing at a level that would not have justified their launch if the metrics had looked this way at the start.

    Fatigue Signals in Order of Appearance

    Fatigue doesn’t announce itself with a single dramatic drop. It follows a consistent signal sequence:

    1. Hook rate softens — shoppers who have already seen the ad recognize it and disengage faster. This is the first measurable signal, typically appearing after day 5–7 at meaningful spend levels.
    2. CTR follows — fewer shoppers make it far enough into the creative to feel compelled to click. CTR begins declining 2–3 days after hook rate softens.
    3. CPM starts rising — as CTR declines, Amazon’s auction efficiency worsens. Lower CTR signals lower relevance to the platform’s delivery system, which bids up CPM to compensate. Your cost-per-click increases even before you’ve registered the ROAS problem.
    4. ROAS drops — by this point you’re paying more per click for fewer clicks on an ad that’s generating less purchase intent. ROAS declines sharply, and many advertisers at this stage reach for bid reductions rather than creative refreshes — treating a creative problem as a media problem.

    The Practical Implication: Production Cadence as a KPI

    If your best-performing SBV creative has a meaningful lifespan of 14–21 days before fatigue begins to materially impair ROAS, and if your creative testing loop requires 7–14 days to identify a winner with statistical confidence, then your creative pipeline needs to be continuously producing variants — not in response to performance problems, but in advance of them.

    Leading SBV programs in 2026 treat creative production cadence as a KPI in its own right. They track the number of new variants entering the testing phase each week, the average time from hypothesis to launch, and the percentage of campaigns that have a tested replacement ready to deploy before the current winner enters the steep part of the fatigue curve. These operational metrics are not glamorous. They are what separates programs that maintain consistent ROAS from those that oscillate between strong weeks and crisis weeks.

    From Single Winner to Evergreen System: Building a Compounding ROAS Engine

    Compounding ROAS flywheel for SBV creative iteration showing five connected stages from launch to iterate

    There’s a significant difference between a brand that has found a winning SBV creative and a brand that has built a creative system that consistently produces winners. The former has a temporary advantage. The latter has a compounding one.

    The compounding effect comes from what you might call the Creative Intelligence Inventory — the accumulated library of tested principles, validated angles, and documented failure modes that your iteration program generates over time. Each completed loop contributes to this inventory. Each principle extracted from a test reduces the uncertainty cost of the next test. The loops get faster. The hits get more frequent. The losers get less expensive.

    Building the Creative Intelligence Inventory

    The Creative Intelligence Inventory is not a complex artifact. At its simplest, it’s a structured document (a shared spreadsheet or Notion database) that records each completed test: the hypothesis, the variable tested, the variants run, the results (with metrics), and the principle extracted. Every person working on SBV for your brand can read it. New team members can onboard from it. Agency partners can reference it instead of starting from scratch.

    Without this documentation discipline, your creative program has no institutional memory. When team members rotate, when agencies change, when campaigns are rebuilt, the learning evaporates. You’re perpetually starting over. This is far more common than it should be.

    The Winner Iteration Principle

    Once a creative has been validated as a winner, it should not simply be scaled and forgotten until it fatigues. It should immediately become the source material for the next wave of tests. If hook variant A beat hook variant B, the next test should explore two sub-variants of hook type A — drilling down into what specifically within that angle is driving performance.

    This progressive refinement is how you go from “problem-framing hooks outperform feature-framing hooks” to “hooks that cite a specific common frustration outperform generic problem statements by X%” to “hooks that use a direct-address question about that frustration outperform declarative statements by Y%.” Each iteration narrows the target. The creative gets more precise. The audience recognition — the sense that this ad is speaking directly to me — gets stronger. CTR rises. Hook rate rises. ROAS rises.

    Evergreen Creative Architecture

    An evergreen SBV system runs three tiers of creative simultaneously:

    • Tier 1: Scale campaigns. Your current best-performing validated winners running at full budget. These are not being tested — they’re producing revenue. They’re being monitored for fatigue signals.
    • Tier 2: Active test campaigns. New variants testing the next hypothesis, running at modest test budgets (typically 10–20% of total SBV spend) with the isolation architecture described earlier.
    • Tier 3: Production pipeline. Creatives in production or pre-production, based on hypotheses already formed, designed to be ready for deployment as soon as a Tier 2 test resolves.

    This three-tier structure means you’re never in a position where your winning creative has fatigued and you have nothing to replace it. The pipeline is continuous. ROAS doesn’t crash because creative fails — it transitions.

    Common Iteration Mistakes That Stall ROAS Growth

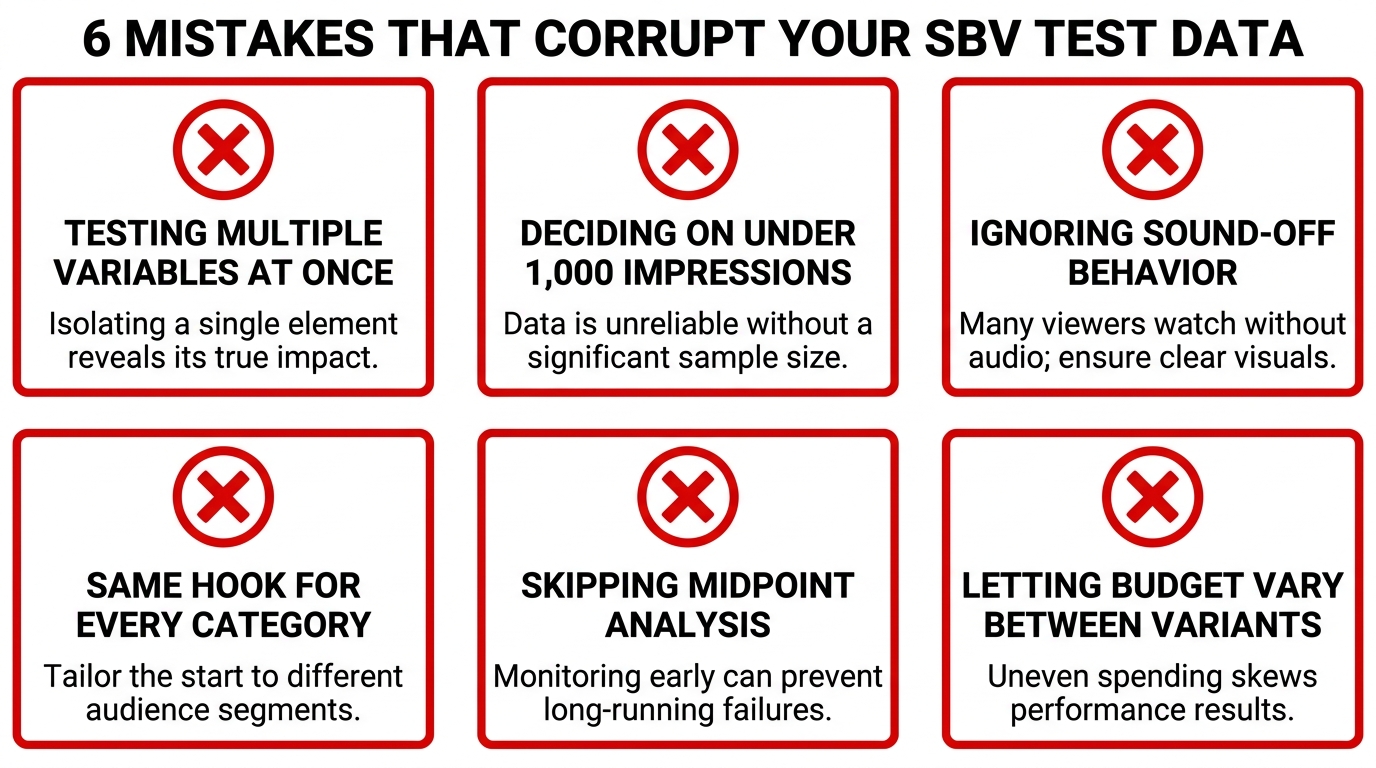
    Most SBV programs that plateau aren’t failing because of bad creative talent or insufficient budget. They’re failing because of systematic process errors that prevent the iteration loop from generating usable signal. Here are the most common ones and what they actually cost.

    Mistake 1: Changing Multiple Variables Simultaneously

    This is the most widespread error in creative testing and the one with the highest cost in wasted learning. When you change the hook angle, add captions, trim the video length, and update the end card all at once, you’ve created what statisticians call a confounded experiment. When one version wins, you know something changed — you don’t know what changed. The principle extraction is impossible. You’ve spent the budget of a test and produced the learning value of a coin flip.

    Mistake 2: Testing on Insufficient Volume

    Calling a creative test on fewer than 500 impressions per variant is guesswork with a numerical veneer. CTR at 300 impressions is not a statistic — it’s a trend line drawn through three data points. This mistake is especially common in newer accounts or in niche categories with lower search volume. If your keyword set doesn’t generate enough impression volume to reach statistical minimum in seven days, you need either broader keyword targeting for the test period or a longer test window before you make a call.

    Mistake 3: Using ROAS as the Only Test Metric

    ROAS is a lagging outcome metric. Using it as your primary test evaluation criterion means you’re reading the signal 10–14 days after the creative decision moment. By the time ROAS tells you that a creative is working, the early fatigue clock has already started. Build your evaluation framework around leading indicators (hook rate, CTR) that give you earlier signals, and use ROAS as the confirmation metric for scaling — not as the discovery metric for winningness.

    Mistake 4: Reacting to Fatigue Rather Than Anticipating It

    If you’re launching a new creative in response to a ROAS decline, you’re already behind. The fatigue timeline described earlier means that a ROAS decline is a lagging signal — the creative has already passed the point of meaningful engagement, the CPM has already risen, and you’ve been paying elevated costs for degraded performance for days before the ROAS number became alarming. Proactive creative refreshes, planned before the fatigue signal appears, consistently outperform reactive ones.

    Mistake 5: Treating All SKUs as Identical Creative Problems

    Different products within the same catalog have different creative iteration requirements based on their price point, purchase consideration length, competitive density, and shopper decision process. A $12 consumable product that shoppers buy impulsively has a very different hook, body, and CTA requirement than a $150 appliance that shoppers research for days before purchasing. Running the same creative framework across both without differentiation means you’re optimizing for one decision process while ignoring the other. Creative hypotheses should be product-class-specific, not catalog-wide.

    Mistake 6: Ignoring the Relationship Between SBV and Organic Rank

    This is the most underappreciated downstream effect of a well-run SBV creative program. Amazon’s A10 algorithm weighs recent sales velocity and conversion rate signals when determining organic rank. An SBV campaign with a high-performing creative drives elevated click-through and conversion volumes — which feeds positive velocity signals back into the organic ranking system. Over time, a consistently high-performing SBV program produces organic rank improvements that lower your dependence on paid spend to maintain visibility. The ROAS improvement is real and measurable; the organic rank benefit is a compounding secondary return that most brands don’t account for in their SBV ROI calculations.

    Building Your SBV Iteration Calendar

    Creative iteration programs fail for operational reasons as often as they fail for strategic ones. The loop breaks not because the framework is wrong but because production timelines slip, test launches get delayed, and the reactive-rather-than-proactive pattern reasserts itself. An iteration calendar turns strategy into a schedule.

    The 30-Day Iteration Cadence

    A realistic 30-day SBV iteration cadence for a single product line looks like this:

    • Days 1–3: Hypothesis review for the next test cycle. What did the previous test tell us? What’s the next variable to isolate? Brief is written, production is commissioned.
    • Days 4–10: Current test runs (if active). Monitor leading indicators daily. No calls before day 7 unless kill threshold is clearly breached.
    • Days 11–14: Test evaluation. Extract principle. Identify winner. Update Creative Intelligence Inventory. Begin pre-production on the next variant.
    • Days 15–17: Winner scaled. Losing variants paused. Production on next variants continues.
    • Days 18–25: Winner runs at scale. Monitor for fatigue signals. New variant production completed.
    • Days 26–28: New variants ready. Pre-launch review. Test campaigns set up, keyword lists confirmed, budgets aligned.
    • Days 29–30: New test launches. Cycle restarts.

    This cadence keeps the pipeline moving continuously. There is never a period when no test is running and never a period when no production is in progress. The machine doesn’t stop.

    Resource Requirements

    Running a continuous SBV iteration loop requires creative production resources proportional to your output target. For a single product line, producing two to three new creative variants per test cycle (roughly every 30 days) requires modest production capacity — especially as AI-assisted video production tools continue to reduce the time cost of iterating on existing assets while keeping the core footage constant.

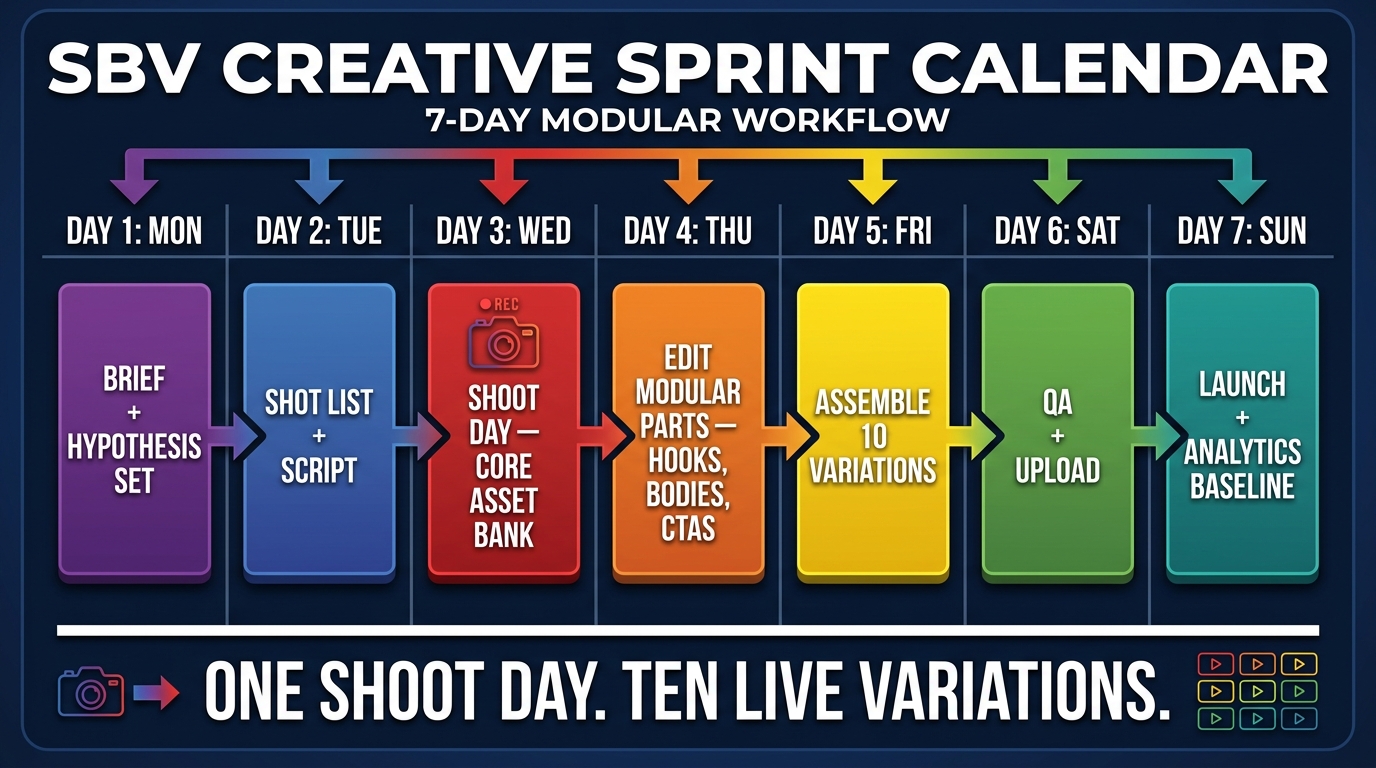
    The most efficient SBV programs use a modular production approach: shoot multiple hook variations in a single day with the same body footage, then edit them into separate final videos. This keeps the marginal cost of each additional variant low while maintaining the production isolation that makes testing valid. A single shoot day can generate enough raw material for two to three months of hook testing iterations if planned correctly.

    Conclusion: Creative Iteration Is a Discipline, Not an Event

    The brands consistently extracting ROAS growth from Sponsored Brands Video in 2026 are not doing anything exotic. They are not using secret ad formats or proprietary targeting data or algorithmic bidding systems that their competitors don’t have access to. They are running structured, hypothesis-driven creative iteration loops with disciplined ad group architecture, clear kill and scale thresholds, proactive production pipelines, and documented creative intelligence that compounds over time.

    The competitive gap between these brands and their competitors is not a creative talent gap — it’s a process gap. Most competitors are producing creatives. The leaders are producing learning. That distinction is visible in their ROAS trajectories. It’s also visible in their organic rankings, their brand awareness trends, and the durability of their performance through competitive events and seasonal disruptions.

    If there’s a single change that will produce the highest near-term ROAS movement in a stalled SBV program, it is this: test the hook, in isolation, with a clearly articulated hypothesis, over a minimum of seven days, before changing anything else. The hook is where the impression is won or lost. Every other optimization is secondary to that one moment of contact.

    The loop described in this post is not complicated. But it requires discipline to run consistently, institutional memory to make it compound, and the willingness to constrain creative freedom in service of signal quality. That combination — discipline, memory, constraint — is rarer than it should be. Which is exactly why it remains an advantage.

    Actionable Takeaways

    • Test your hook first, always. Write a formal hypothesis before any variant enters production. Change exactly one variable per test.
    • Build a Creative Intelligence Inventory — a documented record of every test, its results, and the principle it produced. Make it accessible to everyone touching SBV in your account.
    • Operate three creative tiers simultaneously: scale campaigns, active test campaigns, and a production pipeline. Never let the pipeline go empty.
    • Set kill thresholds and scale thresholds before launch, not after you see results. Define them asymmetrically: kill losers early on leading indicators, scale winners later on lagging ones.
    • Monitor fatigue signals in order: hook rate decline → CTR decline → CPM rise → ROAS drop. By the time ROAS drops, you’re already behind. React at hook rate.
    • Plan for a 14–21 day creative lifespan on high-spend SBV campaigns. Build your production cadence backward from that constraint.
    • Account for the organic rank benefit of a high-converting SBV program in your ROI calculations. The paid ROAS number understates the total value of getting creative performance right.
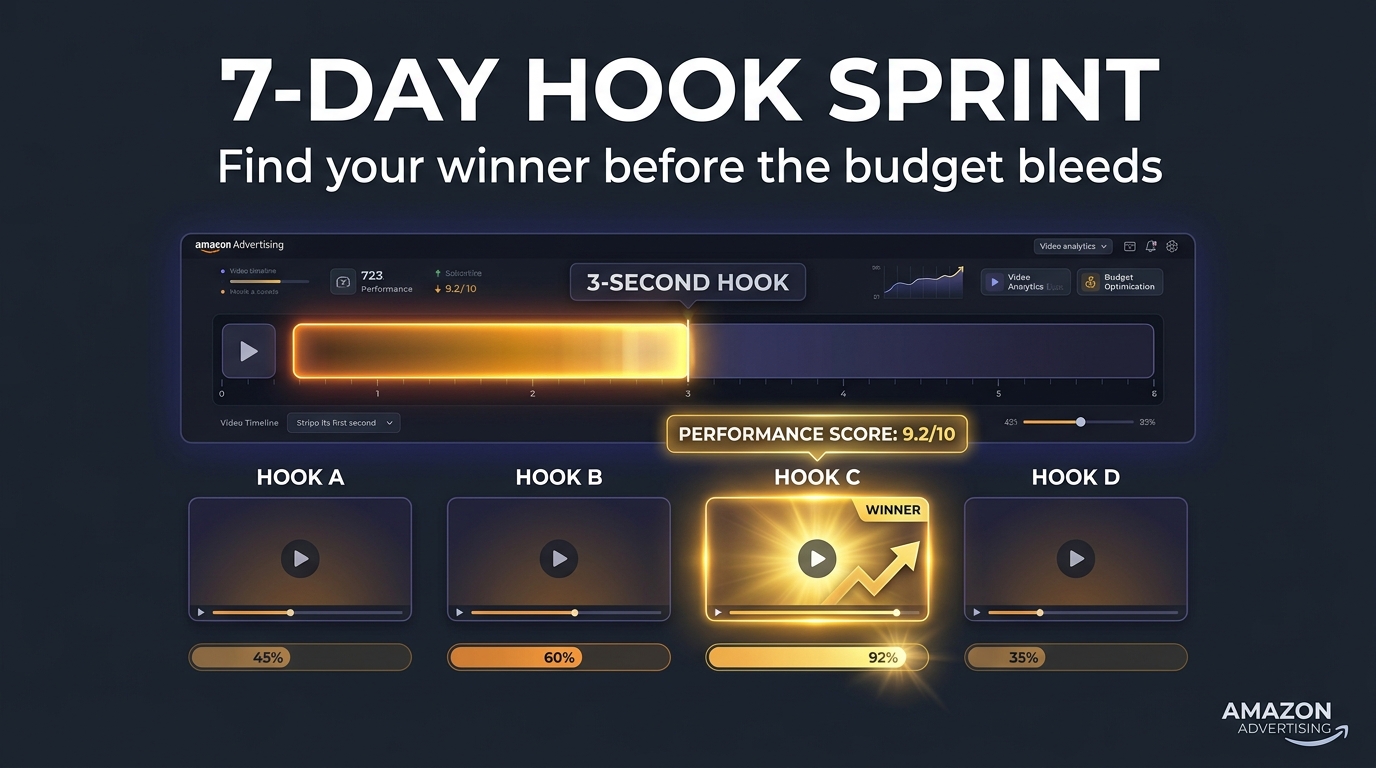
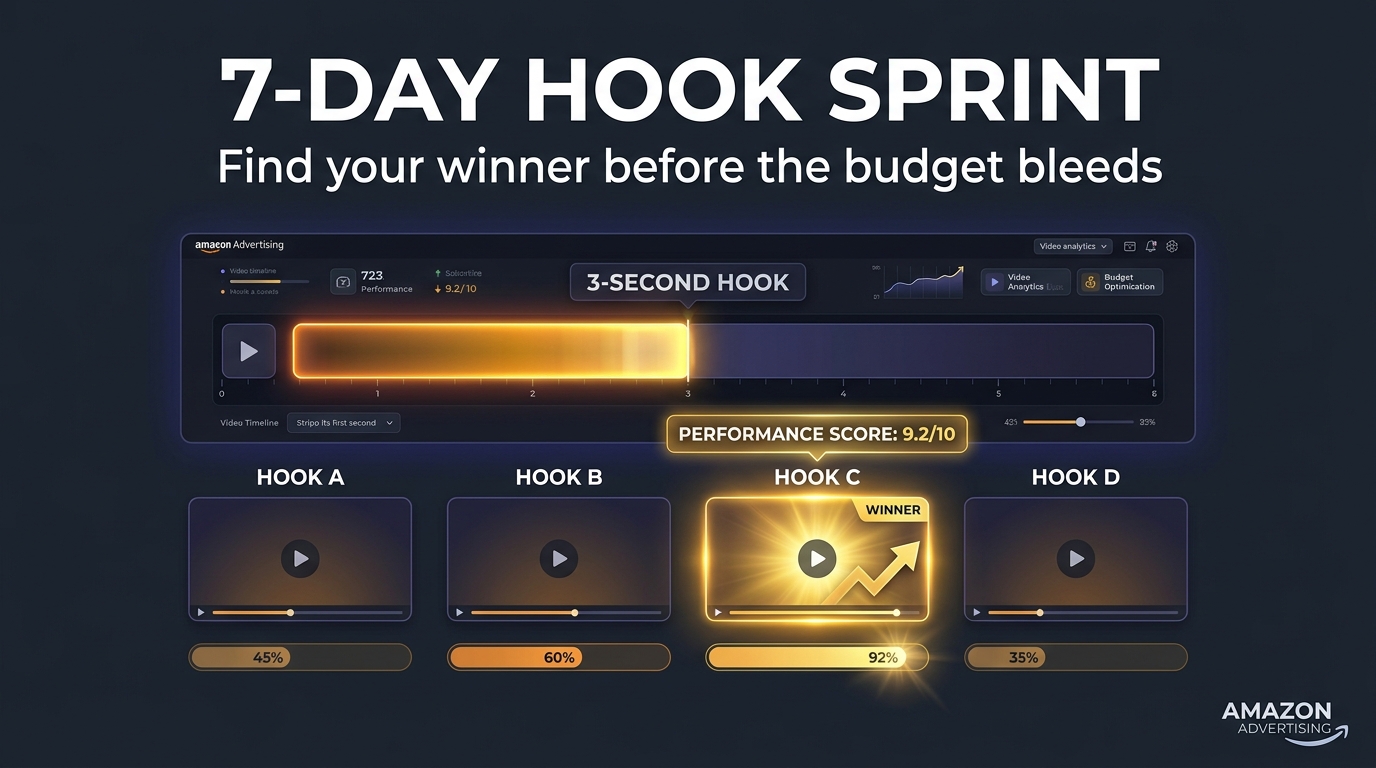
  • Creative Iteration Sprints for SBV: A 7-Day Test Framework That Actually Scales

    Creative Iteration Sprints for SBV: A 7-Day Test Framework That Actually Scales

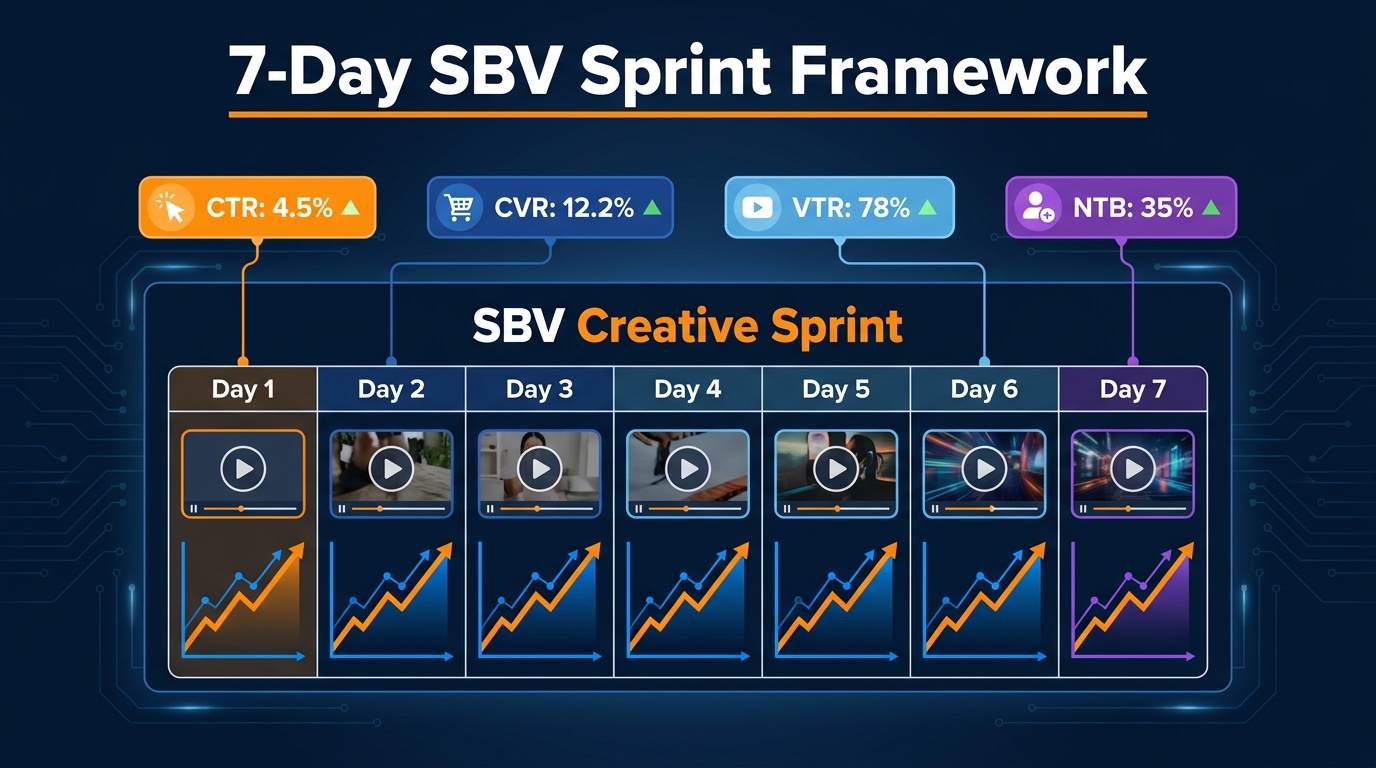
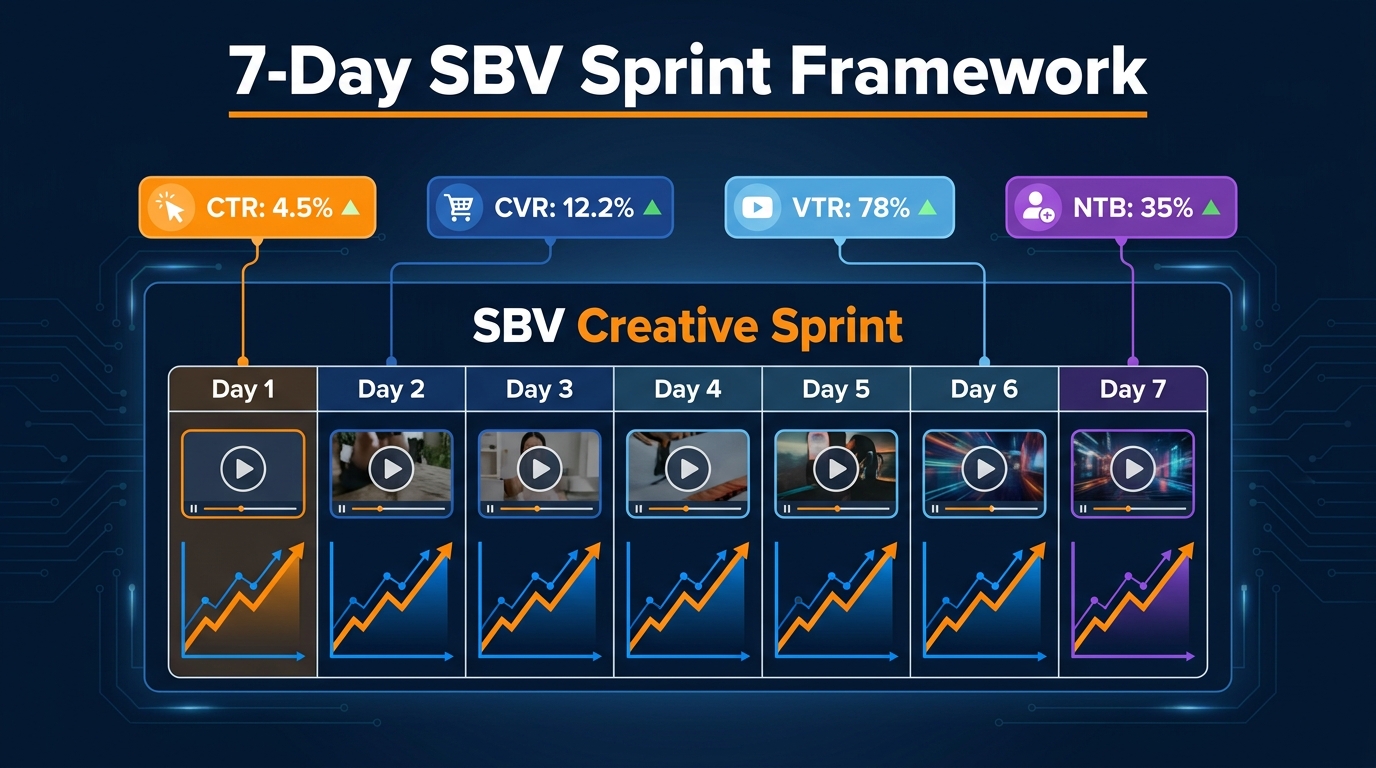
    7-Day SBV Creative Sprint Framework infographic showing a calendar grid with rising performance metrics

    Most Amazon advertisers treat Sponsored Brands Video (SBV) creative testing like they treat their garage: things get thrown in, nothing gets organized, and eventually you stop going in there. A new video goes live because someone had an idea. It runs for three months without a single look at the view metrics. Then performance dips, a new video gets made, and the whole cycle repeats with no institutional knowledge gained and no compounding advantage built.

    That approach to SBV creative was barely tolerable when Sponsored Brands Video was a secondary format. It is actively damaging in 2026, when SBV accounts for roughly 58% of Sponsored Brands spend across advanced managed portfolios. When your dominant ad format is running on creative intuition instead of a tested system, you are essentially managing your biggest lever by feel.

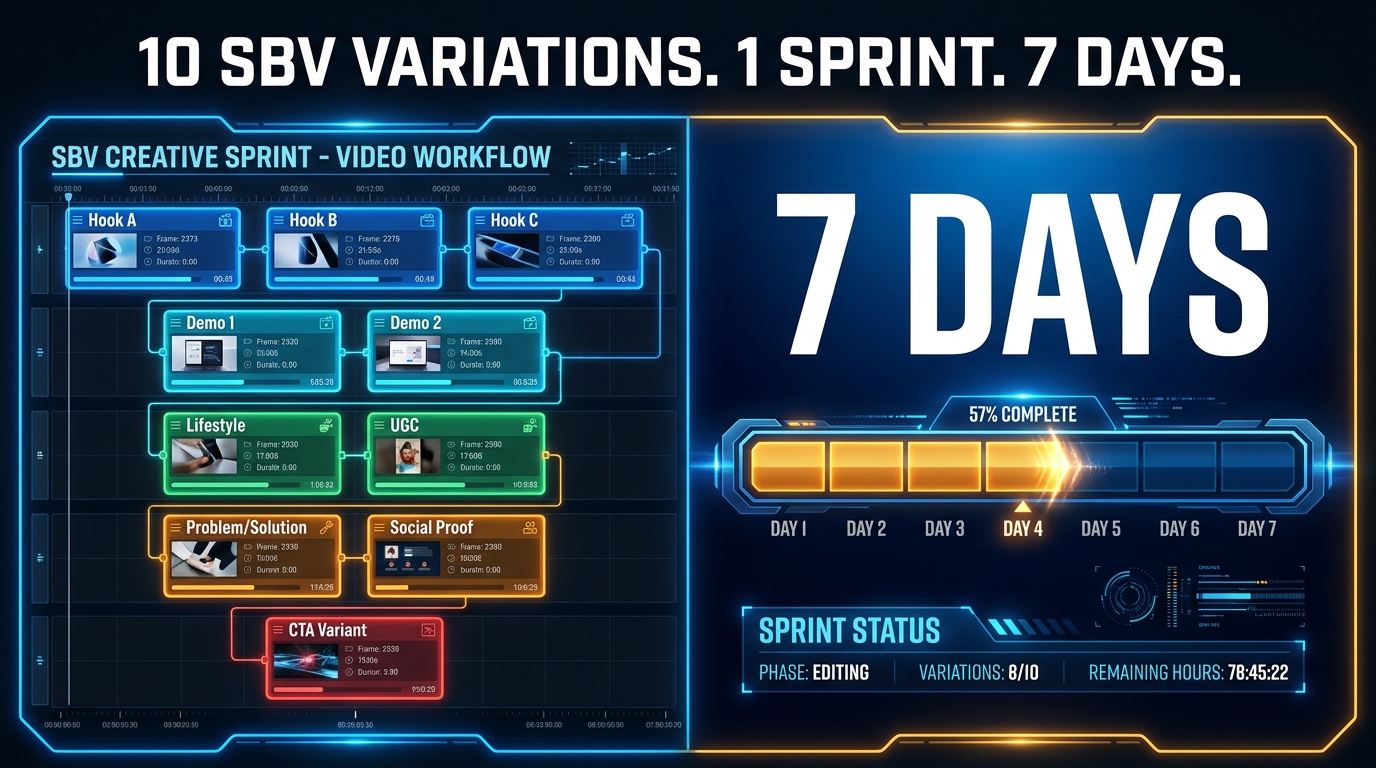
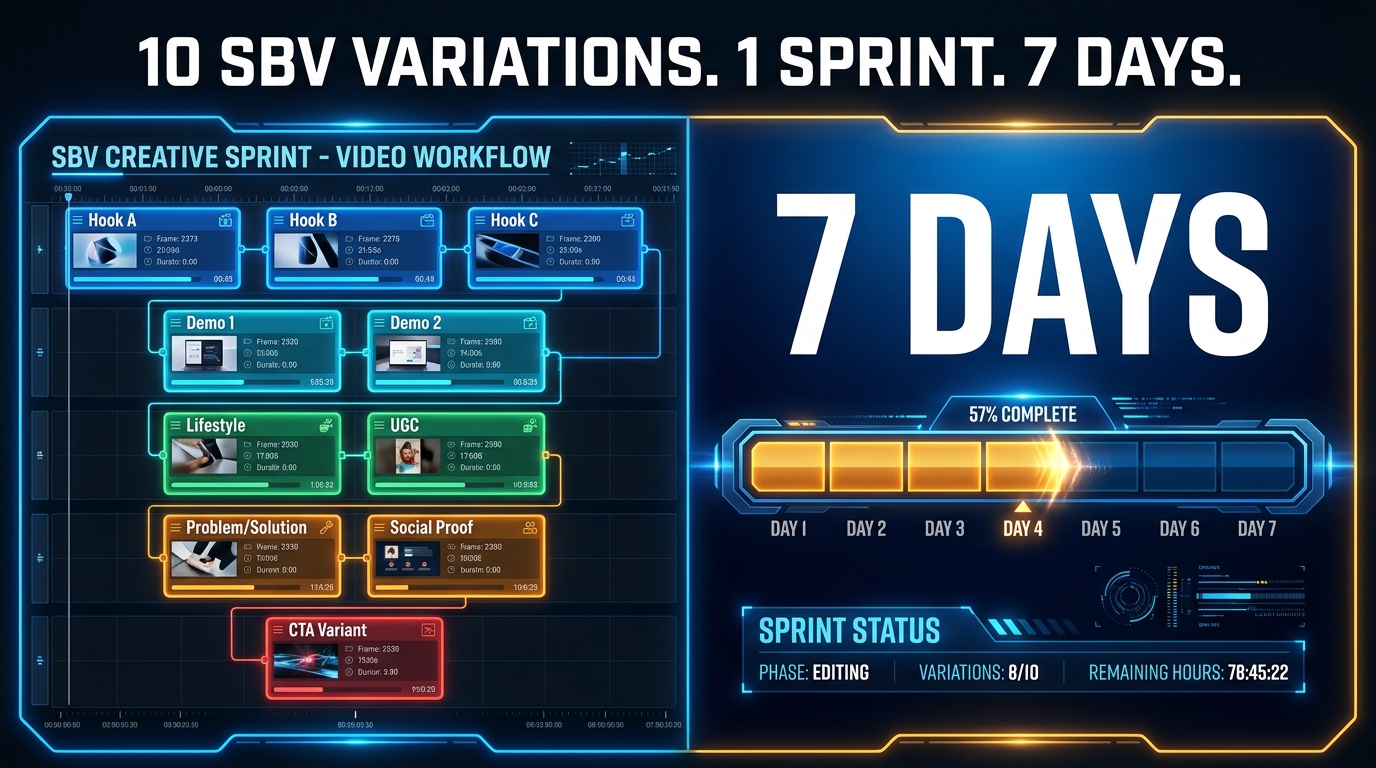
    The 7-day creative iteration sprint framework exists to fix that. It borrows structure from agile development without requiring your team to become engineers. It produces learnings, not just winners. And it gives you a repeatable operating cadence that compounds over quarters — so that by month six, your SBV creatives are measurably better than a competitor who is still uploading videos and hoping for the best.

    This article walks through every layer of the framework: why seven days is the right window, which five variables are actually worth testing, how to read Amazon’s video view metrics as a diagnostic tool, how to build and allocate budgets across variants without wasting spend, and what to do once a creative wins. There are also sections on new-to-brand measurement, creative fatigue signals, and the sprint infrastructure — documentation, naming conventions, and handoff protocols — that most accounts ignore entirely but that separate one-time wins from systematic improvement.

    Why Most SBV Creative Testing Is Structurally Broken

    Before building the framework, it is worth being specific about what goes wrong in the typical SBV creative process — because the failure modes are structural, not just behavioral. Fixing them requires changing the system, not just trying harder.

    The “Upload and Observe” Trap

    The most common pattern is passive observation. A team produces a video, uploads it to an SBV campaign, and then checks performance every week or two looking for signs that something is working or not working. The problem is that this approach is purely retrospective. By the time a pattern is obvious enough to act on, the creative has already been running for three or four weeks at a suboptimal state. Meanwhile, the competition’s hypothesis-driven teams have already run two full test cycles in the same period.

    Passive observation also conflates bad creative with bad targeting. If an SBV campaign underperforms without controlled testing, you don’t know whether the problem is the video, the keywords it’s serving against, the bid level, or the product’s price point relative to competitors. A sprint framework separates variables deliberately so that learnings are attributable.

    Testing Too Many Things at Once

    The opposite failure — and it’s surprisingly common among data-savvy teams — is changing too many elements simultaneously. A new video launches with a different hook, a different headline, a different CTA overlay, and a different background music track. Performance changes. But you have no idea which change drove it.

    Changing multiple variables at once is not testing. It’s revision. Revision occasionally produces better output. It never produces transferable knowledge. The sprint framework enforces one primary variable change per cycle precisely because insight accumulation — not just creative improvement — is the goal.

    Mistaking Aggregate ROAS for Creative Signal

    A third structural problem is using total campaign ROAS as the primary creative performance signal. ROAS is a downstream outcome that reflects many things: creative quality, yes, but also keyword relevance, bid competitiveness, listing conversion rate, price, and review velocity. Optimizing your creative based solely on ROAS is like adjusting your car’s steering by looking at the speedometer.

    The sprint framework uses a layered metric stack — viewable impressions, 5-second view rate, quartile completion rates, click-through rate, and conversion rate — to isolate where the creative is winning or losing attention before the click even happens. ROAS still matters, but it comes at the end of the analysis, not the beginning.

    The Case for a 7-Day Sprint Window

    The choice of seven days as the sprint unit is not arbitrary. It reflects a specific tension between data sufficiency and iteration velocity — and understanding that tension helps you defend the framework when pressure builds to extend tests or cut them short.

    Why Not 14 Days?

    Many SBV testing guides recommend 14-day test windows, and for some accounts, that is the right call. But for accounts with sufficient daily impressions on their target keywords — generally campaigns spending $50 or more per day per variant — seven days provides enough signal on the leading indicators (CTR, 5-second view rate, and first-quartile view rate) to make a directional decision.

    The critical distinction is that a 7-day sprint is not making a final verdict. It is making a directional decision about which variant earns the right to continue into a longer evaluation phase. Think of it as a first-round filter, not a final judgment. The 14-day window is appropriate for conversion-level decisions — CPA, CVR, and NTB data — but those decisions happen in the scaling phase, not the initial creative sprint.

    Why Not 3 Days or 5 Days?

    Shorter windows run into a fundamental problem with Amazon’s ad auction dynamics. The first 48 to 72 hours of a new SBV creative are often noisy. Amazon’s system is still learning relevance signals. Bids are competing against their own historical performance baselines. Day 1 and Day 2 data can be misleading in either direction — a creative might look strong early because of novelty effects, or it might look weak because it hasn’t yet accumulated the impression volume to stabilize CTR.

    Seven days smooths that early noise while keeping the cycle short enough to run four to five sprints per month if needed. For a team running a quarterly SBV refresh cycle, four to five sprints per month means 12 to 15 test cycles per quarter — a compounding learning velocity that is extremely difficult to match through any other means.

    The Weekend Effect

    One practical reason seven days specifically matters: it captures both weekday and weekend behavior in every single test. Shopping patterns on Amazon shift meaningfully between weekdays and weekends across most product categories — CTR, CVR, and even video completion rates can differ by 15 to 25% depending on the day. A test that runs only five business days may be seeing a systematically skewed audience. A seven-day sprint captures a complete behavioral week.

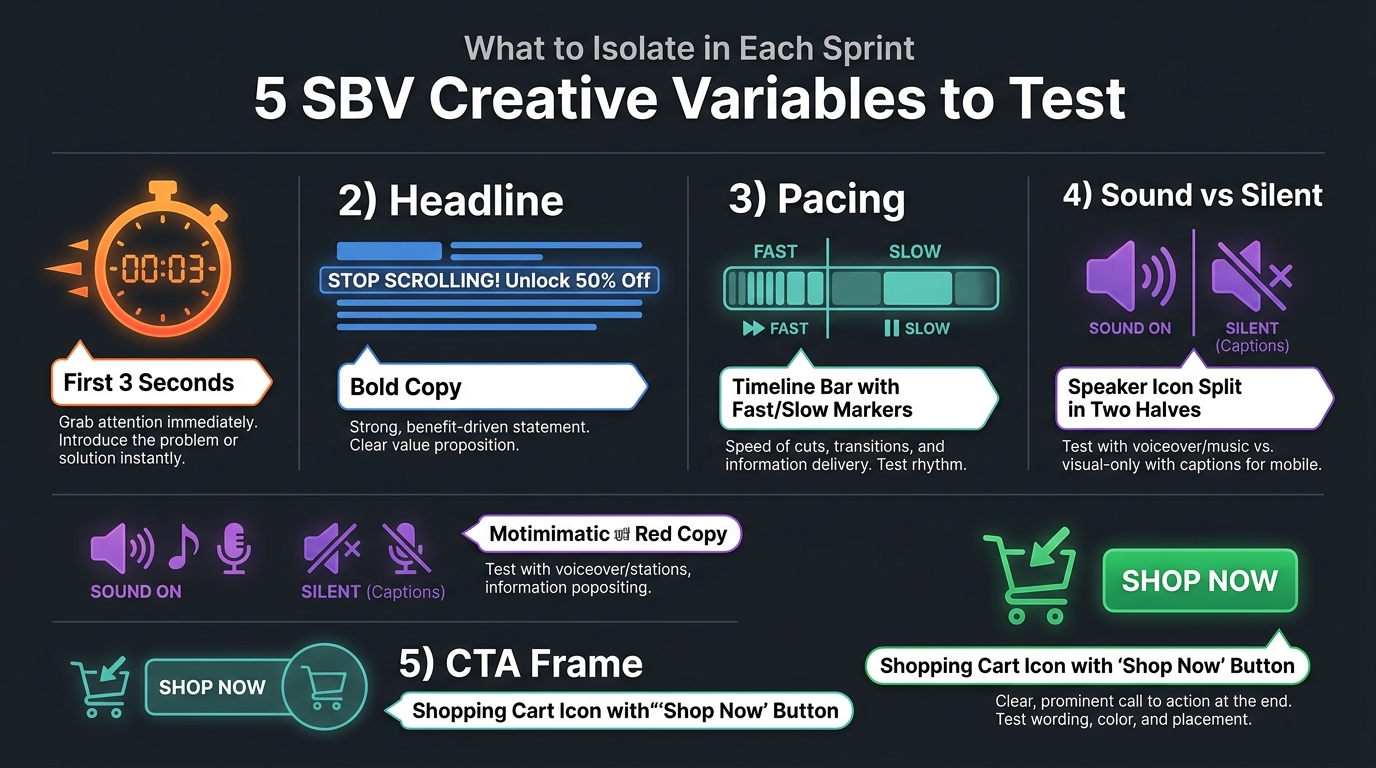
    Infographic showing the 5 SBV creative variables to isolate in each sprint: hook, headline, pacing, sound vs silent, and CTA frame

    The Five Variables Worth Testing — and Why Everything Else Can Wait

    The sprint framework narrows the testing universe to five core variables. This is not because other elements don’t matter. It’s because these five have the highest and most consistent impact on SBV performance, and they can each be tested with a single variant change in a single sprint cycle. Prioritizing them means your first ten sprints will produce more actionable insight than most accounts accumulate in a year of ad-hoc iteration.

    Variable 1: The Hook (First 3 Seconds)

    The hook is the single highest-leverage variable in any SBV creative, and it is the variable most worth testing first in every new sprint cycle. Amazon’s own engagement data consistently shows that 5-second view rate is the strongest leading indicator of downstream performance — creatives that hold attention through the first five seconds dramatically outperform those that lose viewers early, regardless of how strong the rest of the video is.

    Best practice in 2026 is to have the hero product visible within the first three seconds — not brand logos, not scenic b-roll, not a lifestyle scene that takes four seconds to resolve. The product should appear on screen with enough clarity to immediately establish relevance to the search intent that triggered the ad.

    When testing hooks, keep everything else constant: the same headline, the same middle section, the same CTA. Change only the first three to five seconds. Test a visual-led hook versus a text-led hook. Test a problem-statement open versus a solution-forward open. Test a static product reveal versus a motion-forward product reveal. Each of these is a discrete sprint. Each produces a clean signal.

    Variable 2: The Headline

    The SBV headline sits above the video unit and is often the first text element a shopper processes, especially on mobile where the video may not immediately autoplay at full screen. Headline variants can shift CTR significantly without requiring any video production work — which makes them one of the most cost-efficient variables in the testing stack.

    The most productive headline tests contrast different intent-matching approaches: a feature-led headline (“12-Hour Battery. No Compromise.”) versus a problem-solving headline (“Finally: Headphones That Don’t Die Mid-Flight”) versus a social-proof headline (“47,000 Reviews. The Reason Is Simple.”). Each framing appeals to a different stage of shopper awareness, and sprint data will tell you which frame resonates with the specific keyword cluster your SBV is targeting.

    Variable 3: Pacing and Video Length

    SBV has a maximum duration of 45 seconds, but most high-performing creatives in 2026 run between 15 and 30 seconds. Pacing — how quickly information is delivered — matters as much as total length. A 20-second video that rushes through five claims is harder to follow than a 20-second video that makes two claims with visual emphasis on each.

    Testing pacing typically means comparing a condensed version of a video against a standard version, or comparing a fast-cut product demonstration against a slower, more deliberate product showcase. The quartile drop-off data (more on that below) is your diagnostic tool for pacing problems: if you’re losing viewers between the 25% and 50% marks, the middle pacing is where to focus.

    Variable 4: Sound-On vs. Silent-First Design

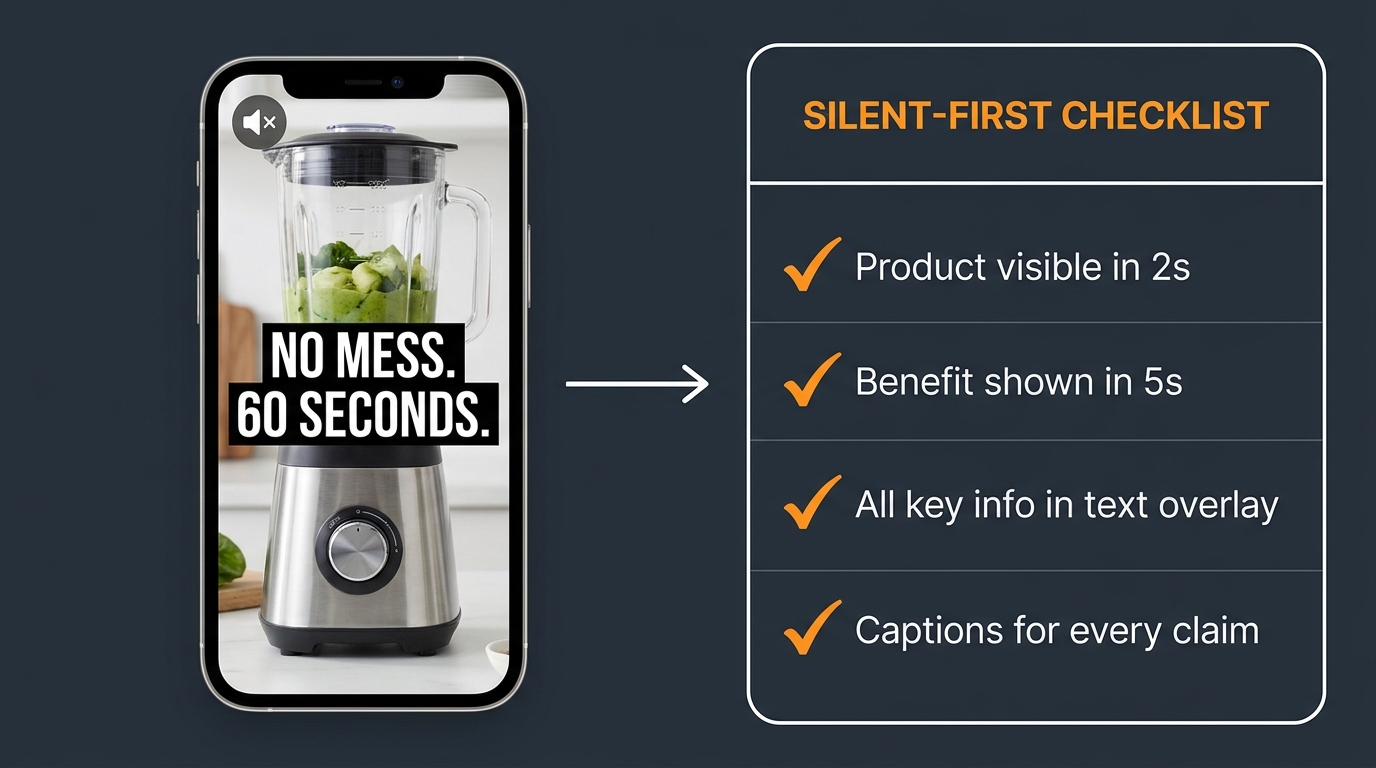
    Amazon SBV autoplays silently in the search results environment. Shoppers must actively unmute to hear audio. This creates an interesting split: creatives that are designed for silent-first viewing (full on-screen captions, motion typography, visual storytelling without relying on audio) versus creatives that reward unmuting with valuable audio content (voiceover, product sounds, brand music).

    The unmute rate — the percentage of viewers who tap to enable sound — is a direct engagement signal available in the SBV metrics dashboard. Testing a fully captioned silent-optimized video against a caption-light audio-forward video will tell you whether your specific audience is engaging deeply enough to seek audio, and that insight shapes how you invest in future productions.

    Variable 5: The CTA Frame

    The closing seconds of an SBV creative carry the call-to-action. This is where many otherwise strong videos lose the click. Testing CTA variants typically focuses on three dimensions: the visual design of the CTA frame (product-centric versus brand-centric versus offer-centric), the CTA text itself (“Shop Now” versus “See All Reviews” versus a specific price or deal prompt), and the timing of when the CTA appears in the video arc.

    One underutilized test is placing a soft CTA earlier in the video — as an on-screen text element at the 50% mark — rather than saving it exclusively for the final seconds. For high-intent search terms where shoppers are already close to a purchase decision, an early CTA can capture clicks that would have been lost if the viewer dropped off before the end of the video.

    Day-by-Day Decision Map: What to Check and When

    The sprint is not a passive observation period. Each day has a specific purpose and a specific set of data to check. This structure prevents both premature calls (pausing a creative after Day 2 based on noise) and over-patience (letting a clearly failing variant run through Day 7 out of obligation to the framework).

    Days 1–2: Do Not Touch Anything

    The first 48 hours are a calibration period. Amazon’s ad system is still establishing relevance signals for the new creative. Impression volume is often lower than it will be by Day 4 or 5. CTR during this window can be misleading in either direction. The only legitimate action during Days 1 and 2 is confirming that both variants are actually serving — checking that impressions are accruing, that there are no disapproval flags, and that the budget split is functioning as intended.

    If one variant shows zero impressions after 48 hours, that is a flag worth investigating: possible disapproval, bid issue, or a campaign setup error. Otherwise, do not make data-driven decisions based on two days of data.

    Days 3–4: First Signal Read

    By Day 3, you should have enough impression volume to do a first-pass comparison on 5-second view rate and CTR. These are leading indicators only — you are not making a final call — but they tell you whether one variant is materially underperforming. If Variant A is showing a 5-second view rate of 35% and Variant B is showing 12%, that is a meaningful signal worth noting. You are not pausing Variant B yet, but you are logging the divergence.

    Day 4 is a good moment to check the quartile data for early pattern recognition. Where are viewers dropping off? Is the first quartile showing a sharp cliff? If so, the hook is likely the problem, regardless of which variant is live. This observation feeds directly into the planning for the next sprint cycle, even before the current one closes.

    Days 5–6: Confidence Builds

    By Day 5, the CTR and view rate data is substantive enough to form a working hypothesis about the outcome. You should also be seeing early conversion data — not enough for statistical significance, but enough to check directional alignment. A creative that shows strong CTR but very weak CVR has a click-promise problem: it is getting the tap but not delivering on the implicit promise made in the ad.

    Day 6 is a documentation day. Fill out the sprint log with the current state of all key metrics. Prepare the post-sprint brief, which states what you believe the data will show on Day 7 and what the next sprint hypothesis will be based on that. Writing this prediction before seeing the final data sharpens your ability to read results honestly rather than post-rationalizing whatever the numbers show.

    Day 7: Sprint Close and Decision

    On Day 7, pull a full metrics export for both variants covering the entire seven-day window. Compare on the full stack: viewable impressions, 5-second view rate, video quartile completion rates, unmute rate, CTR, CVR, CPA, and — if available — NTB orders attributed to each variant.

    The decision protocol is simple: the winning variant is the one that performs better on the primary sprint KPI (which was set before the sprint launched, not after). If the sprint was a hook test, the primary KPI is 5-second view rate. If it was a CTA test, the primary KPI is CTR. Secondary metrics provide context, not override authority. Document everything, archive both variants’ raw data, and plan the next sprint within 24 hours of close.

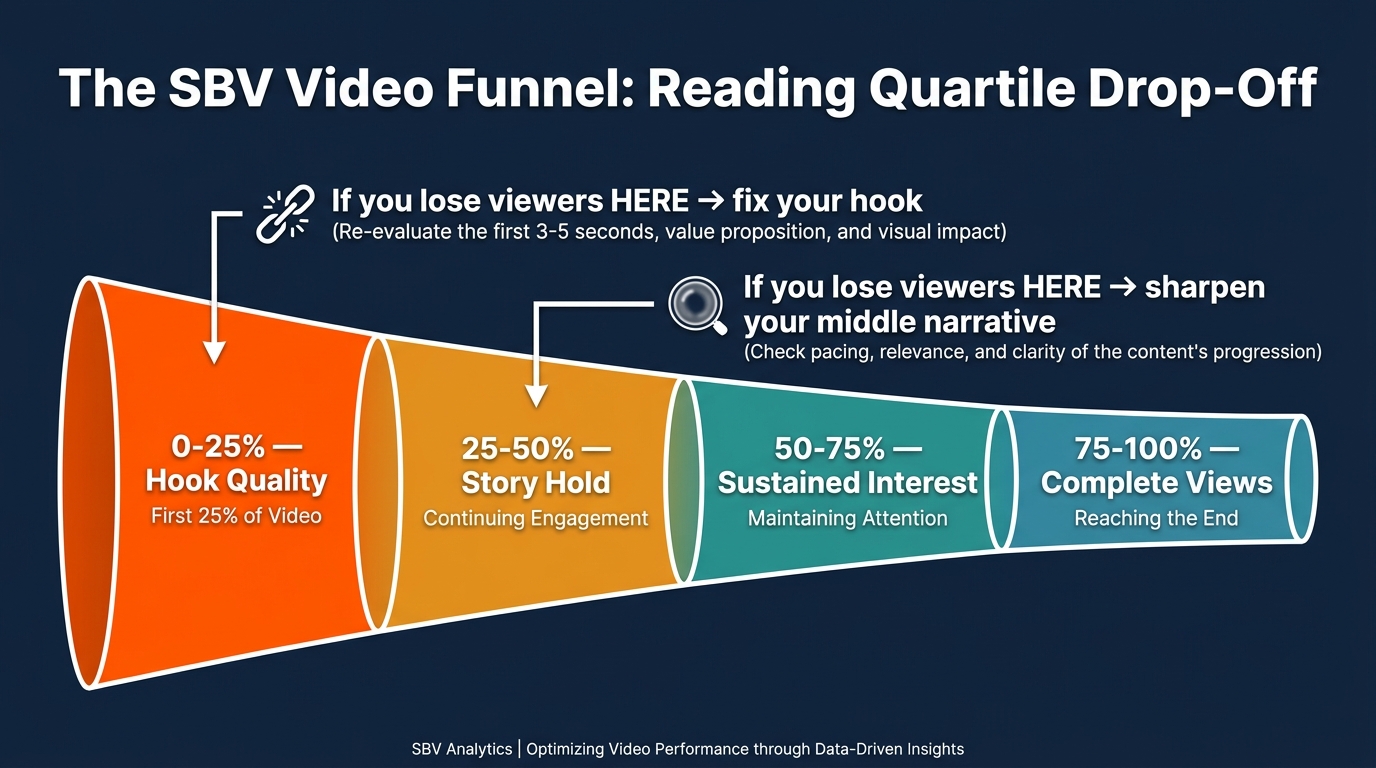
    SBV video funnel quartile drop-off diagnostic showing where to fix hook quality, story hold, and sustained interest

    Reading the Quartile Funnel: Using Amazon’s Video View Metrics as a Diagnostic Tool

    Amazon’s Sponsored Brands Video ad reporting now includes a suite of engagement metrics that most advertisers have not fully integrated into their workflow. These metrics are not supplementary data points — they are a structured diagnostic system that maps directly onto specific creative decisions. Using them correctly is the difference between knowing a creative underperformed and knowing why it underperformed.

    The Key Metrics and What They Measure

    Viewable impressions: The ad met Amazon’s viewability standard (at least 50% of the ad was on screen for at least two seconds). This is your denominator — the base from which all engagement rates are calculated.

    5-second views and 5-second view rate: The percentage of viewable impressions where the viewer watched at least five seconds. This is the most actionable hook metric in the entire stack. A 5-second view rate above 30% is generally considered strong; below 20% is a hook problem that should trigger an immediate sprint focused on the first three to five seconds.

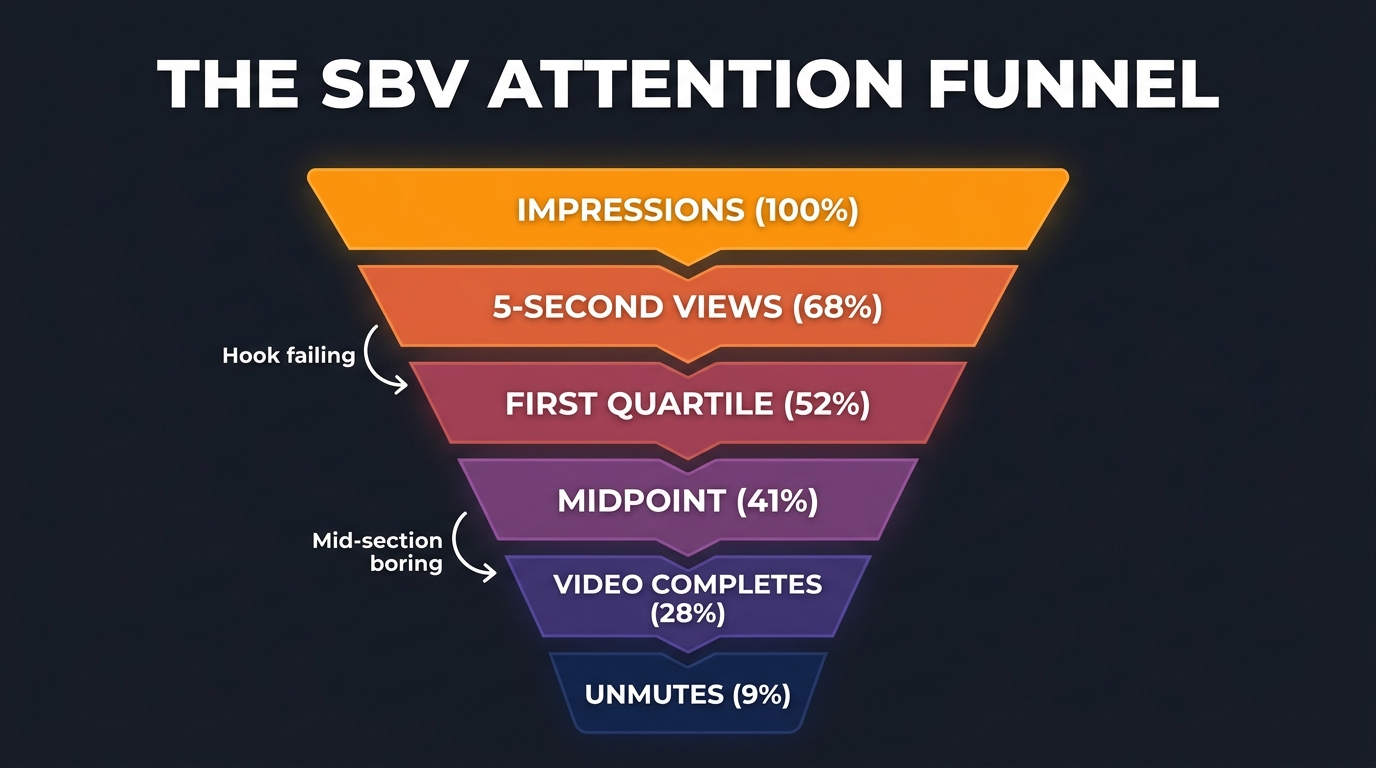
    First quartile (25% viewed): The percentage of viewable impressions where viewers watched through the first quarter of the video. A large drop from 5-second view rate to first quartile completion indicates the video starts strong but loses momentum in seconds 5 through approximately 10. This points to a pacing or relevance problem in the early middle section.

    Midpoint (50% viewed) and third quartile (75% viewed): These two metrics together map the middle of the video’s retention curve. Healthy SBV creatives see gradual decay across these points — viewers naturally drop off over time, and that’s expected. What’s concerning is a steep cliff between midpoint and third quartile, which indicates the middle third of the video is losing audience rapidly. This usually means the narrative has stalled, the product demonstration is unclear, or the pacing has slowed at a point where attention has already thinned.

    Video completion rate (VTR) and complete views: The percentage of viewable impressions that watched all the way through. This metric is more relevant for brand awareness goals than for direct response, but a very low VTR relative to first-quartile views suggests the video’s closing section is failing to retain viewers who were interested enough to watch the first half.

    Unmute rate: The percentage of viewers who actively turned on sound. In a silent autoplay environment, an unmute rate above 10% is notable and suggests the video is compelling enough to earn an active engagement behavior. This is particularly useful for evaluating audio-forward versus silent-first creative variants.

    Using Quartile Data to Set the Next Sprint Hypothesis

    The diagnostic power of quartile data comes from using it as a map rather than a scorecard. Each segment of the video corresponds to a specific creative decision, and each drop-off point tells you where that decision is failing. If your 5-second view rate is strong (above 30%) but your first-quartile view rate is low (below 50% of the 5-second views), the problem is in the immediate post-hook section — the first five to ten seconds after the attention grab. This is where you typically transition from hook to product value communication, and if viewers are leaving here, the transition is too slow or too vague.

    If your midpoint numbers are strong but third-quartile views fall sharply, the problem is in the later middle section. This might mean the product demonstration is too long, or there is a visual repetition that signals “this video is done giving me new information” before the actual ending.

    The framework rule is: the sprint that follows the current one should target the variable that corresponds to the earliest significant drop-off point in the quartile funnel. Fix the problem closest to the top first. A video that can’t hold viewers past five seconds has nothing to gain from CTA frame testing.

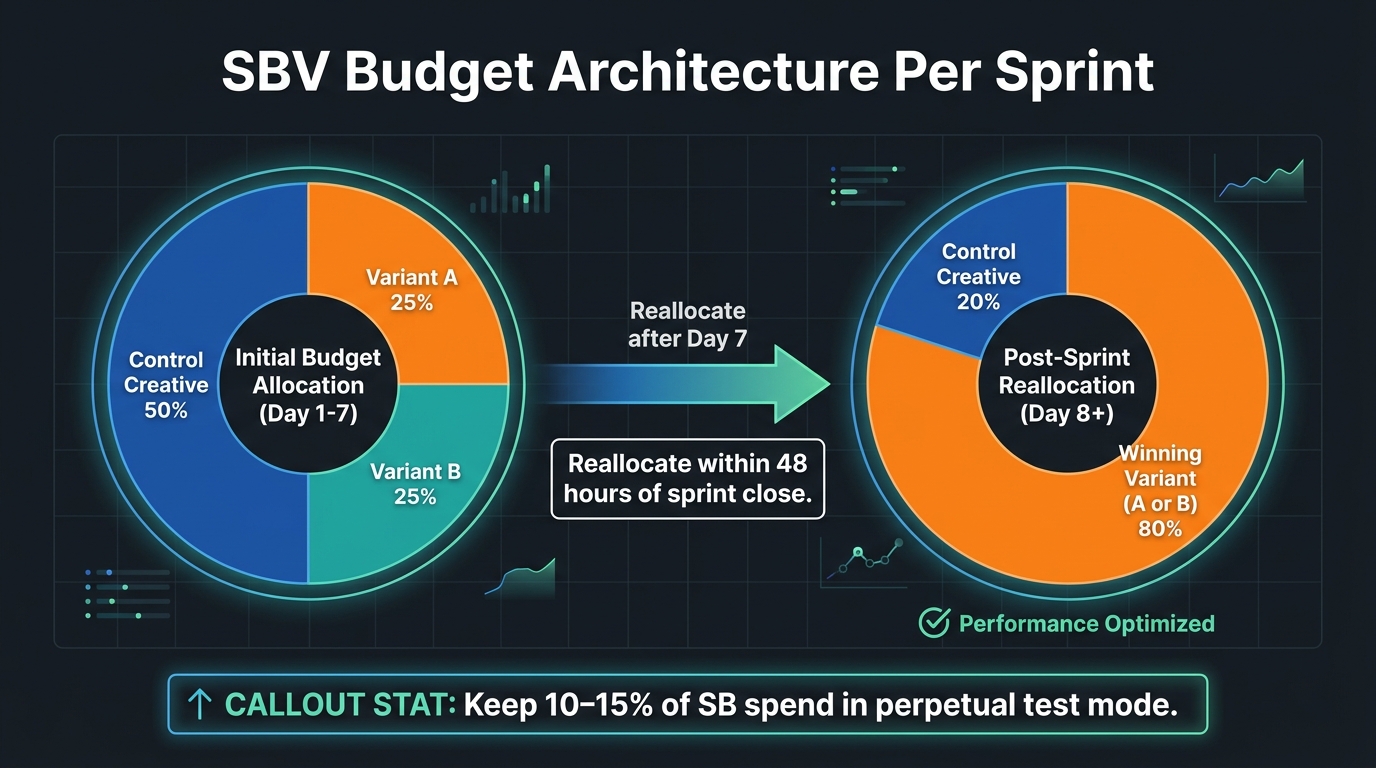
    SBV budget architecture per sprint showing 50% control creative and 25% each for variant A and B, with post-sprint budget reallocation to winner

    Budget Architecture: How to Split Spend Without Wasting Money

    Budget allocation across sprint variants is where many well-intentioned SBV testing programs fall apart. Either the test variants get so little budget that they never accumulate sufficient impression volume to produce reliable signal, or budget splits are so even that the winning variant doesn’t get an opportunity to demonstrate its performance advantage during the sprint window itself.

    The 50/25/25 Split for Three-Variant Sprints

    The standard allocation for a sprint testing one control creative against two variants is a 50/25/25 split: 50% of the SBV budget in that campaign goes to the current control (the existing best-performing creative), and 25% goes to each new variant. This structure does three important things simultaneously.

    First, it protects performance. The control continues to carry the majority of spend during the test period, which means campaign-level metrics don’t crater while you’re testing. Second, it gives each variant enough budget to generate meaningful impression volume within a seven-day window — assuming the overall campaign is spending at a sufficient daily rate. Third, it creates a clear comparison environment where neither variant is systematically advantaged by a larger impression base.

    The practical minimum for this framework to work is approximately $50 per day per variant. At that spend level, a seven-day sprint will generate between 700 and 1,200 impressions per variant on most moderately competitive keywords — enough to produce stable CTR and 5-second view rate readings. Below $35 per day per variant, the data is too thin to trust, and you should either consolidate to a two-variant test (control versus one variant) or extend the window to 10 to 14 days.

    Post-Sprint Budget Reallocation

    Within 48 hours of sprint close, reallocate budget to the winning variant. This should happen in the campaign settings directly — the winning variant’s campaign or ad group receives the full budget that was previously split, and the losing variant’s campaign is paused.

    The reallocation should be aggressive. There is no value in leaving a losing variant running “just in case.” If you have done the sprint correctly — controlled variables, seven full days of data, clear primary KPI — the decision is made. Leaving budget on a losing variant is not caution. It is wasted spend that could be compounding on the winner.

    One important caveat: “losing” in a sprint context means performing worse on the primary KPI, not underperforming on every metric. It is entirely possible for a variant to lose on 5-second view rate (hook test) but show interesting conversion data worth investigating. That conversion signal doesn’t save the variant from being paused — but it does generate a hypothesis for a future sprint focused on a different primary KPI.

    Maintaining a Permanent Testing Budget Reserve

    The sprint framework works best as an always-on practice, not a periodic event. Most advanced SBV accounts in 2026 are keeping 10 to 15% of their total Sponsored Brands budget in a permanent testing allocation — a ring-fenced pool that funds new sprint variants regardless of what the control creative is doing. This ensures the testing cadence is not dependent on performance pressure permitting it.

    When performance is strong, the testing budget generates additional learnings on top of strong results. When performance dips, the testing budget is already funded and can accelerate the search for a better creative. Either way, the testing engine stays running.

    The Hypothesis-First Mindset: Building Tests That Produce Learnings

    The most important discipline in the sprint framework is writing the hypothesis before building the creative, not after. This sounds like a small procedural detail but it fundamentally changes what the sprint produces. A hypothesis written after a sprint has concluded is a rationalization. A hypothesis written before determines what the sprint is designed to learn.

    What a Good SBV Sprint Hypothesis Looks Like

    A well-formed sprint hypothesis has four components: the change being made, the expected direction of movement, the primary metric that will measure that movement, and the reason the team believes the change will produce that outcome. Here is what that looks like in practice:

    Sprint 4 Hypothesis: Replacing the lifestyle-open hook (seconds 0–4) with a direct product-reveal hook — showing the product in use within the first two seconds against a plain background — will increase 5-second view rate by at least 8 percentage points. The rationale is that our target keyword cluster reflects high purchase intent where shoppers are evaluating specific products, not being introduced to a brand story. A product-forward hook aligns more directly with that intent than a lifestyle frame.

    Notice what this hypothesis does: it specifies the change (visual hook type), the direction (increase in 5-second view rate), the magnitude expectation (8 percentage points), and the strategic rationale (intent-matching for the keyword cluster). When Day 7 arrives and you see whether the data confirmed or contradicted this hypothesis, you have a real learning — not just a number, but an insight about how your specific audience responds to different creative approaches.

    What to Do When the Hypothesis Is Wrong

    When a sprint does not confirm the hypothesis, many teams experience this as a failure. The sprint framework treats it as a high-value result. A hypothesis that doesn’t hold tells you something specifically wrong about an assumption you held — and those corrections compound over time into a much more accurate mental model of your shopper’s behavior.

    The post-sprint brief for a failed hypothesis should answer three questions: What did the data show instead of what we expected? What assumption in our hypothesis was wrong? What does this tell us about the next sprint design? A team that answers these questions rigorously after every sprint — win or lose — will outperform a team that only celebrates confirmations.

    When a Creative Wins: Scaling Protocol and Production Handoff

    The sprint produces a winner. Now what? This transition — from sprint result to scaled production asset — is where many accounts drop the ball. The winning creative is often promoted to full budget and then left to run indefinitely, which creates a false sense of resolution. The sprint framework treats the winning creative as a validated hypothesis, not an endpoint.

    The Graduated Scaling Approach

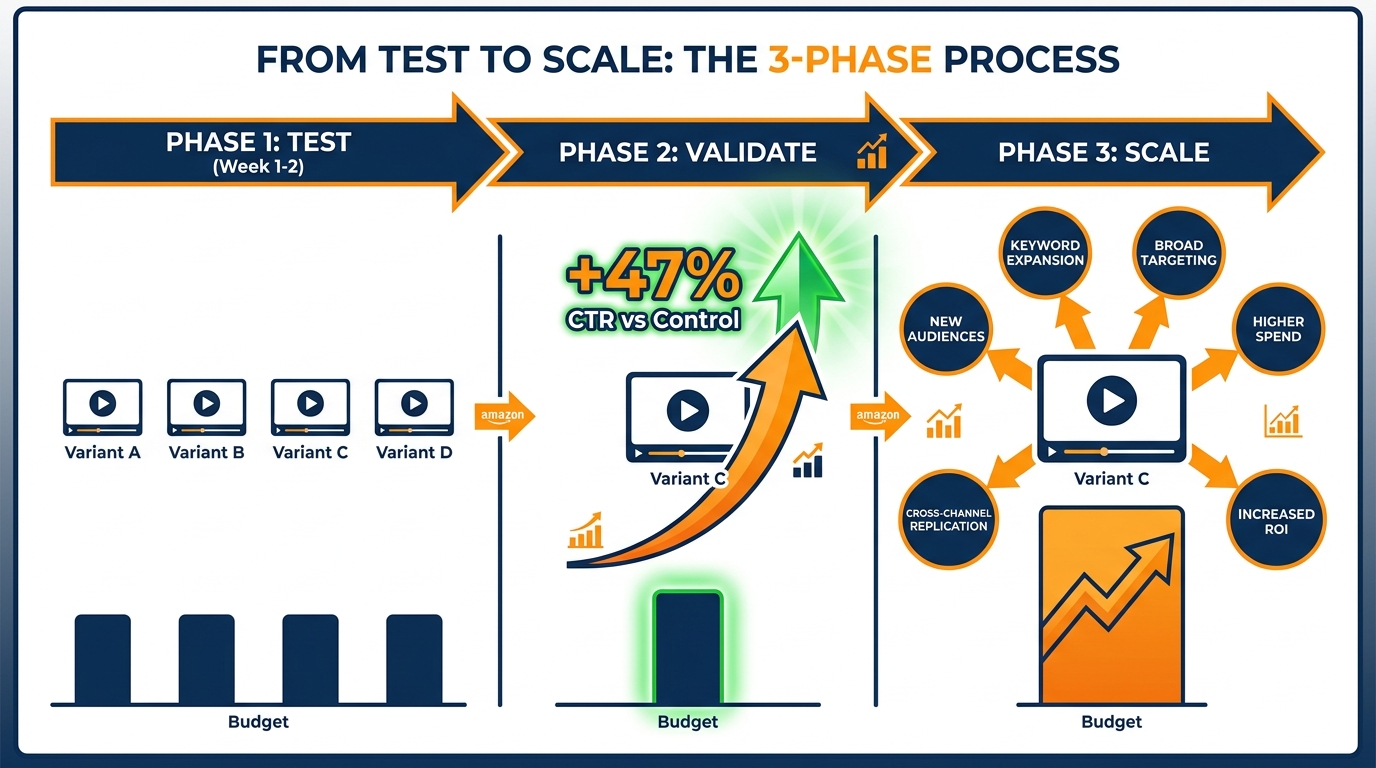
    After a sprint produces a clear winner, the scaling protocol is graduated rather than immediate. The winning variant moves from 25% of campaign budget to 60% in the week following sprint close. This is the validation phase: you are watching whether the performance advantage observed during the sprint holds as impression volume increases. Occasionally a creative performs well at low volume due to novelty targeting — early shoppers who happen to be a great fit — but shows degraded metrics as the audience broadens. The validation phase catches this.

    If performance holds through the validation week (metrics within 15% of sprint averages at higher volume), the creative moves to full budget as the new control. It is then documented in the creative library with its sprint data, variant history, and the hypothesis that generated it. This documentation is the institutional knowledge that makes each subsequent sprint cycle more precise than the one before it.

    The Control Refresh Window

    A winning creative becomes the new control and should be treated as such: protected, monitored, and managed against specific performance thresholds. The framework establishes a “refresh trigger” metric — typically a 15 to 20% decline in the creative’s CTR relative to its sprint-period benchmark — that automatically flags the creative for replacement. When that trigger fires, the next sprint cycle begins immediately, using the current control as the baseline and competing it against fresh variants.

    Critically, do not wait for performance to collapse before running the next sprint. The goal is to have a tested replacement creative ready to deploy at or slightly before the point where the current control begins to fade. This requires running a sprint against the current control while it is still performing well — which feels counterintuitive but prevents the gap between creative fatigue and replacement that costs performance for weeks.

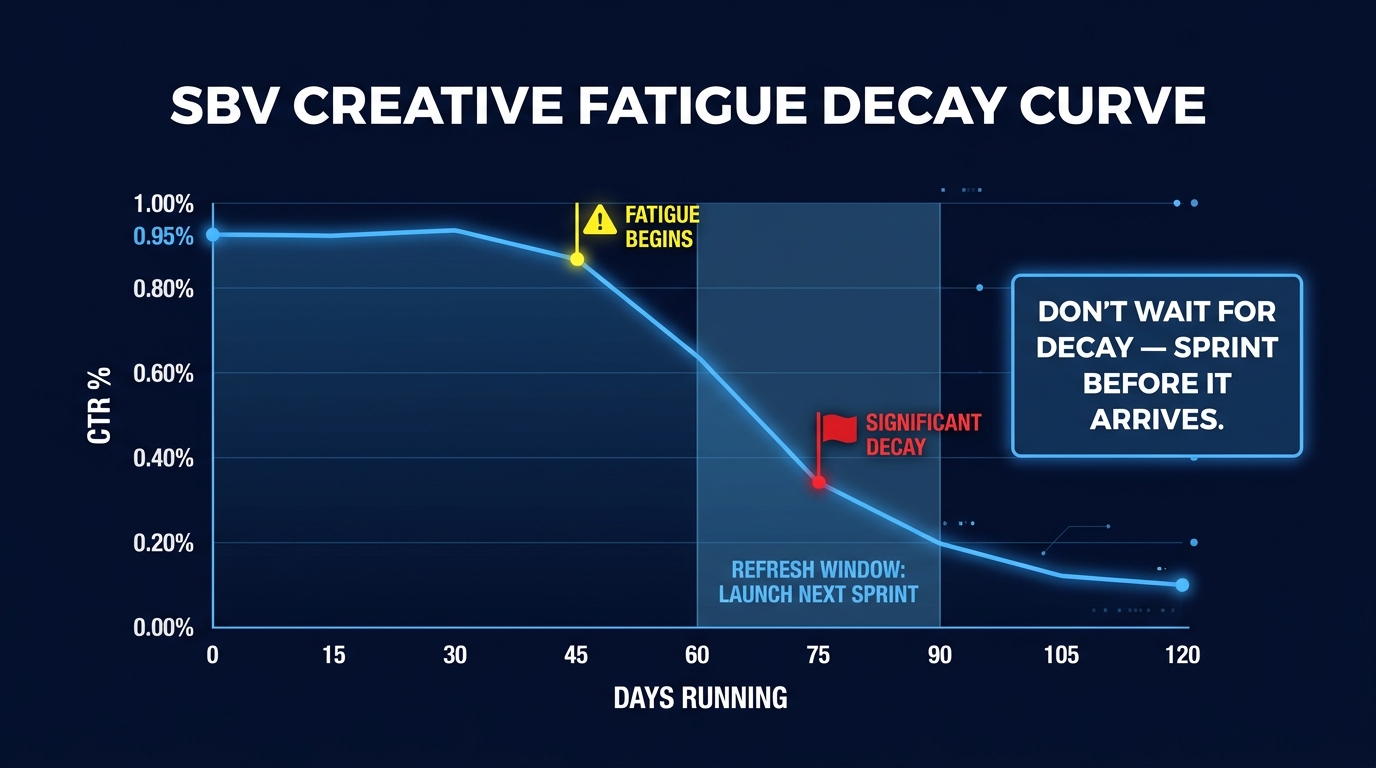
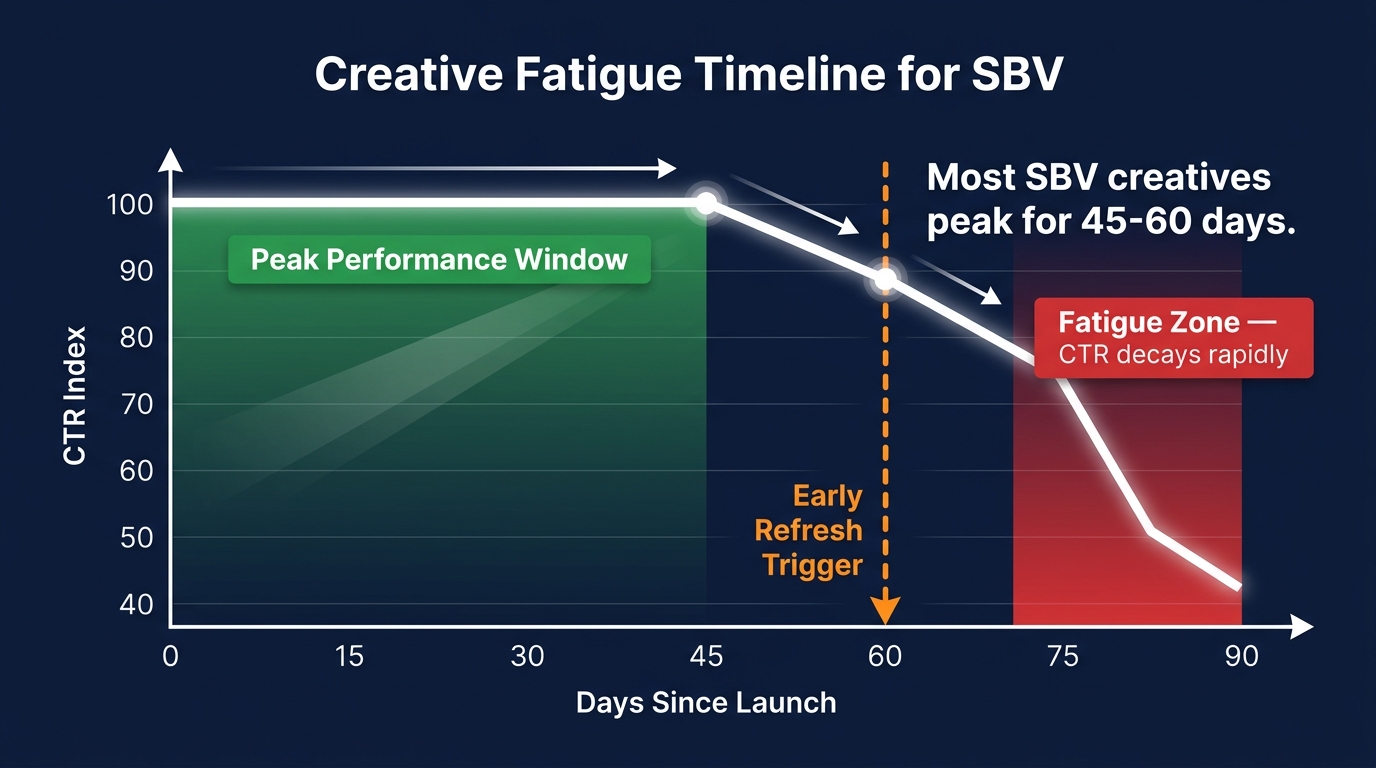
    Creative fatigue timeline for SBV showing CTR decline curve, peak performance window from days 0-45, and fatigue zone from days 75-90

    Creative Fatigue: Signals, Timelines, and Sprint Refresh Triggers

    Creative fatigue in SBV follows a predictable pattern that most sellers intuitively understand but rarely track with enough precision to act on proactively. The general pattern — strong early performance, gradual plateau, eventual decline — is consistent across most categories and creative types. What varies is the timing.

    The 45-to-60-Day Peak Performance Window

    Agency portfolio data from Q1 and Q2 2026 consistently places the peak performance window for SBV hero creatives at 45 to 60 days post-launch. During this window, CTR and 5-second view rate remain close to their sprint-period benchmarks. After Day 60, most creatives begin showing signs of audience saturation — the same shoppers are seeing the same video repeatedly, and the novelty effect has fully dissipated.

    The CTR decline curve is not linear. Most creatives show relatively stable performance through Day 50 or so, followed by a steeper decline in the final stretch before the 90-day mark. By Day 90, many SBV creatives are running at 60 to 70% of their original CTR — a material degradation that, because it happens gradually, often goes unnoticed until it is deeply embedded in the account’s performance trend.

    Setting Automatic Fatigue Alerts

    The sprint framework operationalizes fatigue monitoring by building specific alert thresholds into whatever reporting tool or dashboard the team uses. The recommended trigger points are:

    • Yellow alert (plan a refresh sprint): CTR drops more than 15% from the creative’s Day 7 to 30 average.
    • Orange alert (launch a refresh sprint immediately): CTR drops more than 25% from the Day 7 to 30 average, or the 5-second view rate drops below the sprint-period benchmark by more than 20%.
    • Red alert (deploy backup creative now): ACoS has risen more than 30% alongside CTR decline, indicating the fatigue is now impacting conversion economics, not just awareness metrics.

    Having these thresholds defined in advance removes the subjective judgment call — “is it time to refresh the creative?” — and replaces it with a clear, triggering condition that requires a specific action. Teams that define these thresholds upfront consistently cycle through creatives more efficiently than those that make the decision ad hoc.

    Building the Creative Pipeline

    Managing fatigue well requires having a creative pipeline that runs two to three sprints ahead of the current control. This means you always have at least one tested variant ready to promote to control, and one more sprint in progress generating the next candidate. The pipeline metaphor is deliberate: creatives should be flowing through the system continuously, not produced in isolated batches when someone notices performance has dropped.

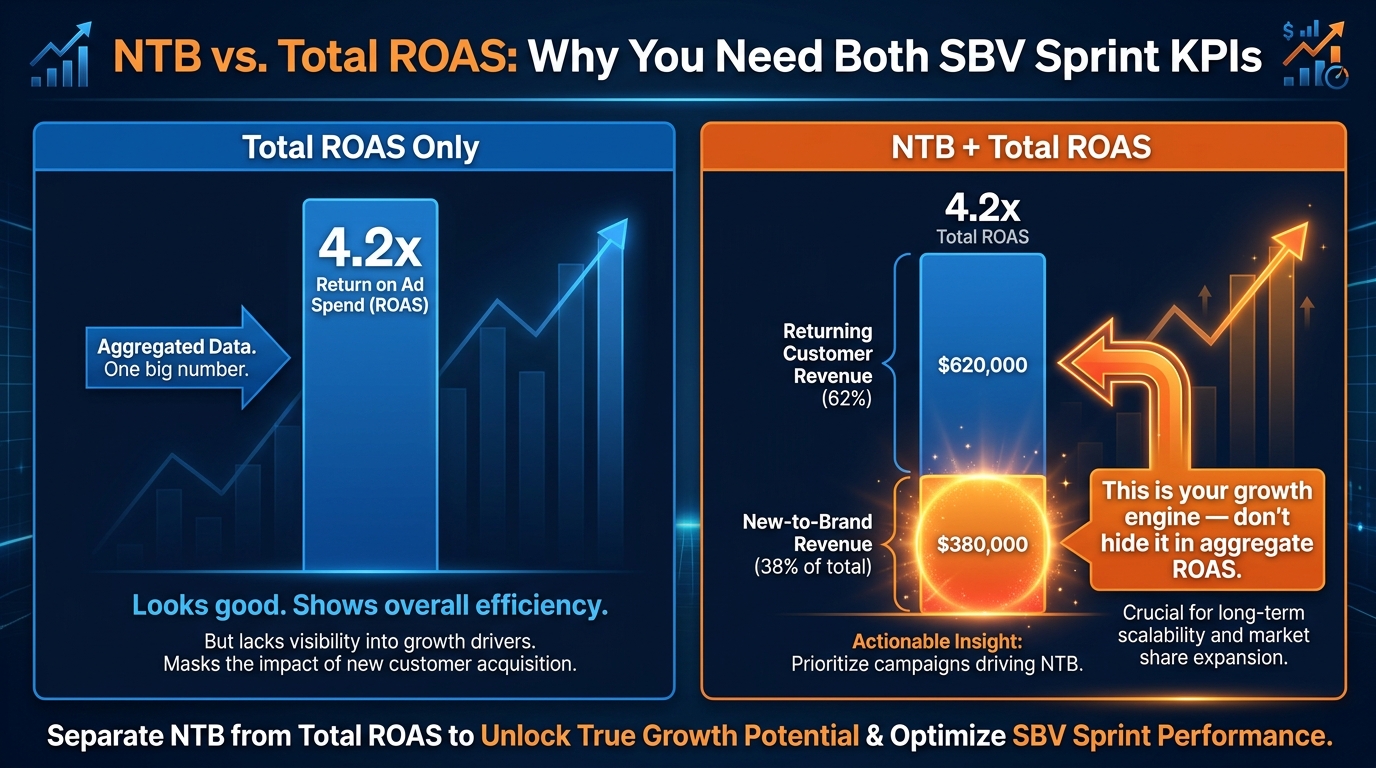
    NTB vs. total ROAS comparison showing why new-to-brand revenue is the real SBV growth engine and should not be hidden in aggregate ROAS

    NTB as a Sprint KPI: Measuring What SBV Actually Does for Your Brand

    Of all the underused metrics in the SBV testing stack, new-to-brand (NTB) data is the one with the most strategic weight. And it is systematically underused because it requires looking past the aggregate ROAS number that most reporting dashboards surface first.

    Why SBV Has an Outsized NTB Effect

    Sponsored Brands Video operates in the search results environment — specifically, it appears as a prominent video unit at the top or bottom of search results pages. This means shoppers see it while actively searching for product categories, not while browsing editorial content or social feeds. The search context gives SBV a structural advantage for new-to-brand acquisition: the shopper is already in a buying mindset and is being introduced to your brand as a relevant solution at the exact moment of category intent.

    This is why Sponsored Brands formats consistently show higher NTB rates than Sponsored Products: SB/SBV is appearing in front of shoppers who may not have known your brand existed. Sponsored Products tends to appear to shoppers who searched for your specific ASIN or product keywords where you are already competing — a population that includes more existing customers and brand-aware shoppers.

    In practical terms, SBV campaigns in optimized accounts are often generating 35 to 50% of their attributed orders as new-to-brand — meaning more than a third of every sale touched by SBV is coming from a customer who was previously unknown to your brand. That is an acquisition metric, not just a ROAS metric. And it has long-term value that aggregate ROAS does not capture.

    Integrating NTB into Sprint Evaluation

    NTB data should appear in the Day 7 sprint read for every cycle, but with an important caveat: NTB typically needs more than seven days to produce stable, reliable numbers. The seven-day window is sufficient to see directional signals in NTB orders, but for accounts where NTB percentage is a primary strategic objective, extending the evaluation window to 14 days specifically for NTB data — while still making the directional creative decision at Day 7 — is the right approach.

    When two creative variants are comparable on CTR and CVR but diverge meaningfully on NTB rate, the NTB advantage should be the tiebreaker. The variant that is pulling a higher share of first-time buyers is doing more for long-term brand equity, even if its immediate ROAS is identical. Customer lifetime value modeling — even rough estimates — makes this argument quantitative rather than strategic-feeling.

    An NTB-Specific Sprint Hypothesis Example

    Here is an example of an NTB-specific sprint hypothesis:

    Sprint 7 Hypothesis: A hook that opens with a category-problem frame (“Still paying $15 per month for protein that doesn’t mix?”) rather than a brand-forward frame will increase NTB order rate by at least 5 percentage points. Rationale: category-problem hooks address shoppers who are not yet committed to any specific brand, which is the precise audience that drives NTB orders.

    This type of hypothesis treats SBV not as a pure performance channel but as a brand acquisition engine — which, when the NTB data is incorporated, is exactly what it is.

    Sprint Infrastructure: Documentation, Naming, and Institutional Knowledge

    The framework described in this article produces value over time in proportion to how well the learnings from each sprint are captured and accessible to the team running future sprints. Without documentation infrastructure, you are running an excellent test program that generates insights that evaporate within weeks. With it, you are building a compounding knowledge asset that gets more precise with every cycle.

    Campaign and Creative Naming Conventions

    Every SBV campaign and creative asset should be named in a way that encodes the sprint it came from, the variable being tested, and the variant identifier. A practical naming structure looks like this:

    [ASIN or Product Code] — SBV — Sprint [Number] — [Variable] — [Variant A/B/Control]

    Example: B091GFX912 — SBV — Sprint04 — Hook — VariantA

    This naming convention means that six months from now, when someone is reviewing the campaign history, they can immediately identify which creative came from which sprint, which variable was being tested, and where in the variant sequence it sits. Without this, campaign histories become unreadable archives of video titles like “Product Video Final v3 NEW.”

    The Sprint Log Template

    Each sprint should generate a single document — a sprint log — that captures the following fields before, during, and after the test:

    • Pre-sprint: Sprint number, target ASIN/product, keyword cluster being tested against, variable under test, control creative identifier, variant descriptions, primary KPI, secondary KPIs, hypothesis statement, budget split, and planned start/end dates.
    • Mid-sprint (Day 4 update): Interim metrics snapshot, early signal observations, any anomalies noted (bid changes, keyword auction shifts, inventory issues that might contaminate the test).
    • Post-sprint: Final metrics for all variants on the full metric stack, verdict (confirmed/contradicted hypothesis), insights generated, next sprint hypothesis informed by these results, winner creative ID, and reallocation date.

    This template does not need to be complex. A shared spreadsheet or a simple project management card works. What matters is that it exists, is consistently completed, and is accessible to everyone who works on the account.

    The Creative Library

    The creative library is the long-term institutional output of the sprint program. It is a catalog of every SBV creative that has been tested, with links to the raw video files, the sprint log that generated them, their peak performance metrics, their fatigue trigger date, and the hypothesis they were built to test.

    Over time, this library reveals patterns that are invisible sprint-by-sprint: which hooks consistently outperform across products, which CTA frames have the strongest CTR by product category, which pacing structures hold attention longest for your specific shopper. These patterns cannot be identified from a single sprint but emerge clearly after 15 to 20 cycles of disciplined documentation. Accounts with two years of documented sprint history have an analytical foundation for creative decisions that competitors without documentation cannot replicate, regardless of budget or production resources.

    Putting It All Together: Running Your First Sprint Cycle

    For teams new to the sprint framework, the priority is getting one cycle completed end-to-end before optimizing the process. Perfection in sprint design is less important in the first cycle than developing the habit of the full workflow: hypothesis first, controlled variables, daily check-ins at the right cadence, Day 7 close, documentation, next hypothesis within 24 hours.

    Sprint Zero: The Baseline Audit

    Before launching the first sprint, spend three to five days pulling historical SBV data for your current creatives. Specifically: what are the current 5-second view rates, quartile completion rates, CTR, and CVR for each active SBV creative? This baseline data tells you where the biggest opportunity gaps are — and therefore which variable your first sprint should target.

    If your 5-second view rate is 14% (well below the 30% benchmark), start with a hook sprint. If your CTR is strong but CVR is low relative to your organic listing conversion rate, start with a CTA sprint or examine whether the ad is attracting misaligned intent. The baseline audit ensures that Sprint 1 is not chosen arbitrarily but is targeted at the highest-leverage problem in the current creative stack.

    Structuring the First Sprint

    For Sprint 1, use the simplest possible structure: one control creative, one variant, a 50/50 budget split (or 60/40 if you need to protect performance), and a single clearly defined variable change. The hypothesis should be written before any video production begins. The sprint dates should be set in advance and not moved.

    When the sprint closes, run the full post-sprint analysis regardless of how clear or unclear the result looks. Even an inconclusive sprint — one where neither variant clearly outperformed — generates a hypothesis for Sprint 2: either the variable you tested doesn’t materially affect the KPI (in which case, move to a different variable), or the budget was insufficient for reliable signal (in which case, increase spend or extend the window).

    By Sprint 3, the process should feel habitual. By Sprint 6, the creative library will contain enough cross-sprint patterns to start making smarter hypotheses faster. By Sprint 10, the framework is generating compounding returns that cannot be replicated by any amount of one-off creative experimentation.

    Conclusion: The Compounding Advantage of Systematic SBV Testing

    The 7-day creative iteration sprint framework for Sponsored Brands Video is not complicated, but it requires consistency to produce its full value. The individual sprint is just a seven-day test. The sprint program — the compounding sequence of hypotheses, learnings, documentation, and refinement — is a strategic asset that compounds in value every cycle.

    Most sellers running SBV in 2026 are not doing this. They are uploading videos, checking aggregate ROAS, occasionally refreshing creatives when things obviously fade, and missing the enormous volume of available insight that Amazon’s own video metrics are offering. The gap between structured sprint programs and ad-hoc creative management is widening as SBV becomes an increasingly competitive and expensive format.

    Actionable Takeaways

    • Start with a baseline audit. Pull current 5-second view rate, quartile completion, CTR, and CVR for every active SBV creative before designing Sprint 1. Let the data tell you where the first hypothesis should focus.
    • Write the hypothesis before touching the creative. Specify the change, the expected direction, the primary KPI, and the rationale. This discipline is what makes sprint results produce learnings rather than just outcomes.
    • Use the 50/25/25 budget split for three-variant sprints, and maintain a permanent 10 to 15% testing reserve in your SB budget structure.
    • Read quartile data as a diagnostic map. The earliest point of significant drop-off tells you which creative element needs attention in the next sprint.
    • Add NTB to every sprint scorecard. Aggregate ROAS hides SBV’s most strategically valuable output — the percentage of orders coming from customers who are new to your brand.
    • Set fatigue alert thresholds before you need them. Define the CTR decline percentages that trigger a refresh sprint and automate or calendar these checks so they happen proactively, not reactively.
    • Document every sprint in a standard log. The creative library built over 10+ sprint cycles is an institutional knowledge asset that compounds and cannot be replicated quickly by competitors starting from scratch.

    The accounts that will dominate SBV performance through the remainder of 2026 and into 2027 are not the ones with the biggest production budgets or the most creative talent. They are the ones running systematic, hypothesis-driven sprint programs — building a clearer picture of their shopper’s attention patterns, one seven-day cycle at a time.