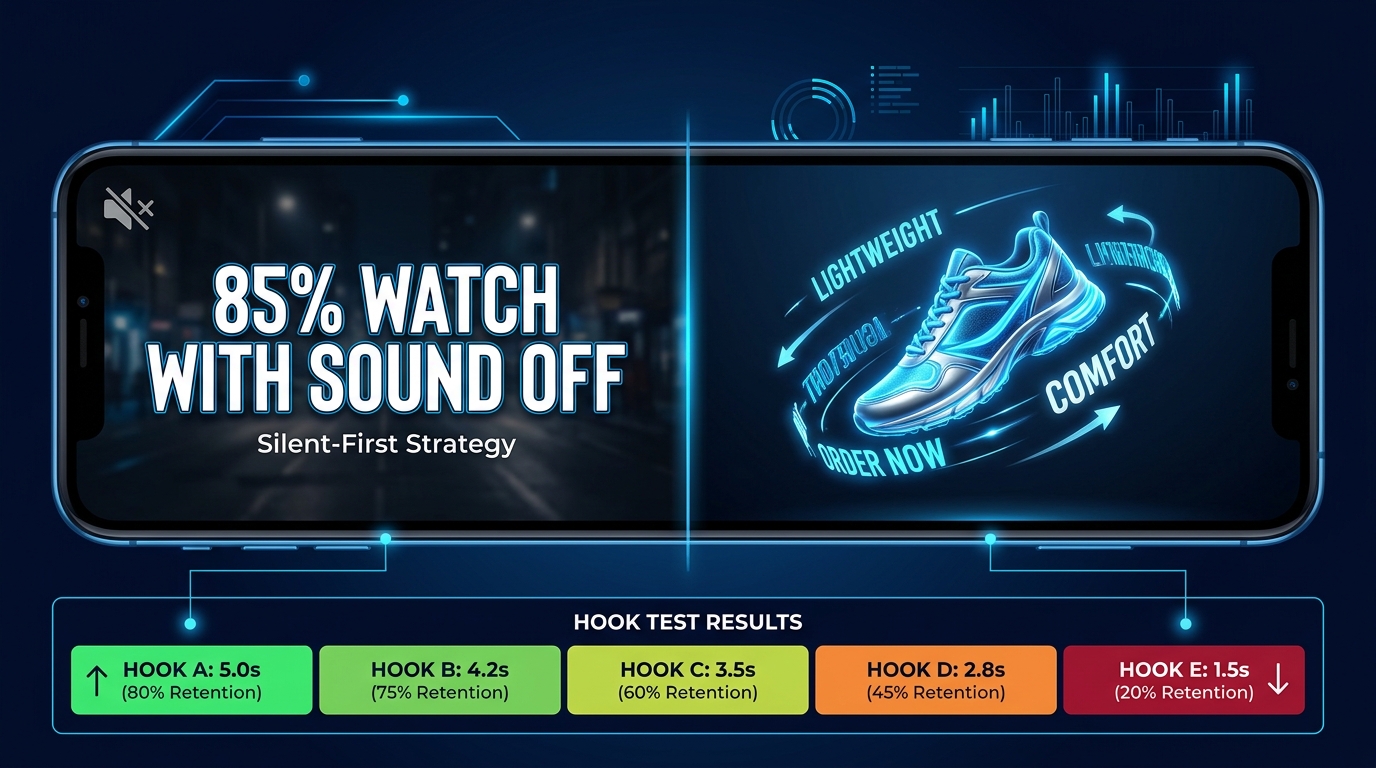
There is a foundational assumption baked into most Sponsored Brands Video creative: that someone is listening. The voiceover explains the benefit. The background music sets the mood. The on-screen demonstration gets narrated in real time. The whole production is engineered around a viewer who has tapped to unmute — a viewer who, in practice, almost never exists.
Amazon SBV autoplays without audio by default. That single sentence should reshape every creative decision you make, and yet the majority of SBV ads in circulation still treat sound as a load-bearing pillar. The voiceover is doing the heavy lifting. The text overlay is an afterthought. The first frame is a logo.
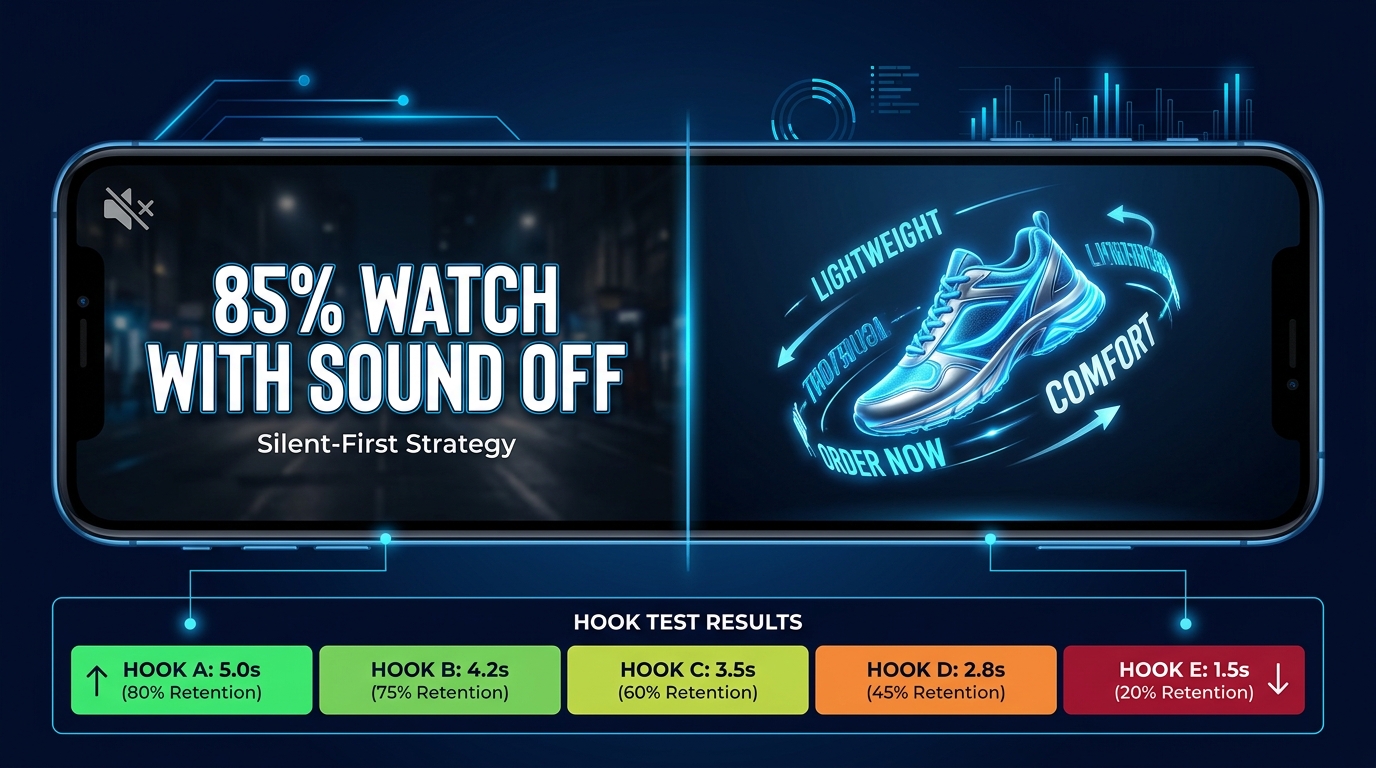
Silent-first creative is not a workaround for the muted-feed reality. It is the correct starting point. It means designing your video so that a shopper who never unmutes still gets the full message — and more importantly, still stops scrolling in the first second. When you add sound to a video that already works silently, you enhance it. When you rely on sound in a video that does not work silently, you have already lost most of your audience before the voiceover begins.
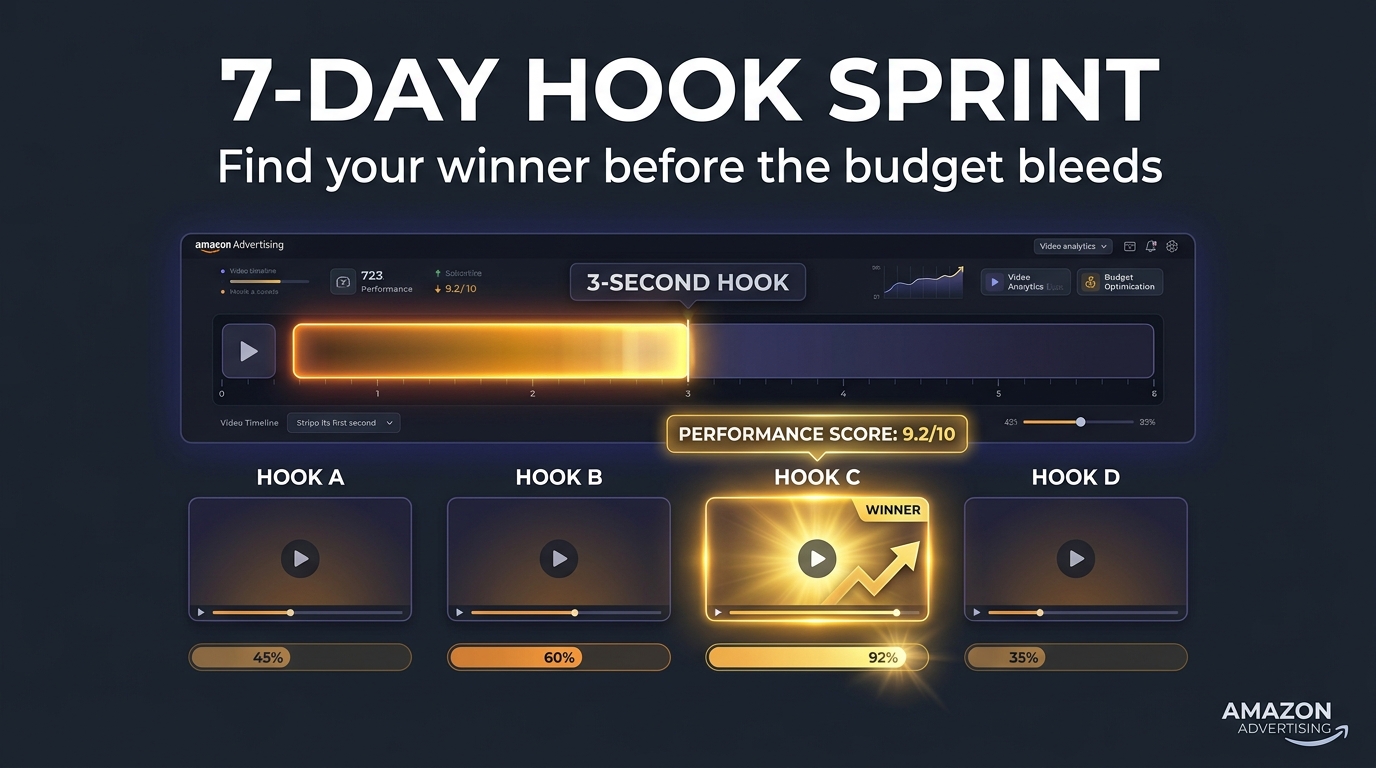
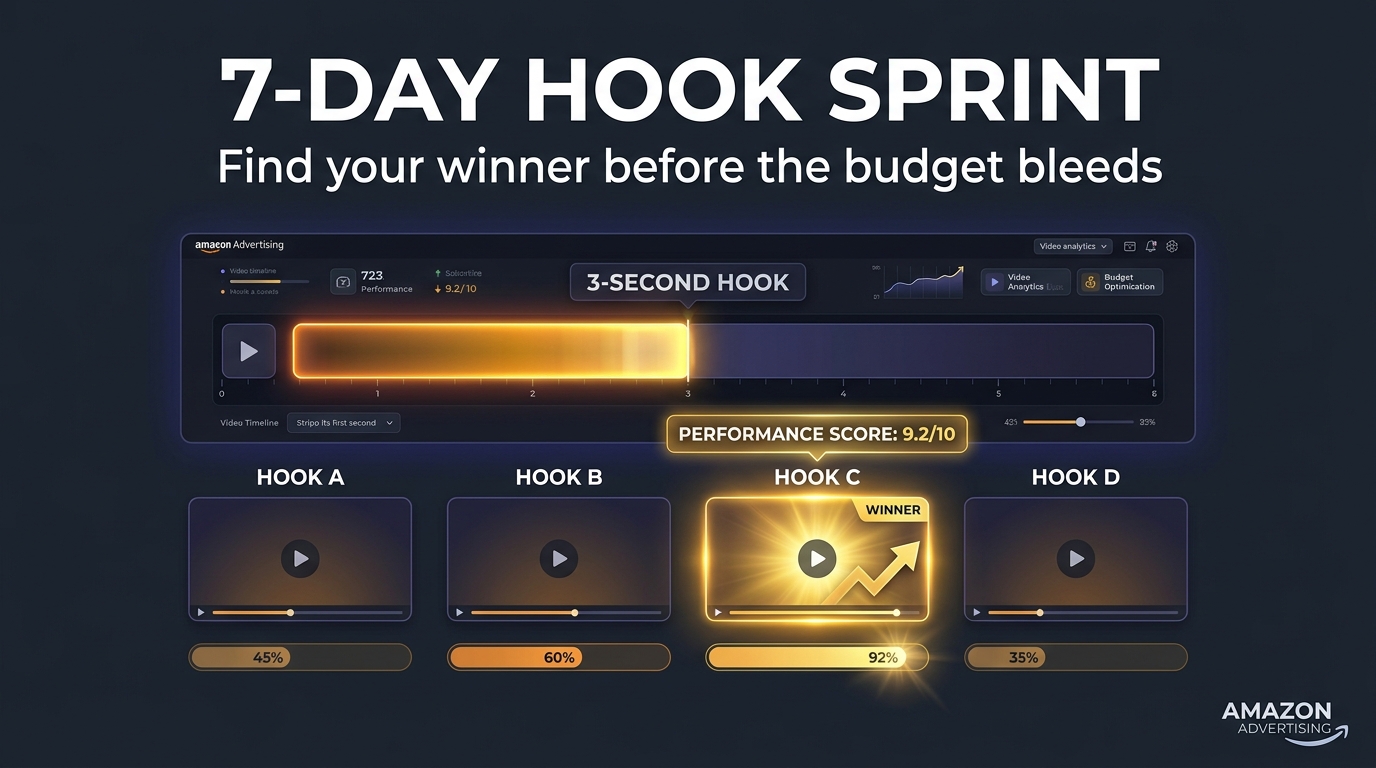
This is where structured hook testing becomes essential. Not testing for its own sake, but specifically testing the first two to three seconds as the primary performance variable. Everything else — the product demo, the proof sequence, the CTA card — can remain constant. The hook is what determines whether any of that content gets seen at all.
This post walks through a specific, executable framework: a five-hook test plan built for silent-first SBV creative. It covers which hook types to test, how to structure the test itself, what metrics actually predict downstream performance, and how to make the kill/iterate/scale decision without guessing.
What “Silent-First” Actually Means — and What It Doesn’t
Silent-first is a design constraint, not a creative style. It does not mean your video should be free of music or voiceover. It means that if you removed all audio from your ad entirely, the message should still land completely — and the first frame should still stop the scroll.
The numbers that underpin this constraint are not new, but they remain consistently underestimated. Feed video on Facebook is consumed without sound roughly 85% of the time. Instagram Feed sits around 70% sound-off. Even on platforms with higher sound-on rates, like TikTok and Reels, autoplay default behavior and social environments (commuting, open offices, public spaces) mean a significant share of impressions play out in silence.
For Amazon SBV specifically, the constraint is baked directly into the platform’s mechanics. These ads autoplay muted in search results. Amazon’s own creative guidance recommends making the core message comprehensible without sound and showing the product within the first two seconds. The implication is that any SBV ad that has not been explicitly designed for silent viewing is not just underperforming — it is structurally misaligned with how the placement works.
The Three Layers of Silent-First Design
Breaking down what silent-first actually requires reveals three distinct layers, each affecting different parts of the video.
Layer 1: The first frame. This is the image a viewer sees before the video begins playing, and also what they see in the first fraction of a second of autoplay. It must function as a standalone signal — communicating category, benefit, or problem before a single word is read or heard. A close-up of a product on a white background fails here. A product mid-use, a before/after composition, or a striking visual anomaly starts to work.
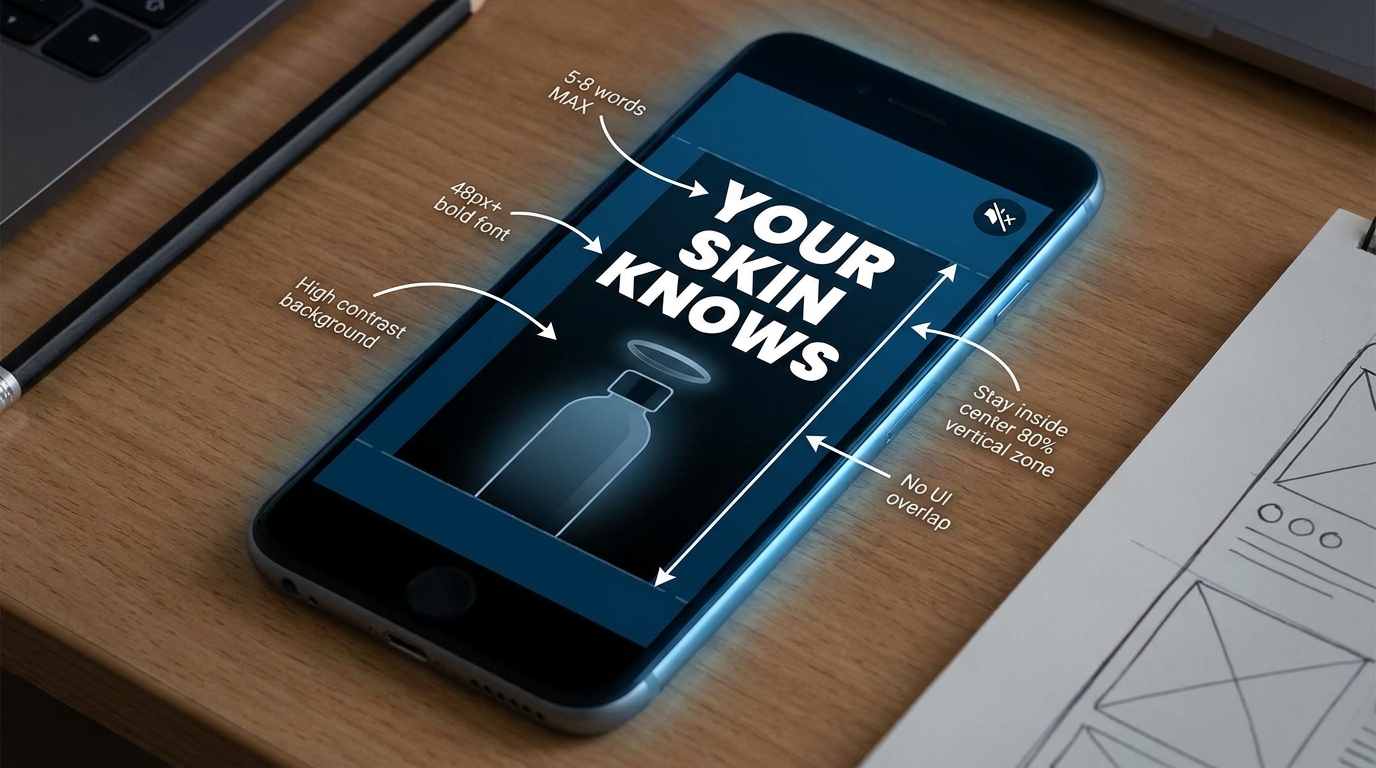
Layer 2: On-screen text hierarchy. Since narration cannot be counted on, text overlays carry the narrative load. The first text element that appears needs to match or reinforce the visual hook — not explain it, not introduce the brand, not set up a joke. It should land the core message or raise the core question in five to eight words. Typography needs to be legible at thumb-size: minimum 48px on a 1080×1920 frame, high contrast, positioned in the center 80% of the frame vertically to avoid platform UI overlap.
Layer 3: Motion pacing. Silent video moves differently from audio-led video. Without sound to create rhythm, the visual rhythm has to do more work. Quick cuts, kinetic text animations, and clear visual progressions (setup → problem → resolution) guide the viewer’s attention in place of audio cues. A slow, lingering first frame that expects a voiceover to carry interest will lose the muted viewer within two seconds.
Understanding these three layers matters because each one can become a hook testing variable — but only one should be tested at a time. The five-hook framework described below focuses primarily on hook type and first-frame concept, while holding Layer 2 and Layer 3 execution as consistent as possible across variants.
Why SBV Is the Ideal Hook Testing Environment
Not all ad formats are equally good testing grounds for creative hypotheses. Some placements mix too many variables — audience behavior differs by time of day, by device, by intent signal. Some formats have too little volume to generate statistically useful data within a reasonable budget. Some platforms make it difficult to isolate creative as the only changing variable.
Amazon SBV avoids most of these problems for a specific reason: placement intent is relatively homogeneous. People see SBV ads because they searched for something. The intent signal is real and active. A viewer who sees your ad searched for a keyword that matched your targeting. That creates a more controlled test environment than most social feed placements, where audience behavior varies dramatically by mood, context, and passive vs. active browsing.
The Search-Intent Advantage
When your ad reaches someone who typed in a relevant search query, you have already passed the relevance filter. The test you are running is not “is this product relevant to this person?” — that question has been largely answered by the keyword match. The test becomes purer: “Does this hook stop this already-relevant shopper in the first three seconds?”
This distinction matters enormously for hook test validity. On social platforms, a weak hook might reflect a targeting problem rather than a creative problem. On SBV, if your hook rate is low, the hook is almost certainly the issue. That makes SBV one of the cleanest environments available for isolating creative performance from audience performance.
CTR as a Meaningful SBV Signal
SBV benchmarks in 2026 show click-through rates in the range of 0.89% to 1.0%, compared to 0.3% to 0.4% for static Sponsored Brands formats. The gap matters for testing because it gives you more signal per impression — a higher base CTR means you hit meaningful thresholds faster and with less spend. Running a five-hook test across $50 to $60 of test budget (roughly $10 to $12 per variant) can generate directional data within a few days in most categories. That testing velocity is difficult to match in other video placements.
The combination of search intent, format-level CTR advantage, and structural simplicity (15-second videos are fast to produce in multiple variants) makes SBV the most efficient hook testing format available to product advertisers right now.
The 5 Hook Types: What They Are and Why Each Earns Its Slot
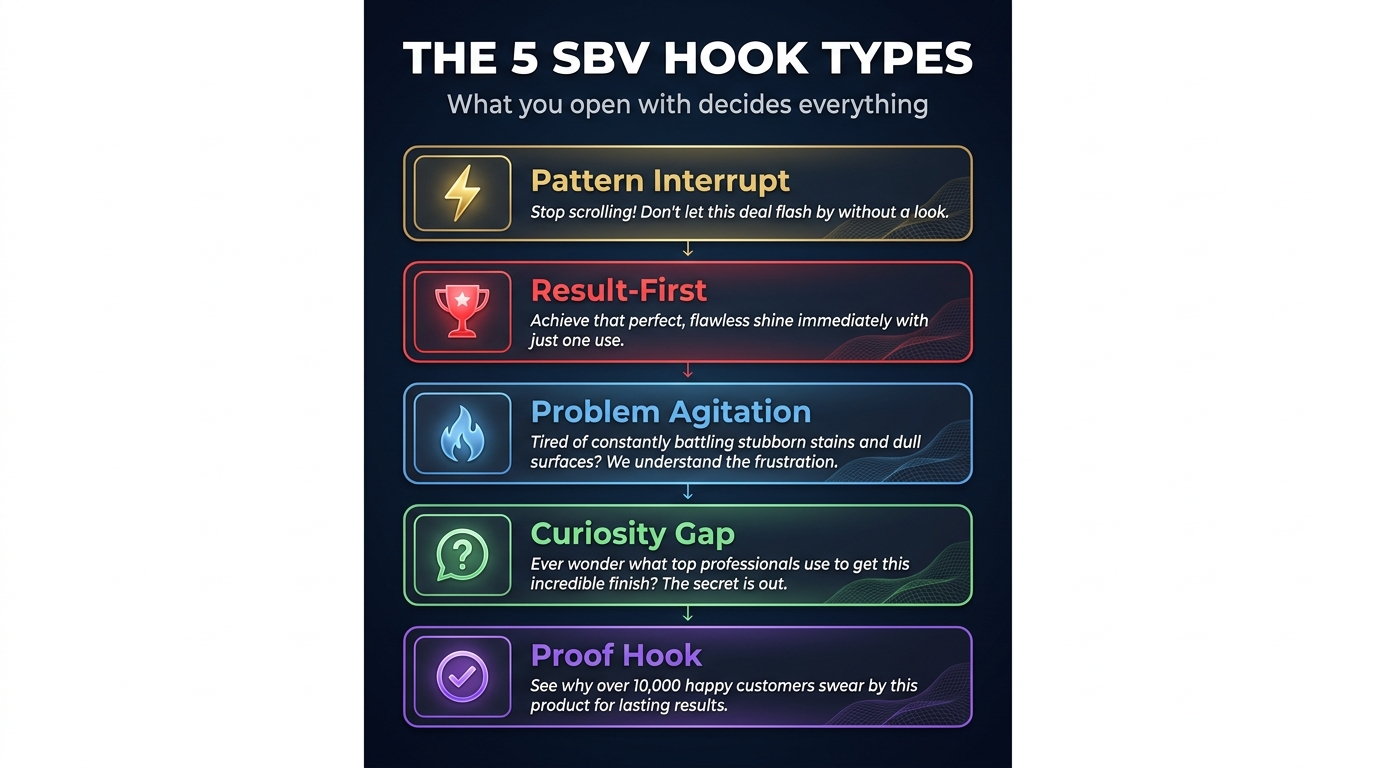
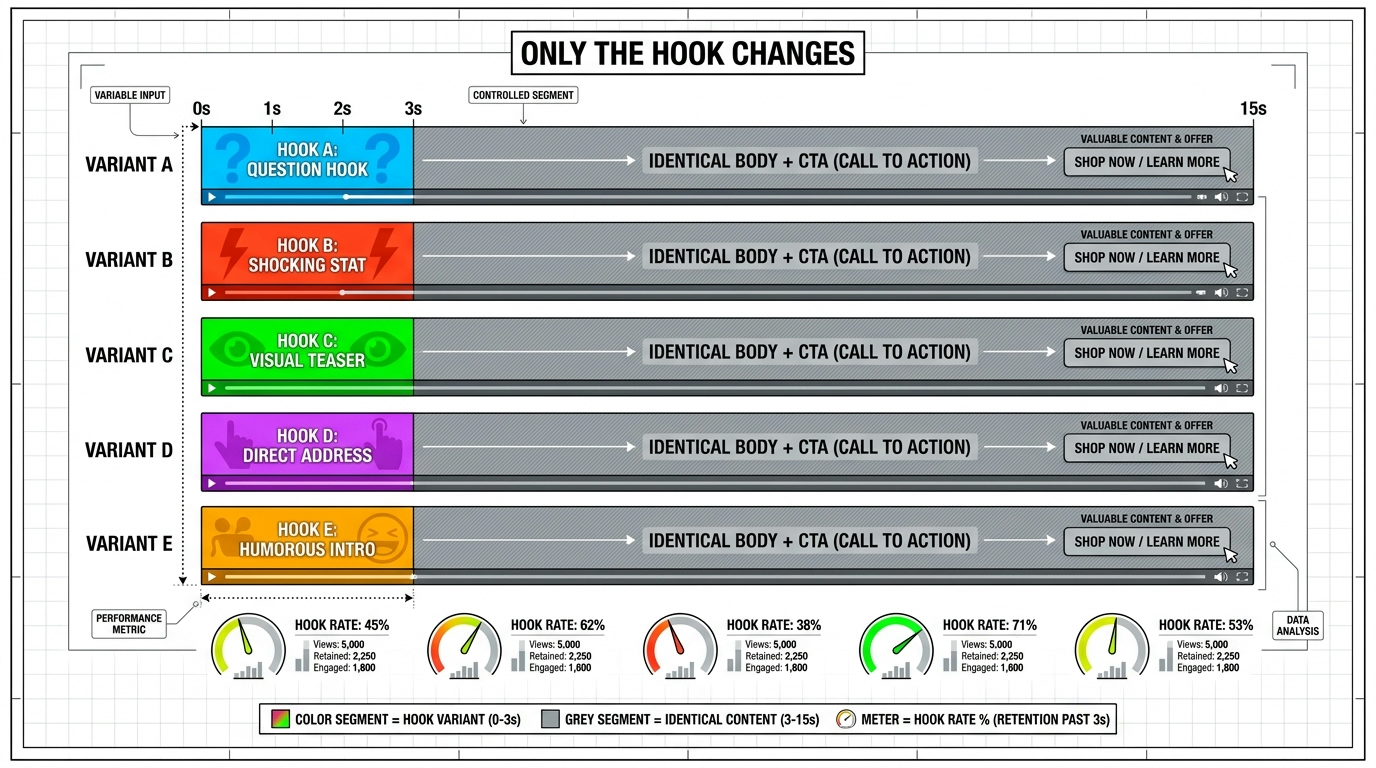
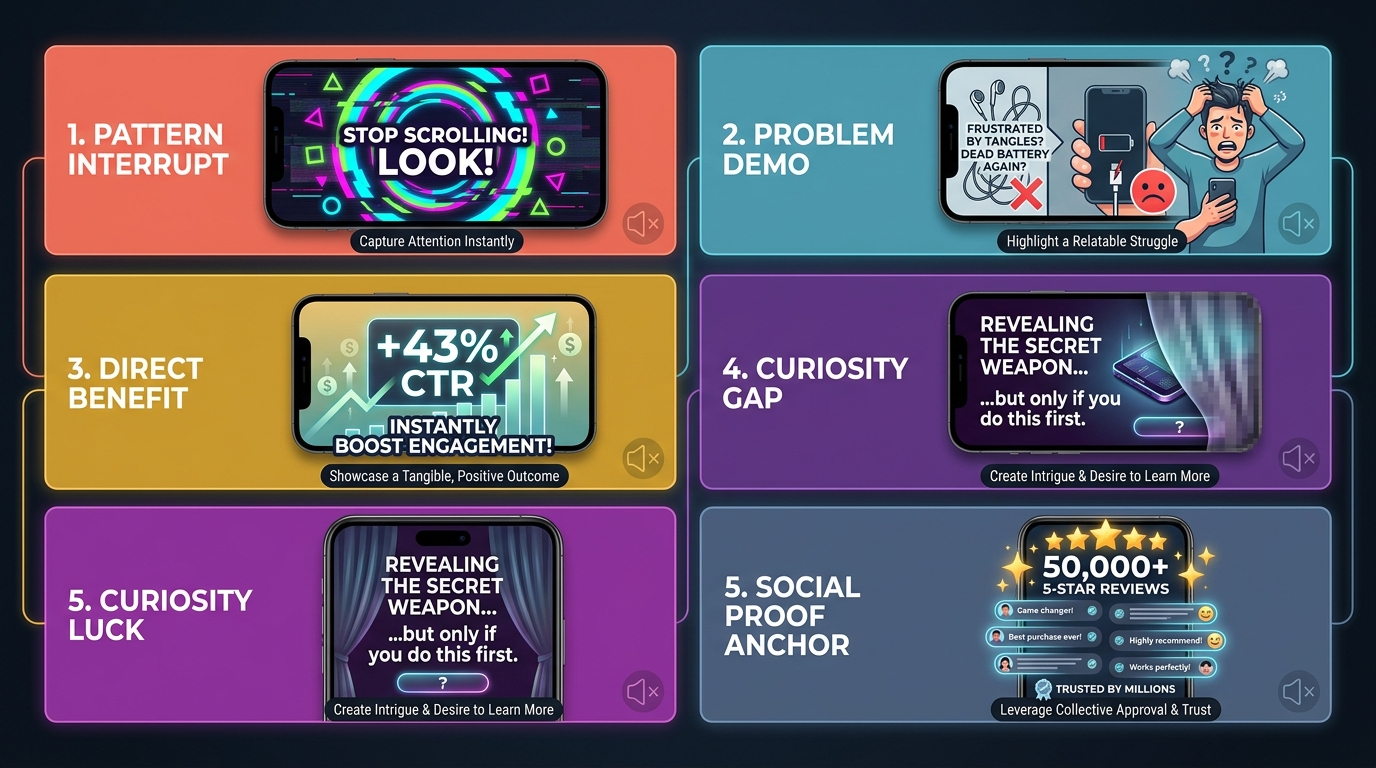
The five-variant test plan is not arbitrary. Each hook type tests a fundamentally different psychological mechanism for stopping the scroll. Running all five simultaneously against the same body content gives you a read on which mechanism resonates most strongly with your specific audience and category — and that information has compounding value across every future creative you produce.
Here is the breakdown of each hook type, why it works in a silent-first context, and how to execute it on SBV.
Hook 1: The Pattern Interrupt
The pattern interrupt works by making the first frame visually inconsistent with what the viewer expects to see in their feed. It wins on pure attention mechanics: the brain flags unexpected stimuli as high-priority and pauses the scroll automatically before conscious decision-making kicks in.
In silent-first execution, this means your first frame needs to be visually jarring — not offensive, but unexpected. This could be an extreme close-up of a texture, a product shot from an unusual angle, a color that cuts sharply against the surrounding page aesthetic, or a rapid-cut cold open that begins mid-action rather than setting a scene. One 2026 dataset ranked pattern interrupts as the strongest hook type for early retention and thumb-stop rate, with some reports noting 72%+ better watch time versus generic product reveal openers in direct comparisons.
The text overlay in a pattern interrupt hook should deepen the confusion rather than explain it away. Something like “Wait — this is not what you think it is” or a single provocative word overlaid on the unexpected image pushes the viewer further into the video before they can consciously decide whether to continue.
Best fit: Visually distinctive products, categories where the standard creative looks similar across brands, and any product with a surprising mechanism or ingredient.
Hook 2: The Problem Demo
The problem demo opens by showing the pain point — not by describing it, but by demonstrating it visually. This hook type works because it creates instant relevance for shoppers who have the problem. If your product solves a specific frustration, showing that frustration in action in the first two seconds creates a recognition response: “that’s me.”
Silent-first execution of the problem demo relies entirely on the visual. Showing a leaking water bottle, a tangled cable, a skincare product pilling on skin, or a disorganized desk communicates the problem before any text appears. The text overlay then names it explicitly — “Still dealing with this?” or “That’s not supposed to happen” — and immediately transitions to the product as the resolution.
Problem demos are particularly effective on SBV because the search context amplifies the relevance. A shopper who searched “leak-proof water bottle” is already in problem-solution mode. Showing the problem they just searched to solve creates an extremely tight attention-capture loop.
Best fit: Products that solve a specific, visually demonstrable frustration. Kitchen, fitness, home organization, beauty, and pet categories all have strong problem-demo potential.
Hook 3: The Direct Benefit Statement
Where the pattern interrupt and problem demo work by creating a gap that pulls the viewer forward, the direct benefit statement does the opposite: it leads with the answer and earns attention through the specificity and credibility of the claim.
The key word is specific. “Moisturizes your skin” is not a direct benefit statement — it is a category description. “Clinically shown to reduce redness in 48 hours” is a direct benefit statement. The specificity signals credibility, which signals that the next 12 seconds of video are worth watching to see how the claim is supported.
In silent-first execution, this hook lives almost entirely in the on-screen text of the first two to three seconds, supported by a visual that either shows the outcome (after state) or shows the product clearly. The text should be large, centered, and immediately readable — no animation delay on the first frame. The shopper needs to read the claim before they can consciously decide to continue.
Best fit: Products with strong clinical, quantitative, or customer validation. Supplements, skincare, performance tools, and products with third-party certifications all perform well here.
Hook 4: The Curiosity Gap
The curiosity gap hook works by withholding information the viewer has just been made to want. It creates a knowledge asymmetry — you hint at something meaningful without delivering it — and the desire to resolve the asymmetry is what drives continued viewing.
On SBV, curiosity gap hooks tend to start with a provocative incomplete statement: “Most people who buy this get it wrong.” or “The reason this ingredient is different from every other brand.” The visual supports the intrigue without resolving it. Partial product reveals, cropped frames that obscure the full image, and visual metaphors that raise questions all work.
The critical execution risk with curiosity gap hooks is the payoff. If the rest of the video does not deliver an answer that feels commensurate with the setup, completion rate drops and downstream CTR suffers. This hook type requires the body content to deliver on the promise within 10 to 12 seconds. In a 15-second SBV, that is achievable — but only if the scriptwriting is disciplined.
Best fit: Products with a genuinely interesting mechanism, formulation, or backstory. Works well in supplements, specialty food, tech accessories, and premium personal care.
Hook 5: The Social Proof Anchor
Social proof hooks lead with the size and sentiment of existing customer validation. The logic is borrowed from behavioral economics: when shoppers are uncertain, they default to what other people have chosen. Opening with a credible proof signal bypasses that uncertainty immediately.
In silent-first execution, the social proof anchor is almost always a bold text overlay in the first frame: “47,000 five-star reviews,” “The #1 best seller in this category for 3 years,” or a customer quote pulled to the front of the video before any product context is given. The visual should reinforce the social proof framing — customer imagery, review screenshots, or a badge — not compete with it.
Social proof hooks rank below pattern interrupts and problem demos on raw stop-rate in most 2026 benchmark data. Their strength is in conversion quality: the viewers who continue past a social proof hook are pre-qualified by the signal. The hook self-selects for shoppers who weight peer validation — who tend to have higher purchase intent when they do click through.
Best fit: Products with substantial verified review counts, award recognition, or notable celebrity/media mentions. Less effective for new products or low-review ASINs where the proof signal is thin.
Building the Test: What Stays Fixed, What Changes
The validity of any hook test rests entirely on isolation. If you change the hook and also change the background music, the product sequence, the CTA wording, or the end card — you no longer have a hook test. You have a random creative comparison that will produce results you cannot learn from.
A rigorous five-hook test has exactly one changing variable: the first two to three seconds. Everything else is held constant across all five variants.
The Fixed Variables
The following elements must be identical across every variant in the test:
- Body content (seconds 4–12): The product demonstration sequence, the benefit build, the visual storytelling — all identical. Same footage, same edit, same pacing.
- CTA and end card (seconds 13–15): Same text, same visual treatment, same audio if sound is used. Do not change the call to action between variants.
- Audio treatment: If you use background music in the body, it should be the same track across all variants. If one variant uses a sound effect in the hook, replicate the equivalent sonic weight in other hook variants where possible — or strip audio from all hooks and let the body audio carry the sound layer.
- Campaign targeting: Same keywords, same match types, same bid strategy, same budget allocation. Run all five variants in the same campaign or ad group with equal budget distribution.
- Flight timing: Launch all five variants simultaneously. Staggered launches introduce time-of-day and day-of-week confounds that will skew your comparison.
- Product page destination: All five variants should link to the same ASIN and the same product page. If the landing page differs, you cannot attribute CTR or conversion differences to the hook.
What Changes: The Hook Window
The hook window for SBV is the first two to three seconds of video. Within that window, you have three levers to vary across your five hook types:
- Opening visual: The first frame image or motion sequence that appears before any text is visible.
- First text overlay: The initial on-screen copy element — the hook headline in five to eight words.
- Visual-to-text timing: Whether the text appears in the first 0.1 to 0.5 seconds (immediate read) or after a beat of visual impact (0.5 to 1.5 seconds). This timing choice affects whether you lead with visual punch or verbal clarity.
Each of your five hook variants will combine these levers differently to express a different hook type. The pattern interrupt might lead with an unusual visual for 0.8 seconds before text appears. The direct benefit statement might put bold text on screen within 0.2 seconds against a clean product background. The curiosity gap might show a provocative incomplete sentence over a partially obscured product reveal.
Write each of the five hook concepts completely before production begins. If any two hook concepts feel like variations of the same idea — slightly different phrasing of the same mechanism — revise until all five are genuinely distinct. The test loses diagnostic value when two variants are essentially measuring the same hook archetype.
Budget and Run Time
The directional threshold for hook testing on SBV is approximately 500 to 1,000 impressions per variant, which typically translates to $5 to $12 of spend per variant at current SBV CPM levels. A five-variant test can generate directional data for $25 to $60 total. For categories with higher CPMs, budget accordingly — but resist the temptation to run variants at very different spend levels, which will introduce delivery bias.
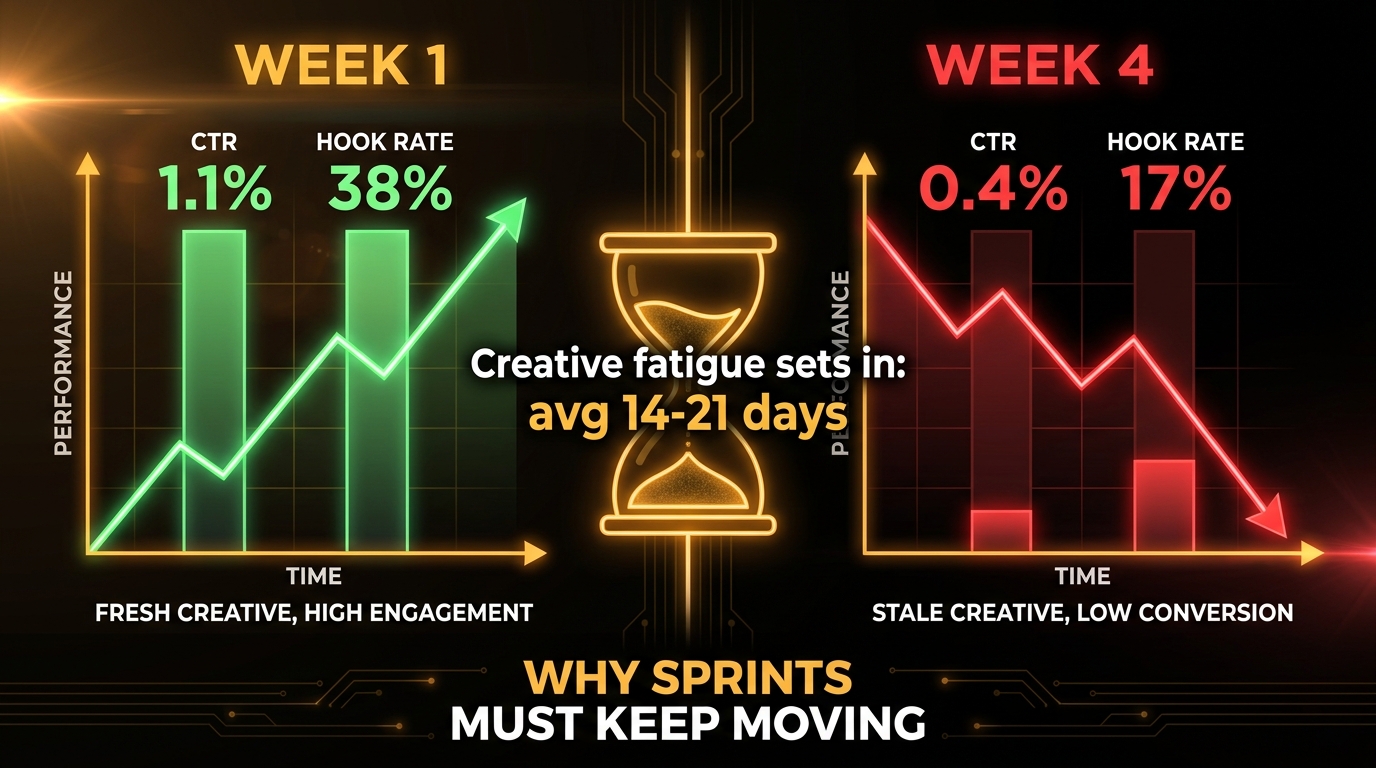
Run the test for a minimum of five days to account for day-of-week behavioral variation. Do not call a winner based on two days of data. Do not let any variant run for more than 14 days before reviewing — creative fatigue in small test budgets is real, and extended runs can produce misleading trend data.
The Metrics That Actually Matter — and the Ones You Should Ignore
Hook testing produces a range of data points, and not all of them are equally predictive of downstream performance. The most common mistake in creative testing is optimizing for metrics that are easy to see rather than metrics that actually connect to business outcomes.
Tier 1: Hook Rate (3-Second View Rate)
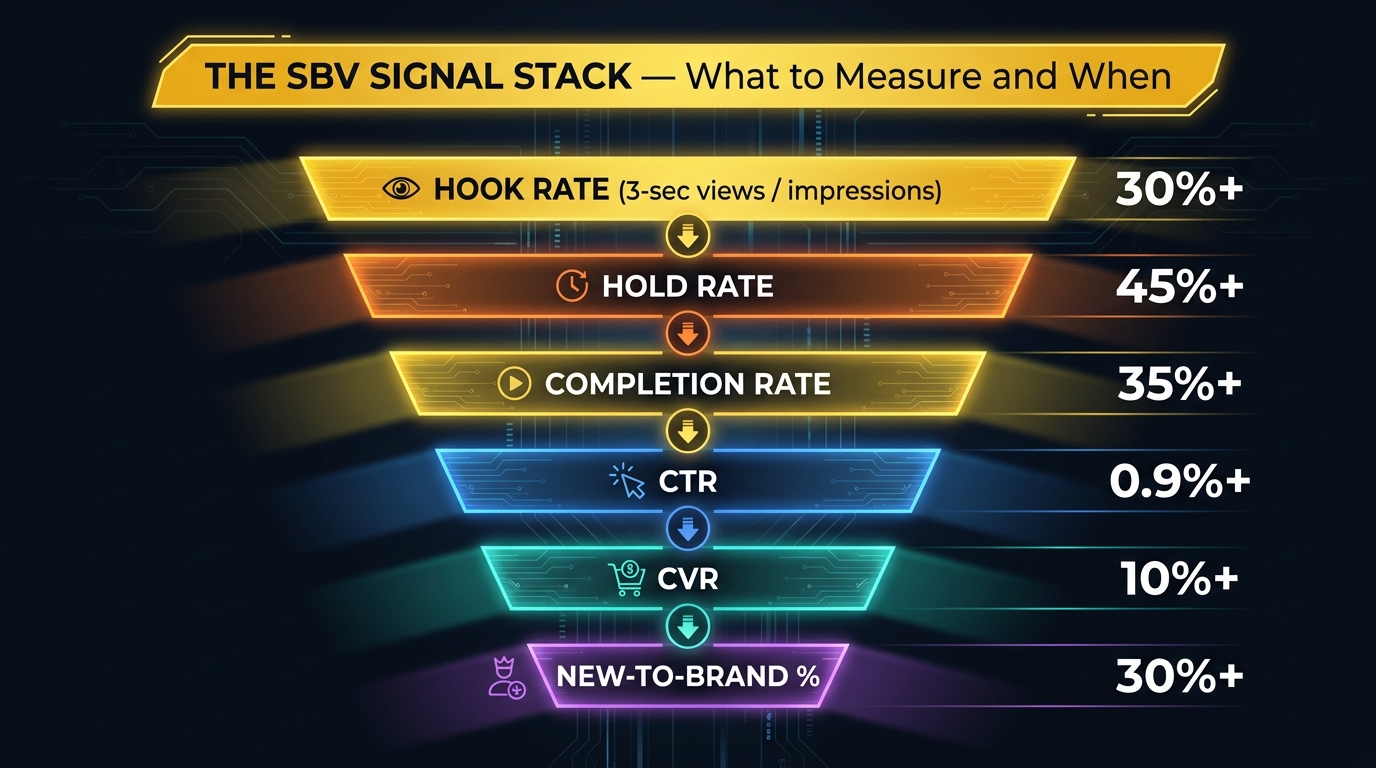
The primary metric for a hook test is hook rate — the percentage of viewers who watch at least three seconds of the ad. This is sometimes called thumb-stop rate or 3-second view rate depending on the platform. It directly measures whether the hook accomplished its job: preventing the scroll.
2026 benchmark thresholds for hook rate:
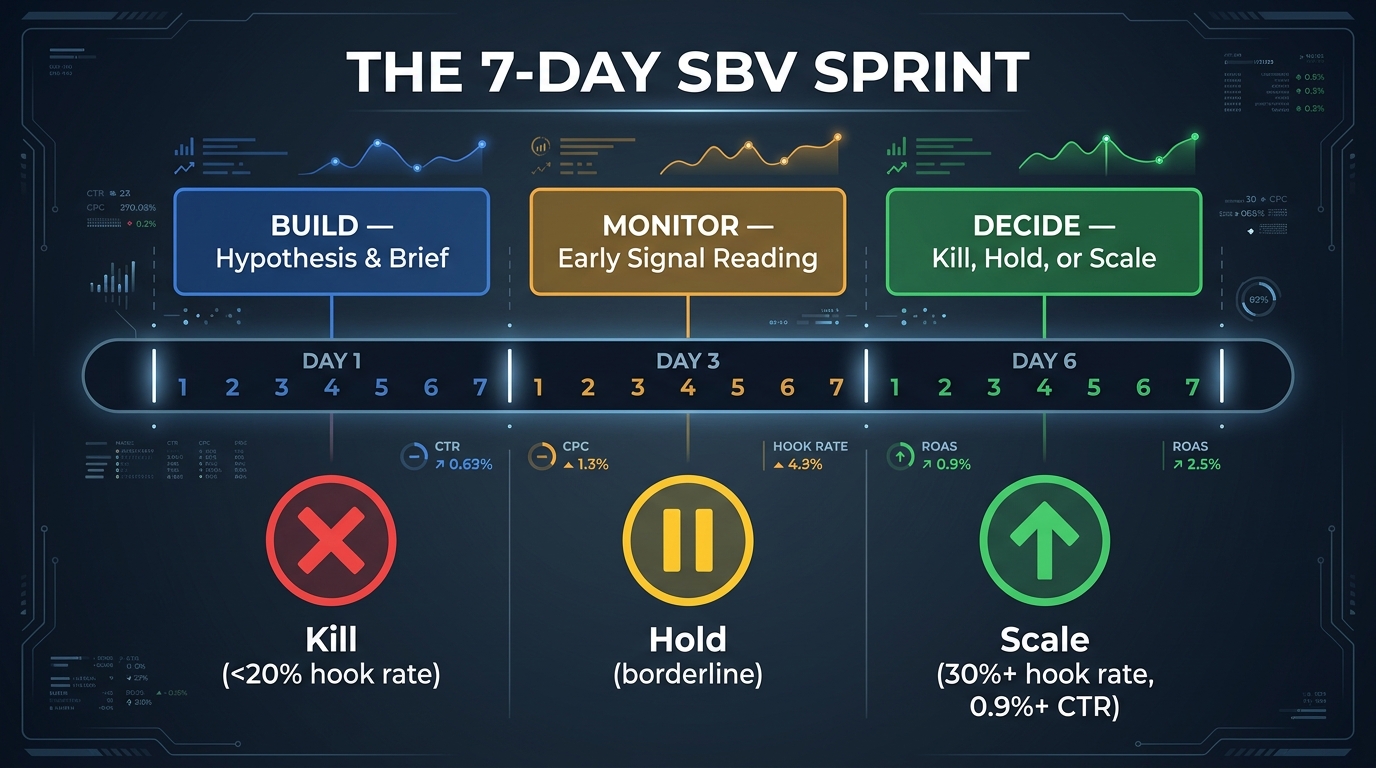
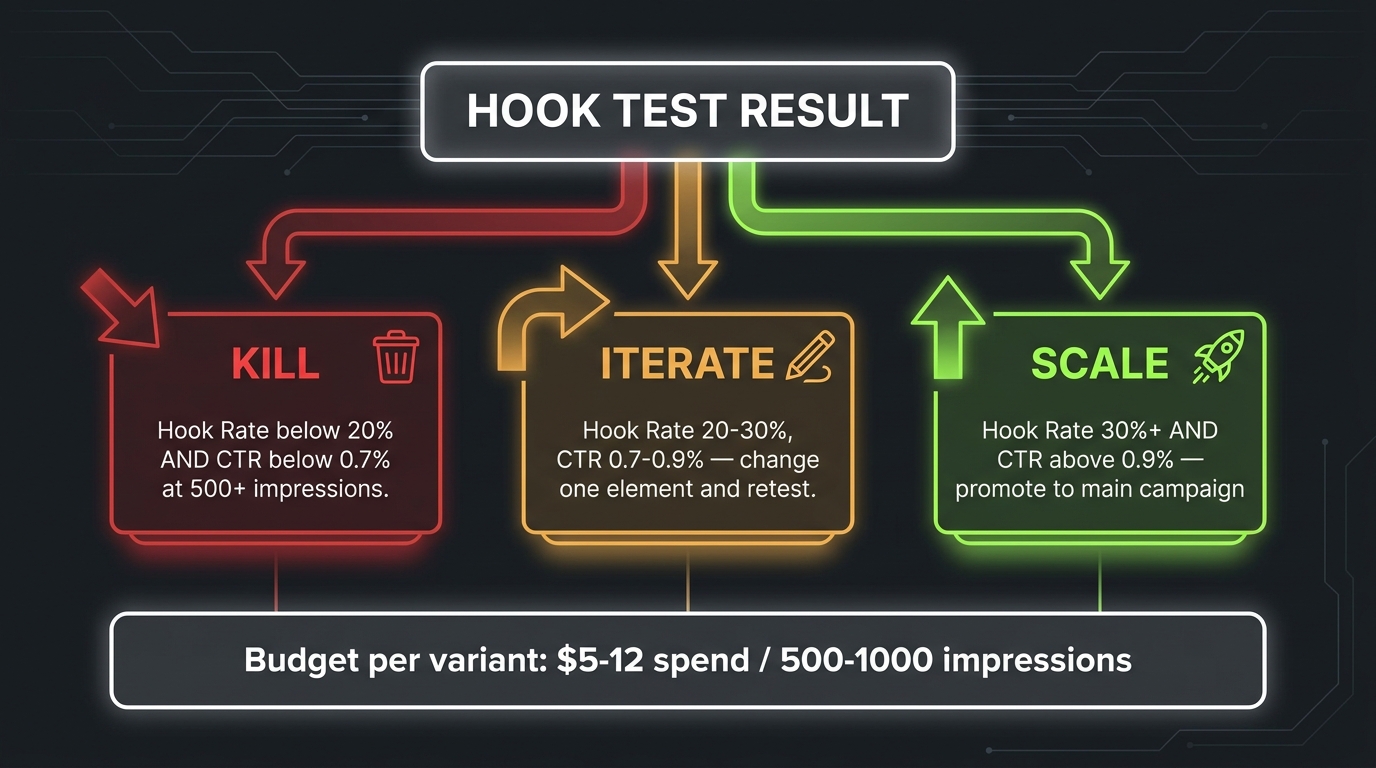
- Below 20%: Weak. The hook is not stopping the scroll for a meaningful share of relevant shoppers. Kill or fundamentally redesign.
- 20–30%: Average. The hook has some stopping power but is not exceptional. Iterate — identify the weakest element (visual, text, or timing) and revise.
- 30–40%: Strong. The hook is performing above the median. Eligible for promotion pending CTR confirmation.
- 40%+: Exceptional. Scale with confidence. Investigate what made this hook work and apply the principle to future creative development.
Tier 2: Outbound CTR
Hook rate tells you whether people watched. Outbound CTR tells you whether they acted. A hook can have a strong hook rate but weak CTR if it attracts the wrong type of attention — entertainment rather than purchase consideration. This is particularly important for curiosity gap and pattern interrupt hooks, which sometimes generate high retention but lower click rates because the intrigue satisfies itself within the video.
SBV outbound CTR benchmarks:
- Below 0.7%: Investigate whether the hook is attracting shoppers with actual purchase intent.
- 0.7–0.9%: Acceptable, approaching benchmark average.
- 0.9–1.2%: Strong. Hook is generating both attention and intent.
- Above 1.2%: Exceptional performance — analyze and document what drove this for replication.
Tier 3: Completion Rate
Completion rate (the percentage of viewers who watch the full 15 seconds) is a secondary signal for hook tests. It measures the quality of the body content more than the hook itself, since the hook’s job is done by second three. However, if completion rate varies significantly across hook variants while the body content is identical, it suggests that different hooks attract different quality audiences — some of whom are more engaged by the product story than others.
Metrics to Deprioritize in Hook Tests
Impressions and reach: These are delivery metrics, not creative performance metrics. They tell you how much your ad ran, not whether it worked.
Average watch time: Too easily distorted by a small number of full-view completions. Use the retention curve and 3-second rate instead.
Conversion rate from ad: Important eventually, but too noisy in a small hook test. Conversion rates require significantly more volume to produce statistically reliable reads. Use CTR as a leading indicator in the test phase and measure conversion after you have promoted a winner.
Likes, saves, comments: Engagement metrics on SBV are not primary performance signals for a direct response creative test. Do not let vanity metrics influence which hook you promote.
Kill, Iterate, or Scale: A Decision Framework with Real Thresholds
The test data means nothing without a pre-committed decision framework. Define your kill, iterate, and scale criteria before you launch — not after the data comes in. Post-hoc rationalization is one of the most common ways teams end up running the wrong creative for months.
The Three-Gate Decision System
Gate 1 is the impression floor: do not make any decision until each variant has cleared at least 500 impressions. Below that threshold, performance numbers are noise. If you are hitting the impression floor but a variant has a 0% hook rate — literally no one watched three seconds — that variant is a confirmed kill regardless of impression count.
Gate 2 is the hook rate check. Apply the tier thresholds defined above. Any variant below 20% hook rate at 500+ impressions goes to kill (or deep iteration if you have a hypothesis about what to fix). Variants in the 20–30% range go to iterate. Variants at 30%+ advance to Gate 3.
Gate 3 is the outbound CTR check. Of the hooks that cleared Gate 2, compare outbound CTR. A hook with a 38% hook rate but a 0.5% CTR is generating attention from the wrong audience. A hook with a 31% hook rate and a 1.1% CTR is your winner. Scale that one.
When Multiple Hooks Pass All Three Gates
Occasionally — particularly with well-developed product creative — two or three hook variants will both clear all three gates. In this case, do not simply pick the single best performer and retire the others. Run the top two in an extended head-to-head at higher spend to confirm the leader. The second-place hook may also have category or audience sub-segment applications where its specific mechanism outperforms — keep it available as a rotation option.
When No Hook Passes Gate 2
If all five variants come in below 20% hook rate, the problem is not which hook type you chose. The problem is likely one of three things: the visual execution of the first frame is weak across all variants, the product category has a very low average hook rate on SBV (some do), or the ad is reaching the wrong audience. Before redesigning all five hooks, check that your targeting is genuinely matched to search intent. A low hook rate on the wrong audience tells you nothing about the hooks themselves.
Iterating on a Hook Variant
When a hook lands in the 20–30% iterate zone, resist the temptation to rewrite it entirely. Identify the weakest element and change only that. If the visual opening is strong but the text overlay is weak, revise the text only. If the text concept is right but the visual is generic, replace the visual only. Keeping one element fixed per iteration means you are still running a valid single-variable test — you just moved the test one level deeper.
The 5-Frame First-Second Blueprint: Visual Design for Muted Feeds
Understanding hook types at a conceptual level is necessary but not sufficient. The actual execution of each hook’s first second lives in specific, implementable visual design choices. This section covers the craft decisions that determine whether a strong hook concept translates into a strong hook rate.
Typography Rules for Silent-First Hooks
Text that appears in the hook window needs to be instantly readable under three conditions simultaneously: small screen, one hand, no audio. That means size, contrast, and simplicity are non-negotiable.
- Minimum 48px at 1080×1920 resolution for hook text. Primary hook headlines benefit from 60–72px or larger. Secondary text that appears in the hook window (product name, benefit label) should not compete with the headline — use it at 36–44px maximum.
- High contrast always. White on dark, dark on light, or use a high-opacity backdrop behind text that appears over complex visual backgrounds. Never use medium-contrast combinations where the text blends into the background.
- Five to eight words maximum for the hook headline. If you cannot express the hook concept in eight words, you have not distilled it enough. Longer text in the first two seconds requires more cognitive load and slower reading — both of which increase the probability of a scroll before the text is processed.
- Text-safe zones: Place hook text between 10% and 80% of the frame height (leaving the top 10% and bottom 20% clear for platform UI elements like the search bar and ad label). Horizontally, keep text within the center 90% of the frame width.
Motion Design for the First Second
The motion choices in the first second are separate from the hook type but equally important for silent-first performance.
In-motion openers (where the video starts mid-action rather than with a static image) consistently outperform static first frames on hook rate. The movement itself triggers the perceptual system to pay attention before the viewer has consciously decided to watch. For pattern interrupt hooks, extreme or unexpected motion amplifies the hook effect. For problem demo hooks, showing the problem in mid-occurrence creates an immediate what-is-happening-here response.
Text animation should be simple and fast. Fade-ins that take more than 0.3 seconds delay the hook read. Pop/scale animations that complete in 0.1 to 0.2 seconds work well. Avoid decorative text entrances (typewriter effects, slide-from-off-screen) in the hook window — they add time before the text is fully readable, and that time is precious.
Color and Contrast Against the Amazon Feed Environment
Amazon’s search results page has a predominantly white background with black text. SBV ads appear within this environment. Creative that also uses a white background blends into the feed — the opposite of pattern interruption. Dark-background hooks, high-saturation color blocks, and visually rich first frames all stand out more strongly against the typical Amazon SERP aesthetic than light, minimal creative does.
This does not mean all SBV should use dark backgrounds. But it does mean that the contrast of your first frame should be evaluated against the platform’s ambient visual environment, not in isolation on a design tool canvas.
From Test Winner to Evergreen Asset: The Iteration Cycle
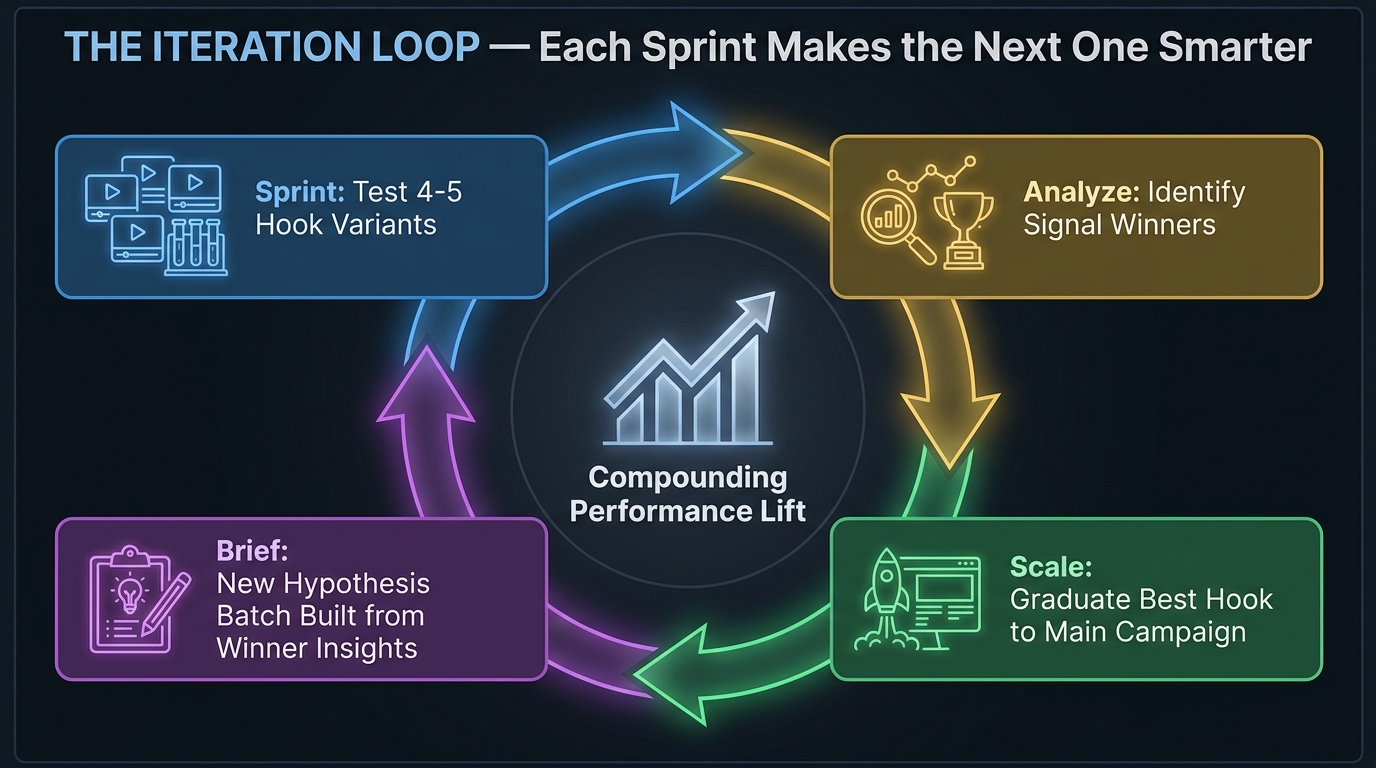
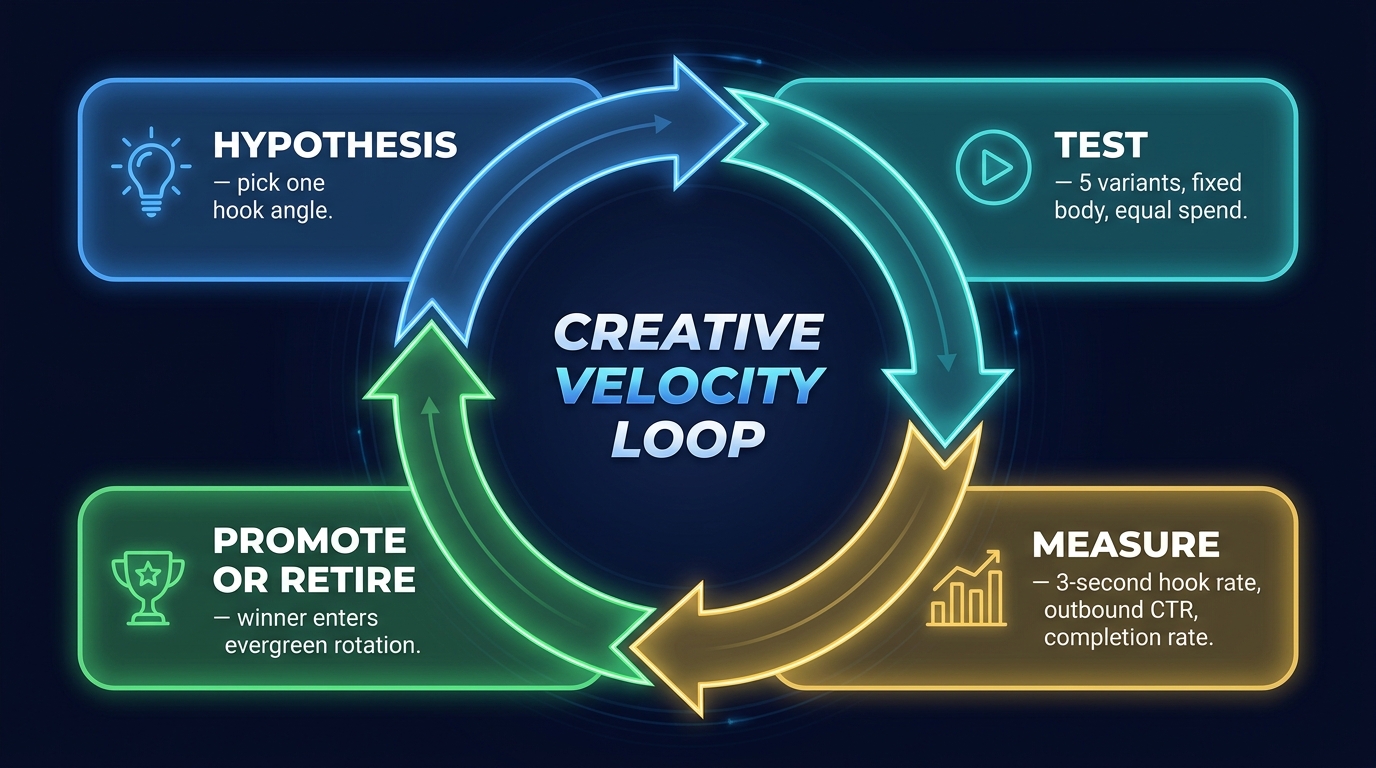
The five-hook test is not a one-time exercise. The real value of the framework is what it produces over time: a growing body of data about which hook mechanisms work for your specific product, category, and audience. Each test cycle informs the next, and the cumulative effect is a creative development process that gets measurably faster and more accurate with each iteration.
How to Transition a Winner into Production Scale
When a hook variant clears all three decision gates, the transition to production scale involves several steps that are easy to overlook.
First, document the winner in detail before scaling. What is the exact visual in the first frame? What is the on-screen text, including exact wording, font, size, and position? What is the timing of text appearance? What visual motion leads the hook? This documentation means you can recreate the hook structure for future products or seasonal variations without relying on memory or guesswork.
Second, produce the winner at full production quality if the test was done with rough edits. Hook tests can legitimately be done with lower-cost production — even with smartphone footage — as long as the creative concept is clear. But the scaling version of the ad should be produced with the same care as your primary brand creative. The hook concept has been validated, but the execution quality still affects performance at scale.
Third, set a creative fatigue monitoring cadence. Even strong hooks degrade over time as the same audience sees the same ad repeatedly. Monitor hook rate and CTR at weekly intervals once you scale a winner. When hook rate drops more than 20% below its peak performance, it is time to launch the next test cycle.
The Second-Generation Test
Once you have a winning hook type identified — say, problem demo consistently outperforms the other four for your product — the second-generation test goes one level deeper. Instead of testing five different hook types, you test five different problem demo executions. Different problems. Different visual framings of the same problem. Different emotional registers (humor versus frustration versus surprise).
This progressive refinement is what distinguishes teams that get compounding creative improvement from teams that run occasional tests and call it optimization. Each generation of testing narrows the question, making the answers more precise and more actionable.
Cross-Channel Application of Hook Winners
SBV hook test winners have immediate application beyond Amazon. A problem demo hook that converts searchers on Amazon is almost certainly worth testing as a TikTok Shop ad, a Meta Reels placement, or a YouTube pre-roll. The specific edit may need to change (aspect ratio, pacing, caption style), but the core hook concept — the type of first-frame visual, the text mechanism, the opening emotional beat — is platform-agnostic.
Teams that maintain a hook learnings repository (a simple document tracking which hook types won, by product, by quarter, with performance numbers attached) can accelerate creative briefing across every channel. Rather than starting from scratch each time, a brief can specify “use a problem demo hook, specifically showing the product failure in the first 1.5 seconds” and the creative team has a validated structural foundation to build from.
Common Mistakes That Corrupt Your Hook Data
Even teams with the right framework make execution errors that compromise the validity of their test results. These are the most common — and most costly — mistakes in hook testing practice.
Changing More Than the Hook
The most frequent error: variants that differ in the hook and also in the body content, the music, the CTA, or some other element. Usually this happens because the editor makes small improvements across the whole video during production rather than locking the non-hook elements and only cutting the hook. The fix is to produce the body and CTA first, lock that edit, and then cut five different hook sequences onto the front of the same locked edit. Do not go back to the body once the hook production begins.
Calling a Winner Too Early
After 50 impressions, one variant might show a 45% hook rate and another a 12% hook rate. That is not statistically meaningful data. Small sample sizes produce wild performance swings. The 500-impression minimum threshold exists for this reason. The impulse to call an early winner and reallocate budget to it is understandable but destroys the test. Equal budget and equal runtime until the threshold is cleared — no exceptions.
Running Tests in Separate Campaigns or Ad Groups
If each hook variant is in its own campaign with different budget caps, different bid settings, or different targeting parameters, you are no longer comparing hooks — you are comparing campaigns. All five variants need to compete for impressions under the same conditions. A single campaign with equal budget allocation across five ad variations is the correct setup.
Testing Hooks That Are Not Actually Different
A test that compares “your skin will glow in 30 days” against “see a glow within 30 days” is not a five-hook test — it is a copywriting refinement. Genuine hook type differences mean the underlying mechanism is different: one hook creates pattern interruption, another creates a problem recognition response, another triggers social proof reasoning. If two variants feel similar to a viewer, collapse them into one and create a genuinely different hook type for the freed slot.
Ignoring the Platform Context During Review
Review hook test results in the context of where the ad was actually seen. If your SBV ran against a specific set of search keywords, consider whether the keywords themselves could be confounding performance. A highly competitive keyword set will have lower average CTR due to more options competing for the click. If one variant happened to get more impressions against competitive keywords, its CTR will be artificially suppressed versus a variant that ran more often against lower-competition terms. Check keyword-level data in your campaign reporting before concluding that a hook underperformed due to creative quality alone.
Why Sound Still Matters — Even in a Silent-First Framework
Silent-first design is a priority constraint, not a prohibition. A video designed for muted viewing is not one that should sound bad when unmuted. The subset of shoppers who do tap to activate audio — or who have autoplay-with-sound enabled — will experience your ad with full audio, and that experience should be intentional, not an afterthought.
The practical implication is that your hook test should be reviewed in two modes: sound off (the primary test condition) and sound on (the secondary polish condition). A winning hook variant that has strong visual and text execution should also have coherent, brand-appropriate audio when sound is active. This might mean a brief tonal sound design moment in the first second — not a voiceover, but a satisfying audio cue that reinforces the visual hook rather than replacing it.
Music selection matters more in the body (seconds 4–12) than in the hook window. A track that creates tension or energy in the body reinforces the problem-to-resolution narrative structure. The hook window audio (if any) should not compete with the text or visual for attention — subtle, directional, and brief.
The broader principle: design for silence, enhance with sound. Sound-on viewers should get a richer experience than sound-off viewers, not a fundamentally different one. If the message changes when sound is active — if the voiceover says something that the on-screen text does not capture — you have a silent-first design failure that needs to be corrected before the ad scales.
Building a Hook Testing Culture, Not Just a Hook Testing Process
The five-hook test plan is a process, and processes only produce results if they are actually used consistently. The larger challenge for most advertising teams is not designing the test — it is institutionalizing the discipline to run it before scaling creative, and to learn from the results rather than moving on to the next ad without capturing what was discovered.
What This Requires Organizationally
Hook testing at meaningful cadence — one test cycle every four to six weeks per active SBV program — requires that creative production be structured modularly. If every SBV ad is produced as a single monolithic edit, running five hook variants requires five full production runs. That is expensive and slow. If production is structured so the body content is produced once and hooks are produced as short, separate segments that are assembled onto the body in post, the cost and time per test cycle drops dramatically.
This modular production approach also has a beneficial side effect: it forces cleaner creative thinking. When you must articulate the hook as a discrete, three-second concept separate from the body, you are forced to ask whether the hook actually works independently of the product context. Hooks that only make sense when the product is already on screen are not true hooks — they are transitions. That distinction becomes obvious when you produce the hook segment in isolation.
What to Track Across Cycles
Maintain a hook learnings log with at minimum: the hook type tested, the specific visual and text execution, the hook rate achieved, the outbound CTR achieved, the campaign context (product, keywords, flight dates), and the decision made (kill, iterate, scale). Over six to twelve months of testing, patterns will emerge — hook types that consistently outperform for your product category, visual treatments that have higher stopping power, text formulas that generate stronger CTR — and those patterns become the intellectual property of your creative program.
Teams that do this well do not start from a blank page when briefing new SBV creative. They start from a validated playbook of what has worked, and they use new tests to explore the edges of that playbook rather than re-discovering the center of it from scratch each time.
Conclusion: The First Three Seconds Are the Product
Every second of your SBV ad after the third one is contingent on the first three. The product demo, the social proof sequence, the CTA card — all of it is invisible to any shopper who scrolled before the hook landed. In a silent-first environment where most viewers will never tap for audio, those first three seconds must carry the complete burden of capturing attention and establishing relevance through visuals and text alone.
The five-hook test plan is the most direct method available for identifying which attention mechanism works for your specific product, audience, and competitive context. Pattern interrupt, problem demo, direct benefit, curiosity gap, and social proof are not interchangeable — each speaks to a different psychological trigger, attracts a different viewer profile, and sets up a different expectation for the body content that follows. Testing all five simultaneously against a fixed body gives you a direct comparison of those mechanisms under identical conditions.
The data from a single well-executed five-hook test cycle has value that extends far beyond the current campaign. It tells you something fundamental about how your audience prefers to receive information. That insight compounds across every ad you build afterward — not just SBV, but across all video placements where silent-first, hook-led structure applies.
Run the test. Document the winners. Apply the principles. And when performance degrades — as it inevitably will — run the next generation of the test one level deeper. The compounding effect of that cycle is not a minor efficiency gain. It is the difference between a creative program that learns and one that just spends.
Actionable Takeaways
- Treat the first two to three seconds as the single highest-leverage creative variable in any SBV ad. Design and test it separately from the body.
- Produce your body content once, lock it, and cut five different hook sequences onto the front. Modular production is the only efficient way to run five-variant hook tests consistently.
- Pre-define your decision thresholds before the test launches: kill below 20% hook rate, iterate at 20–30%, scale at 30%+ with CTR above 0.9%.
- Wait for 500 impressions per variant before reviewing any performance data. Early reads are noise, not signal.
- Test all five variants simultaneously, in the same campaign, with equal budget. Any deviation from this introduces confounds that corrupt the comparison.
- Document every test result — hook type, execution specifics, performance numbers, decision made — and build a learnings log that your entire creative team can access and reference.
- Review every hook in silent mode first. If the message does not land with the sound off, the ad is not ready for the Amazon SBV placement.
- Use winning hook types from SBV to brief creative across other paid video channels. The hook mechanism is platform-agnostic even if the execution needs to adapt.