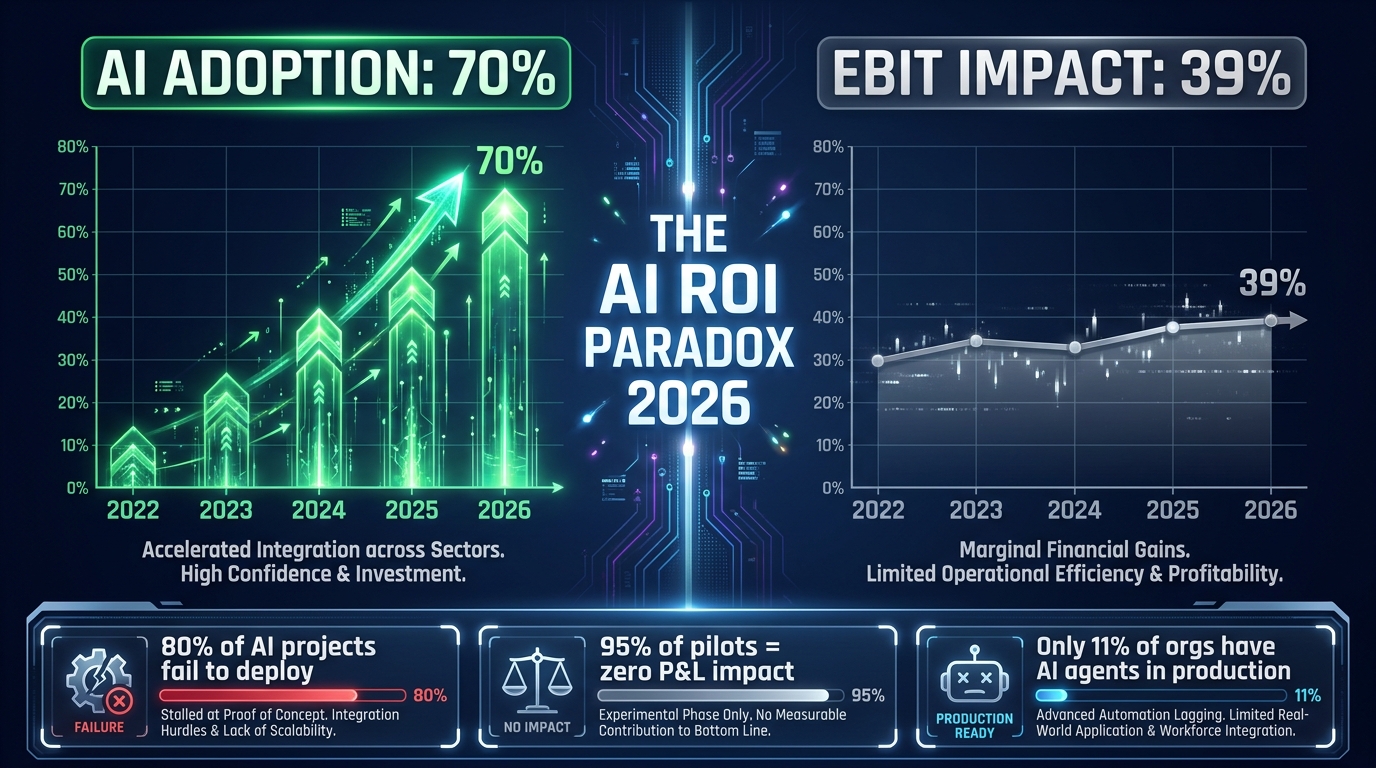
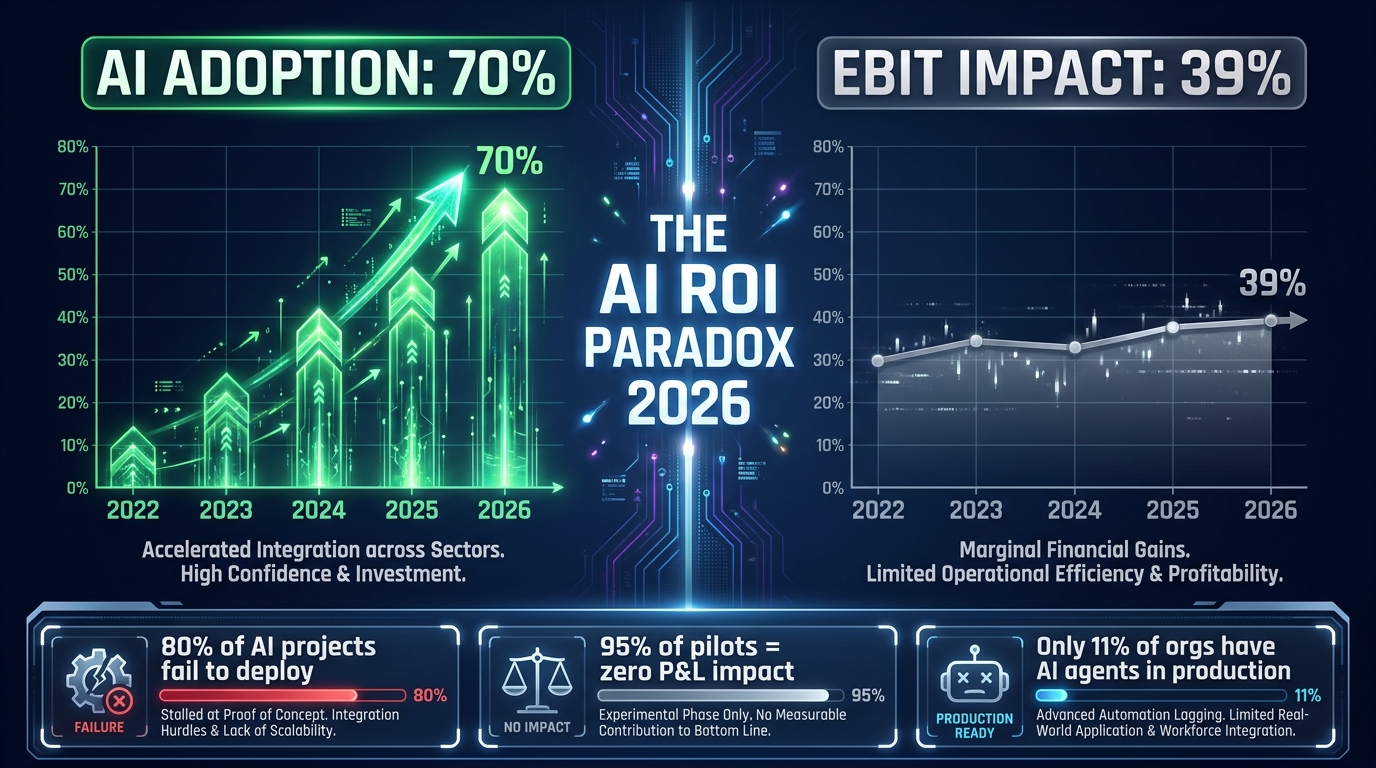
Here is one of the more uncomfortable truths circulating in enterprise boardrooms in 2026: 70% of large organizations have adopted generative AI in some form, yet 79% report no measurable EBIT impact from it. That is not a typo. An AIMG Benchmark Study of 2,048 decision-makers found that after years of pilots, proofs of concept, vendor deployments, and internal builds, most companies cannot point to their bottom line and show AI changed it.
The RAND Corporation analyzed over 2,400 AI initiatives and found that 80% of them fail to deliver intended business value — double the failure rate of conventional IT projects. MIT’s Project NANDA put an even sharper point on it: 95% of generative AI pilots produce zero measurable P&L impact. S&P Global found that 42% of companies abandoned at least one AI initiative in 2025, up from 17% the prior year.
And yet budgets keep growing. Enthusiasm keeps building. Vendors keep promising.
The problem is not the technology. The problem is how organizations define, measure, and sustain value from AI automation. Most businesses treat ROI as a destination — something you calculate once at go-live and file away. The organizations actually generating returns treat ROI as an architecture — a continuous system of measurement, governance, and process intelligence that runs in parallel with every automation they deploy.
This article does not rehash the standard “how to calculate ROI” content that fills vendor white papers. Instead, it dissects the specific measurement failures, cost blindspots, and structural gaps that explain why the adoption-impact paradox exists — and what the companies generating real returns are doing differently.
The Adoption-Impact Paradox: What the Numbers Are Actually Telling You
When McKinsey asked enterprises about their AI deployments, 88% reported regular AI use. Only 39% reported measurable EBIT impact. IBM’s data is equally sobering: 25% of AI initiatives met their ROI targets, and only 16% scaled enterprise-wide. These figures do not come from AI-skeptic organizations — they come from companies that believed in the technology enough to invest substantially in it.
Understanding this gap requires separating three different failure modes that companies routinely conflate:
Failure Mode 1: The Measurement Vacuum
Gartner research found that organizations with structured ROI tracking report 5.2 times higher confidence in their AI investments than those without. Yet fewer than 20% of companies properly track GenAI KPIs, according to McKinsey. Most measure adoption — login rates, feature utilization, user satisfaction scores — rather than business outcomes. These are activity metrics, not impact metrics. You can have 100% adoption of a tool that produces no financial benefit.
The distinction matters enormously. When 81% of enterprises report that AI ROI is difficult to quantify (per Larridin’s research), the honest interpretation is not that ROI is inherently unmeasurable — it is that most companies never built the measurement infrastructure to capture it.
Failure Mode 2: The Pilot-Production Chasm
Across multiple studies, the data converges on a grim number: 88% of AI proofs of concept never make it to production. The average pilot takes 14 months to complete, and only 25% survive to deployment. The rest die somewhere between “this works in a controlled environment” and “this works at scale with real data, real edge cases, and real organizational friction.”
The companies that close this gap do so by treating production readiness as a design criterion from day one — not an afterthought once the pilot succeeds.
Failure Mode 3: The Value Evaporation Problem
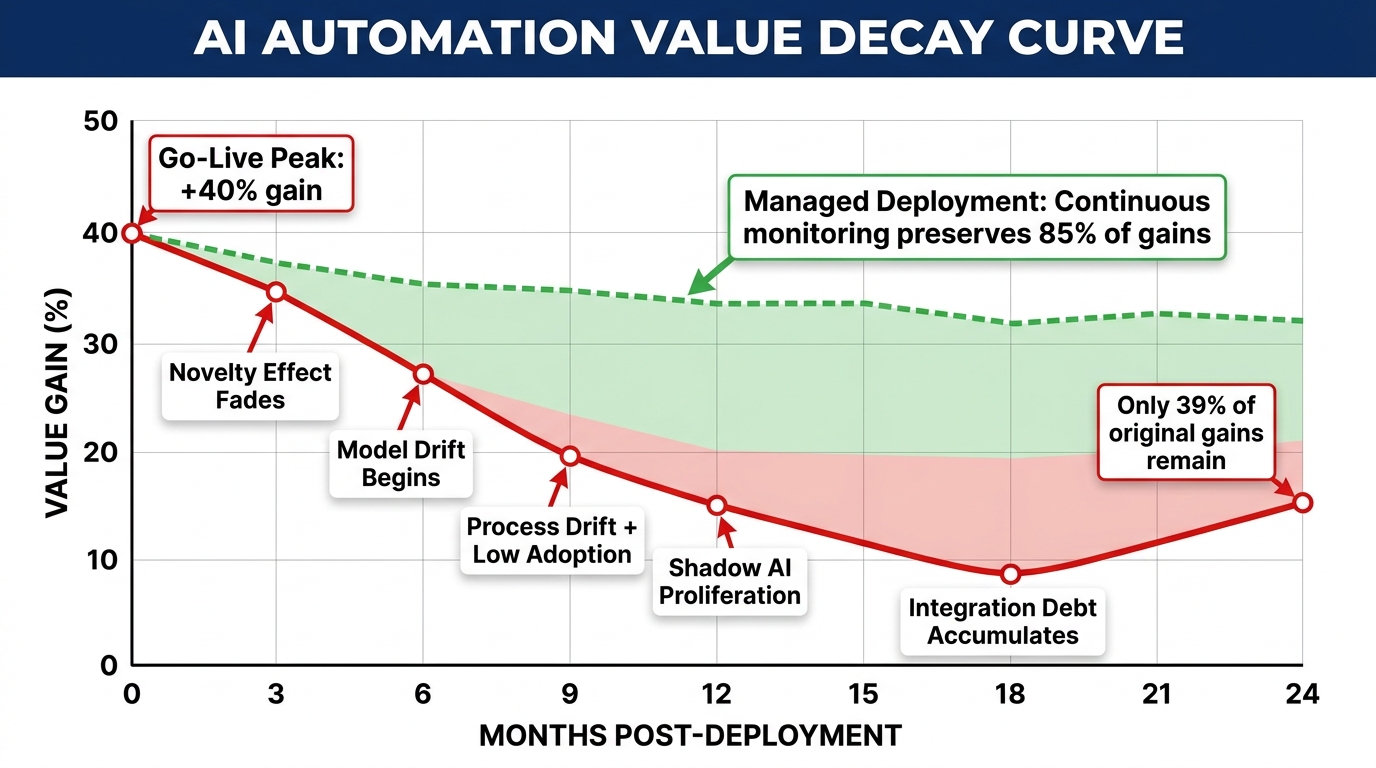
Even among the deployments that reach production, value erodes over time in ways most organizations do not track. Well-functioning Q1 deployments often show economically different profiles by Q4. Model drift, process drift, declining user adoption, shadow AI proliferation, and rising compute costs all chip away at initial gains — silently, without triggering any alerts, because nobody built systems to catch them.
Why the Standard ROI Formula Is Structurally Broken
The conventional ROI formula taught in every MBA program — (Gains − Costs) / Costs × 100 — is not wrong. It is incomplete. Applied to AI automation, it produces dangerously optimistic pre-deployment projections that collapse on contact with operational reality.
The Input Problem
Most ROI calculations use three inputs: licensing cost, implementation cost, and projected time savings. Each of these inputs is systematically underestimated before deployment.
Licensing costs are straightforward on paper but grow with scale. A 50-person pilot becomes a 500-person rollout. Token-based pricing models mean costs scale with usage, not headcount. Hidden overage charges, API call costs, and model upgrade fees accumulate in ways that initial contracts do not surface.
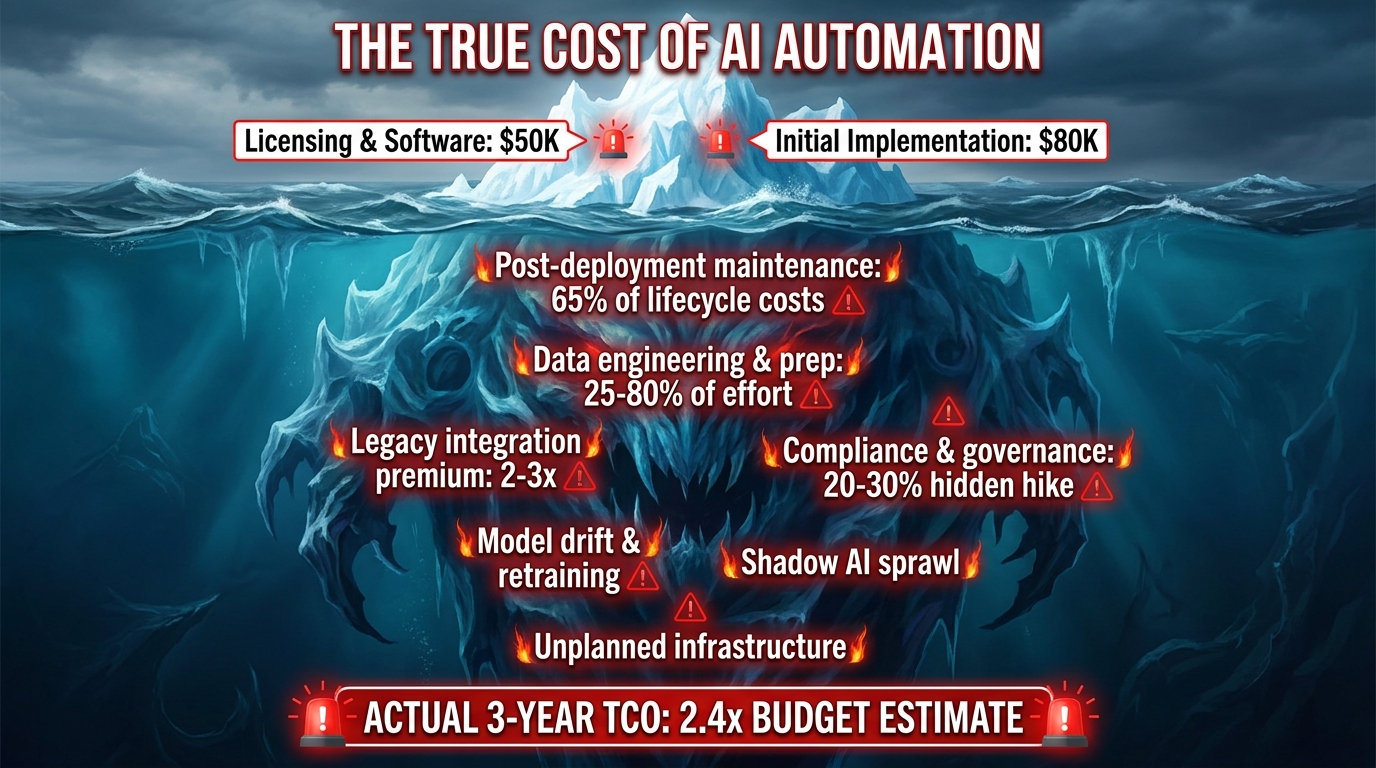
Implementation costs are where the real surprises live. Enterprise AI budget estimates are consistently undershot by 40-60%, according to Hypersense’s 2026 TCO analysis. A project scoped at €158,000 realistically costs €368,000 over three years once integration, data engineering, change management, and governance overhead are included. The 73% of enterprises that exceed their initial AI budgets do so by an average of 2.4x, generating an average $2.3 million in unplanned expenses per program.
The Output Problem
On the gains side, the formula typically captures only first-order time savings: hours saved × hourly cost. This misses quality improvements, error reduction (and the downstream cost of errors avoided), revenue acceleration effects, capacity reallocation benefits, and risk reduction value. It also overstates gains by assuming that time saved automatically converts to value — when in reality, reclaimed hours only become productive if they are redirected to higher-value work.
A customer service agent who resolves tickets 15% faster is not automatically generating 15% more revenue. Unless management actively reallocates that capacity, the gain lives on paper but not on the income statement.
The True Cost Architecture: TCO vs. What You Budgeted
Total Cost of Ownership for AI automation has a unique characteristic that separates it from conventional software: post-deployment costs dominate the lifecycle. While traditional enterprise software stabilizes after implementation, AI systems generate continuous cost obligations that grow with usage, data volume, and organizational complexity.
The 65% Rule: What Happens After Go-Live
Post-deployment maintenance represents approximately 65% of AI automation lifecycle costs, according to analysis from Keyhole Software and Hypersense. This includes model performance monitoring, retraining cycles, compliance updates, regression testing when upstream systems change, and the user support infrastructure required to maintain adoption. Most organizations budget for none of this explicitly — they assume that once the system is live, the only ongoing cost is the license fee.
The reality is that a model trained on your Q1 data may behave significantly differently by Q3 as customer behavior patterns, product catalogs, regulatory requirements, and business processes shift. Each shift requires either retraining (15-25% additional compute overhead per cycle, per SoftwareSeni’s analysis) or manual intervention to catch the cases the model no longer handles correctly.
Data Engineering: The Chronically Underestimated Cost
Data preparation and engineering consume 25% to 80% of total project effort and spend, depending on the state of the organization’s data infrastructure. In enterprises with well-structured, accessible data pipelines, this figure lands in the lower range. In organizations with fragmented legacy systems, siloed databases, inconsistent data standards, and manual data entry dependencies — which describes the majority of mid-to-large enterprises — it skews toward the upper end.
The consequence: organizations that budget $500,000 for an AI automation initiative and expect $200,000 of that to cover data work frequently find the data work consuming $350,000 before a single model goes live. This is not an edge case. Only 19% of enterprises report full data readiness for AI deployment, limiting 75% to deploying one to three AI use cases rather than the portfolio-level automation programs their ROI projections assume.
Legacy Integration: The 2-3x Premium
Connecting AI automation systems to legacy enterprise infrastructure — ERP systems, CRM platforms, proprietary databases, and decades-old transaction processing systems — commands a 2-3x cost premium over greenfield integration. This premium exists because legacy APIs were not designed for the volume, speed, or data format requirements of AI systems; because documentation is often incomplete or inaccurate; and because testing requirements expand dramatically when existing business-critical systems are touched.
Organizations consistently underestimate this figure, in part because vendor demos invariably show clean integration with modern SaaS platforms rather than the 1990s-era systems that actually run enterprise operations.
The Value Decay Problem: How Gains Erode After Go-Live
One of the least-discussed dynamics in AI automation is what happens to gains over time when organizations do not actively manage them. The pattern is consistent enough across enough deployments that it deserves a name: value decay.
The Novelty Effect
Initial productivity gains from AI tools often include a novelty premium. Users invest extra attention in learning the system, exploring its capabilities, and finding ways to make it work for their specific tasks. This investment period generates above-baseline gains that are not sustainable once the novelty wears off. By month three to four post-deployment, usage patterns typically settle into a lower steady-state that reflects genuine workflow integration rather than enthusiastic exploration.
Organizations that measure ROI at the 30-day mark and extrapolate annually are capturing novelty-inflated numbers, not sustainable operational value.
Model Drift and Process Drift
AI models degrade when the real-world data they process diverges from the training data they learned from. This is model drift — and it is inevitable. The question is how quickly it happens and how quickly organizations detect and correct it.
Process drift is a parallel phenomenon on the human side: the business processes the AI was designed to support change over time, through product updates, policy changes, regulatory requirements, and organizational restructuring. An AI automation built around a specific workflow may find that workflow has been modified without any corresponding update to the automation — generating incorrect outputs, missed cases, or silent errors that accumulate undetected.
McKinsey’s finding that 88% of organizations use AI but only 39% see EBIT impact is partly explained by these two forms of drift operating simultaneously on deployments that were never designed to be monitored for them.
Adoption Decay and Shadow AI
The Flexera 2026 AI Pulse Report documents a consistent pattern: initial adoption rates for AI automation tools decline 15-30% in the 6-12 months post-deployment unless actively supported. Users who struggled with the initial learning curve revert to manual workflows. Managers who saw the tool as a solution to a problem that has since evolved stop enforcing its use. New employees join who were never properly onboarded to the system.
Simultaneously, shadow AI proliferates — employees who are not satisfied with the officially deployed tool adopt unofficial AI tools that solve their specific problem. This creates fragmented, ungoverned AI usage that generates no measured benefit for the organization while introducing security and compliance risks.
Process Selection Science: Which Workflows Actually Pay Back
Given how widely ROI varies across AI automation deployments, process selection is one of the highest-leverage decisions an organization makes before writing a single line of code or signing a single contract. The research identifies four filters that reliably separate high-return automation candidates from low-return ones.
Filter 1: Volume × Cost per Error
The most reliable predictor of strong AI automation ROI is the combination of high transaction volume and meaningful cost per error or per unit. Customer support ticket handling, invoice processing, and document classification score high on this filter — they happen thousands of times per day, and each instance of suboptimal handling has a quantifiable cost in labor time or downstream errors.
Processes that happen infrequently, even if individually complex, rarely generate compelling ROI because the absolute value of improvement is limited regardless of the percentage gain.
Filter 2: Process Boundary Clarity
Automation succeeds where inputs and outputs are well-defined. Processes with clear triggers, structured data inputs, and verifiable outputs automate predictably. Processes that require judgment about ambiguous inputs, contextual reasoning, or stakeholder negotiation resist automation and generate unpredictable output quality.
This is why coding assistance (55.8% faster task completion, per Alice Labs’ 2026 benchmark) and customer support routing (15% productivity gain) outperform more open-ended knowledge work automation in virtually every study. The task boundaries are clear enough to measure, monitor, and trust.
Filter 3: Data Availability and Quality
Only 19% of enterprises have the data infrastructure ready for AI deployment. Before selecting a process for automation, the honest question is: does training-quality data exist for this process, and can it be accessed, labeled, and maintained without heroic effort? Processes with rich historical data and structured records advance to production faster and generate ROI sooner. Processes that require extensive data collection, cleaning, or labeling consume budget before any automation benefit accumulates.
Filter 4: Scalability Beyond the Pilot
Harmony.ai’s 2026 decision framework adds a critical filter: is the process scalable beyond the pilot population? A workflow that only exists in one department, or that depends on the specific behavior of a small team, generates ROI only at the pilot scale. Prioritizing processes that run across multiple departments, business units, or customer segments multiplies the return on the implementation investment without proportionally multiplying the cost.
High-confidence automation candidates identified across the evidence base include: customer support (15% productivity gain), professional document processing (40% faster throughput), software development assistance (55.8% faster coding, 26% more tasks completed), HR self-service (IBM achieved 40% HR cost reduction), and finance close operations (35-50% cycle time acceleration in finance-sector deployments).
The Layered ROI Measurement Framework
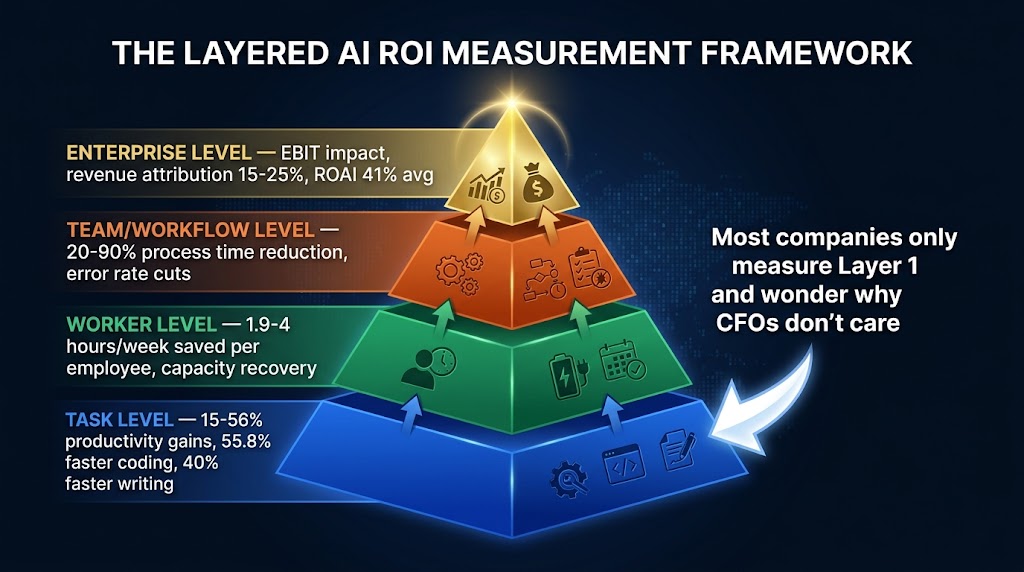
The organizations generating real, sustained returns from AI automation share a measurement architecture that operates at four distinct levels. Alice Labs’ 2026 benchmark report, which analyzed 47 public metrics from studies and surveys, articulates this structure more clearly than any vendor framework: ROI is not a single number — it is a layered stack of metrics that must be tracked simultaneously at different organizational levels.
Layer 1: Task-Level Productivity
This is the layer most organizations measure, and measuring it is genuinely important. Task-level metrics include: time per task completion (before and after automation), accuracy rates, throughput volume, and process completion rates. These are the 15-56% productivity gains that appear in headline benchmarks.
The mistake is treating Layer 1 as sufficient. Task-level productivity gains do not automatically translate to worker-level, team-level, or enterprise-level value. They are a necessary precondition, not a proof of business impact.
Baseline measurement is critical here. Organizations that deploy AI without establishing pre-deployment baselines cannot measure Layer 1 gains at all — they end up estimating, which CFOs correctly treat as guesswork.
Layer 2: Worker-Level Capacity
Layer 2 asks: what are workers doing with the time and cognitive capacity that automation returns to them? The answer to this question determines whether task-level gains generate real financial value or simply disappear.
Research from Microsoft’s Copilot deployments and similar enterprise tools consistently shows 1.9 to 4.0 hours saved per worker per week. The organizations generating ROI from this figure are the ones that deliberately redirect that capacity — into higher-value customer interactions, complex problem-solving, creative work, or volume scaling that generates additional revenue.
The organizations not generating ROI are the ones that reclaim the time without directing it anywhere, resulting in a slightly more relaxed workforce but no EBIT impact.
Layer 3: Team and Workflow Economics
Layer 3 measures the end-to-end workflow — not individual tasks or individual workers, but the complete process from trigger to output. This is where 20-90% process time reduction benchmarks live, where error rate reductions show up as downstream cost savings, and where SLA improvements translate to customer satisfaction and retention effects.
Finance close operations that accelerate from 12 days to 7 days generate measurable effects on days-sales-outstanding, working capital, and auditor fees. Customer support workflows that resolve 84% of queries without human escalation generate measurable effects on support headcount requirements and customer churn. These are Layer 3 metrics, and they are the ones that start to get CFO attention.
Layer 4: Enterprise-Level Financial Impact
Layer 4 is where EBIT impact lives — AI revenue attribution (averaging 15-25% in high-performing deployments, per SecondTalent research), Return on AI Investment (ROAI, averaging 41% for the overall population and 171% for the highest performers), and total cost avoidance ratios (2.7:1 in well-managed programs).
Reaching Layer 4 requires that Layers 1-3 are not just measured but actively managed. The 79% of enterprises reporting no EBIT impact are stalled somewhere between Layer 1 and Layer 3, measuring task productivity while the financial impact dissipates in the space between measurement points.
Industry Payback Benchmarks: What the Data Actually Shows
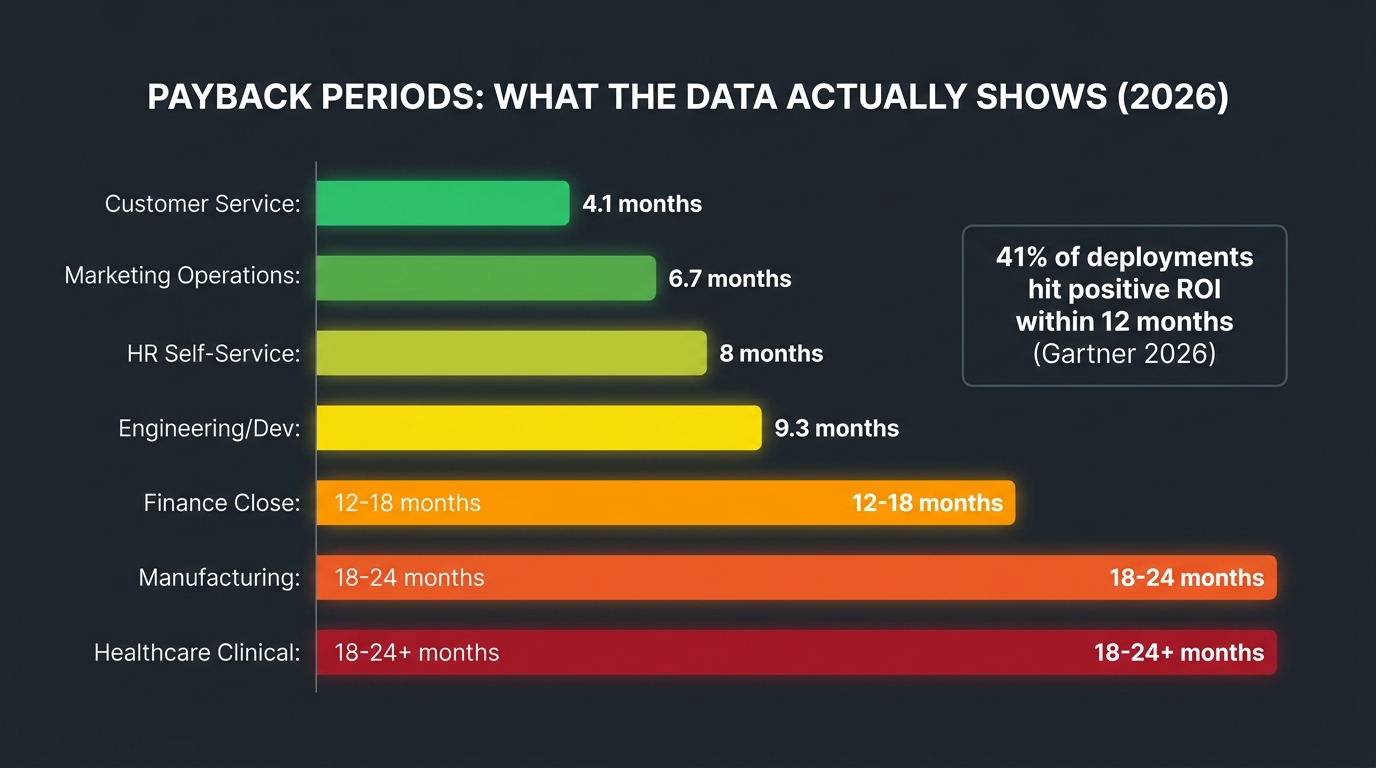
Bain’s 2026 Agentic AI Benchmark study (n=1,840) provides the clearest industry-level payback data available. Gartner independently confirms that 41% of AI deployments now hit positive ROI within 12 months — up from 23% in 2024 — suggesting the field is genuinely maturing in execution quality.
Customer Service and Support
Median payback period: 4.1 months. This is consistently the fastest-returning AI automation category across multiple studies. The reasons are structural: high transaction volume, clear task boundaries, measurable output quality, and direct linkage between automation quality and customer satisfaction scores that are already tracked.
TELUS’s deployment serves as a representative case: over 500,000 hours saved and $90 million in documented benefits. ServiceNow’s internal deployment saved 410,000 hours and generated $17.7 million in cost avoidance. These are not projections — they are audited operational figures from companies that built the measurement infrastructure to capture them.
Marketing Operations
Median payback period: 6.7 months. Content generation, campaign optimization, personalization at scale, and research synthesis all represent processes with clear before-and-after comparisons and direct revenue linkage through campaign performance metrics. The caveat: output quality measurement requires human review infrastructure that most teams underinvest in.
Engineering and Development
Median payback period: 9.3 months. The 55.8% faster coding benchmark from Alice Labs is consistent across multiple independent studies, but the payback period is longer than customer service because implementation costs are higher, the scope of deployment is typically larger, and the value capture mechanism (faster product delivery, reduced defect rates, smaller team requirements) takes longer to manifest in financial statements.
Finance Operations
Payback period: 12-18 months. Finance-sector deployments show 35-50% process acceleration in accounts payable, invoice processing, financial close, and compliance reporting. IBM’s HR automation case achieved 40% HR cost reduction. The longer payback timeline reflects heavier compliance requirements, more complex integration with existing financial systems, and higher data quality standards that extend implementation timelines.
Manufacturing
Payback period: 18-24 months. Predictive maintenance, quality control automation, and supply chain optimization generate 30-40% cost reductions in successful deployments, but the capital requirements, integration complexity, and safety validation requirements extend the investment horizon substantially.
Healthcare Clinical
Payback period: 18-24+ months, with bottom-quartile deployments still pre-payback at month 24, according to Bain’s benchmark data. Clinical AI automation faces the highest regulatory burden, the most complex data standards (interoperability between EHR systems remains a persistent challenge), and the greatest institutional risk tolerance for automation — all of which extend the timeline to positive returns.
The Portfolio Approach: Stacking AI Automations for Compounding Returns
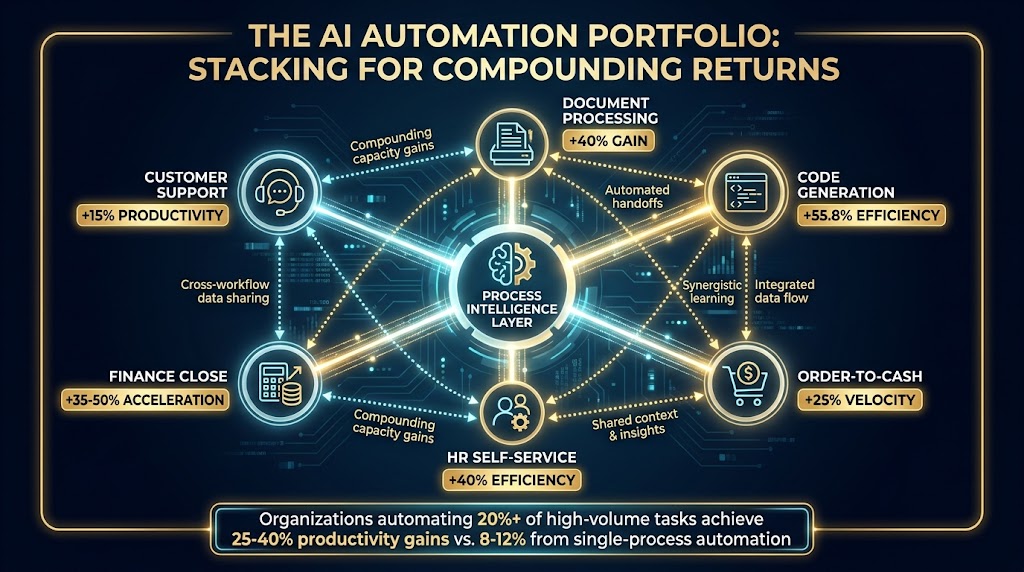
Gartner’s research on simultaneous broad automation reveals a counterintuitive finding: organizations that deploy AI automation across many processes simultaneously without strategic prioritization achieve only 8-12% productivity gains — less than half the gains of organizations that automate 20% of their highest-volume tasks strategically. Deloitte’s figure is 25-40% for the strategic approach.
The explanation is structural. Broad, simultaneous automation fragments attention, creates competing integration demands, strains change management capacity, and prevents the deep measurement infrastructure work required to capture value at each layer. Strategic portfolio construction is not about doing less — it is about sequencing and connecting automations so they build on each other.
Why Sequencing Matters
The compounding returns in AI automation portfolios come from three mechanisms that only operate when deployments are sequenced intelligently:
Data network effects: Each automation deployment generates structured operational data. A customer support automation creates labeled interaction data. A document processing automation creates structured content data. Subsequent automations that can use this data as input are cheaper to build, faster to train, and more accurate from day one because the data infrastructure already exists.
Integration reuse: The expensive work of connecting AI systems to legacy infrastructure, establishing data pipelines, and building monitoring frameworks can be amortized across multiple automations if they share architectural foundations. Organizations that build a reusable integration layer for their first automation spend 40-60% less on the second and third.
Organizational capability accumulation: The humans managing AI automation — process owners, data engineers, model monitors, governance reviewers — develop skills with each deployment that accelerate subsequent deployments. The first automation program takes the longest. Each subsequent one benefits from institutional knowledge that does not appear in any ROI calculation but is real and valuable.
Building the Automation Portfolio
The research-backed approach is to begin with one high-volume, clearly bounded, data-rich process that generates quick payback (customer service, document processing, or HR self-service, depending on your industry). Use that deployment to build the measurement infrastructure, governance framework, and organizational capabilities that all subsequent deployments will use. Then expand to adjacent processes that share data inputs or integration architecture.
This approach treats AI automation as a capability accumulation program, not a series of independent projects. The difference in long-term ROI is substantial.
Building the Measurement Infrastructure Before You Deploy
The single most impactful operational decision in AI automation ROI is establishing comprehensive baselines before any tool goes live. This is not glamorous work. It does not generate press releases or executive presentations. But the organizations that skip it are the ones filling the “79% with no measurable EBIT impact” statistic.
What Baselines Must Cover
For each process targeted for automation, pre-deployment measurement should capture: current cycle time (end-to-end, not just the specific task being automated), error rates and downstream cost of errors, labor cost per transaction, volume by time period, SLA performance rates, and downstream business outcomes (customer satisfaction, revenue per interaction, compliance incident rate — whatever the relevant outcome metric is for that process).
This baseline data serves three functions. It makes ROI measurement possible. It identifies hidden bottlenecks that automation alone will not solve (and that will limit ROI if not addressed). And it gives process owners the ability to detect value decay early, before it has compounded across 12 months of unmonitored drift.
Continuous Monitoring Architecture
The Flexera 2026 AI Pulse Report identifies a consistent pattern in high-ROI AI programs: they treat continuous monitoring as a first-class operational requirement, not an optional add-on. This means model performance dashboards that alert on output quality degradation, usage analytics that flag declining adoption before it becomes adoption collapse, cost tracking that surfaces spending anomalies before they breach budgets, and quarterly structured reviews that compare current performance against baseline and original ROI projections.
Organizations that build this monitoring architecture from deployment day one spend approximately 15-20% more on initial setup. They recoup that investment within the first year by catching and correcting performance degradation that would otherwise have gone undetected — and by having the evidence they need to secure continued investment from finance and leadership.
From Pilot to Production: Closing the Value Realization Gap
The 88% pilot-to-production failure rate is not primarily a technical failure — it is an organizational failure. The AIMG Benchmark Study’s analysis of 2,048 decision-makers found that the top three barriers to AI value realization were insufficient talent and skills (rated 4.65/5.0), model governance and transparency (4.55/5.0), and data quality and availability (4.45/5.0). Technology performance ranked lower than all three.
The Skills Gap Is Real and Quantifiable
Only 19% of enterprises have the technical talent to fully operationalize AI automation programs. The gap is not in AI research or model building — it is in the intersection of process knowledge and AI implementation capability. The people who understand business processes deeply enough to redesign them around AI capabilities are often not the same people who know how to build and manage AI systems. Organizations that bridge this gap — through targeted hiring, training programs, or external partnerships — progress from pilot to production at significantly higher rates.
Governance as an Enabler, Not a Bottleneck
The 42% of companies that abandoned AI initiatives did so in many cases because governance requirements emerged after deployment and were treated as roadblocks to an already-live system rather than as designed-in operational requirements. Retrofitting governance onto deployed AI systems is expensive and disruptive. Building governance frameworks into the deployment architecture from the start — clear ownership of model performance, defined escalation procedures for edge cases, audit trails that satisfy compliance requirements, and regular review cycles — generates better outcomes and lower total cost.
Compliance requirements add approximately 20-30% to governance overhead in regulated industries. This is not avoidable. But it is plannable — and organizations that plan for it avoid the emergency remediation costs that compliance surprises generate.
The Governance Layer Nobody Budgets For
In the rush to show results quickly, governance consistently gets deprioritized. It rarely shows up as a line item in initial AI automation budgets. It rarely has a dedicated owner before deployment. And it almost never has performance metrics of its own that leadership tracks.
This is financially significant. Beyond compliance costs, ungoverned AI automation generates several categories of quantifiable financial risk that organizations systematically fail to budget for:
Model Quality Liability
When AI automation produces incorrect outputs — wrong invoice amounts, misclassified customer inquiries, inaccurate document summaries — those errors have downstream costs. In customer-facing applications, they affect NPS scores and retention rates. In financial processes, they generate reconciliation work and compliance risk. In healthcare and legal applications, they can generate regulatory liability. A governance framework that detects output quality issues early contains these costs. Without it, errors accumulate and compound before anyone catches them.
Data Governance and Privacy Risk
AI automation systems are data-intensive by nature. They ingest, process, and in some cases store significant volumes of operational data. Without clear data governance policies — defining what data the AI system can access, how long it retains inputs, what logging occurs, and how personal data is handled — organizations create GDPR, CCPA, and sector-specific compliance exposure that can generate regulatory fines substantially larger than the ROI the automation was designed to generate.
Vendor Lock-In and Portability Risk
CXToday’s 2026 analysis identifies vendor lock-in as an underappreciated AI risk. Organizations that build critical workflows around proprietary AI platforms with no portability strategy face switching costs — in migration effort, data reformatting, retraining on new architectures, and business continuity during transitions — that can absorb years of accumulated ROI if a vendor relationship needs to change. A governance framework that includes an annual lock-in assessment and maintains data portability standards from deployment day one significantly reduces this long-term financial exposure.
The ROI Reckoning: An Honest Measurement Checklist
Based on the research and case evidence assembled here, the organizations generating real, sustained, defensible ROI from AI process automation share a common set of operational disciplines that distinguish them from the majority seeing minimal impact. The gap is not in the quality of AI they deploy — it is in the rigor with which they measure, manage, and sustain value from what they deploy.
Before Deployment
- Establish comprehensive process baselines covering cycle time, error rates, labor cost per transaction, volume, and downstream outcome metrics — before any AI tool is introduced.
- Pressure-test the TCO estimate by adding 40-60% to the initial vendor quote to account for data engineering, legacy integration, governance, and post-deployment maintenance.
- Validate process selection against the four filters: volume × error cost, process boundary clarity, data availability, and cross-functional scalability.
- Design the monitoring architecture before writing deployment code — including model performance alerts, usage analytics, cost tracking, and quarterly review cadences.
- Define capacity reallocation plans for the hours automation will return to workers, so that Layer 2 ROI is captured rather than evaporating into unfocused time.
At and After Deployment
- Measure ROI at all four layers from week one: task productivity, worker capacity, workflow economics, and enterprise financial impact.
- Set 30/60/90-day ROI checkpoints with explicit triggers for intervention if performance diverges from baseline projections.
- Track adoption rates as a leading indicator of value decay — declining adoption in months 3-6 is the earliest warning sign that gains are at risk.
- Budget explicitly for post-deployment maintenance at 65% of lifecycle costs, not as an afterthought but as a first-class budget line.
- Assess and manage vendor lock-in risk annually, maintaining data portability as a non-negotiable design requirement.
For Portfolio Construction
- Sequence automations to build shared infrastructure — data pipelines, integration layers, monitoring frameworks — that reduce per-deployment costs over time.
- Target 20% of highest-volume processes for automation before expanding broadly, capturing the Deloitte-documented 25-40% productivity gain threshold that scattered deployment does not reach.
- Treat governance as a portfolio-level function, not a per-project checkbox, so that standards compound across deployments rather than being recreated from scratch each time.
Conclusion
The AI adoption-impact paradox — 70% adoption, 39% EBIT impact — is not a technology problem. The technology works. The benchmarks prove it: 55.8% faster coding, 15% customer support productivity gains, $90 million in documented benefits at TELUS, 410,000 hours saved at ServiceNow. These are not marketing claims; they are audited outcomes from organizations that built the infrastructure to capture them.
The problem is measurement architecture. Most organizations treat ROI as a calculation made once at the beginning of an AI project and filed in a business case document that nobody reviews after go-live. The organizations generating real returns treat ROI as an ongoing operational discipline — a continuous measurement system that operates at four layers simultaneously, tracks value decay and catches it early, applies honest TCO accounting that includes the 65% post-deployment costs that vendor quotes omit, and sequences automations to compound returns rather than fragment attention.
The financial stakes are significant. Enterprise AI budgets that underestimate TCO by 40-60% and deploy without governance or measurement frameworks generate the statistics that fill industry reports: 95% of pilots with zero P&L impact, 80% of projects failing to deliver intended value, 42% of companies abandoning initiatives entirely. The average sunk cost from failed AI programs exceeds $150,000 per initiative before abandonment.
The alternative is not a slower or more cautious approach to AI automation — it is a more rigorous one. Establish baselines. Build monitoring infrastructure. Apply honest TCO accounting. Select processes using evidence-based filters. Measure at all four layers. Manage value decay actively. Build portfolios with compounding architecture.
The gap between the 79% and the 21% is not closed by deploying better AI. It is closed by deploying AI with better measurement.