Tag: SBV Creative Testing

  • The SBV Creative Testing System That Survives Review — and Keeps Winning After It

    The SBV Creative Testing System That Survives Review — and Keeps Winning After It

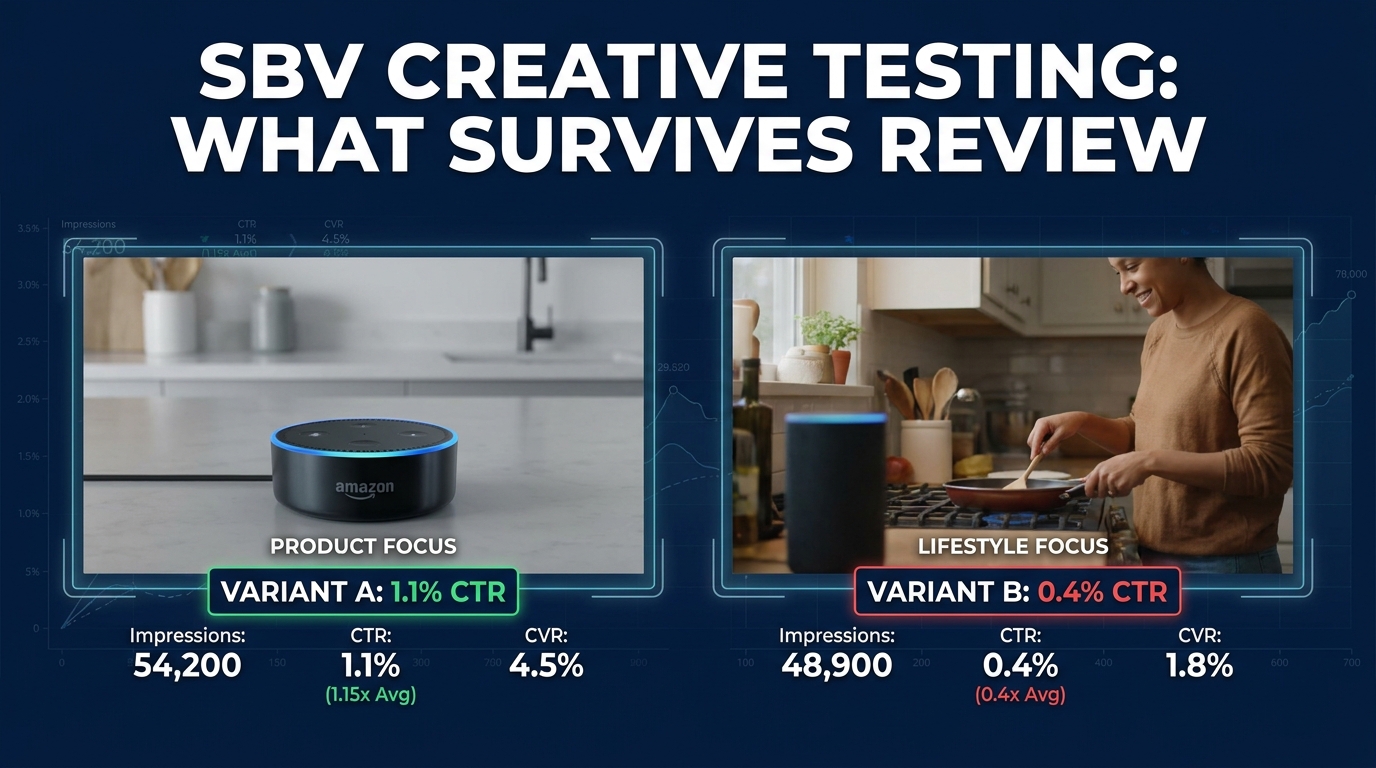
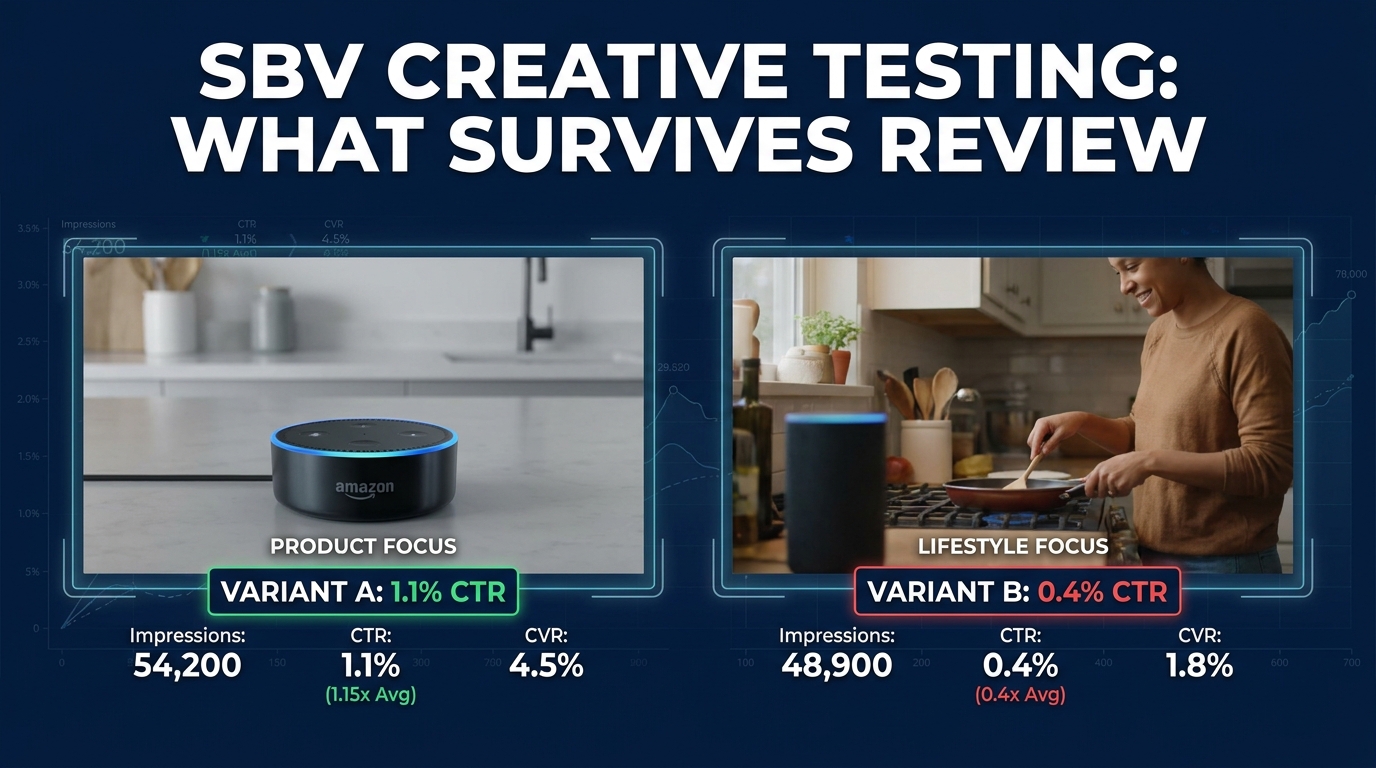
    Amazon SBV creative testing split-screen showing Variant A at 1.1% CTR vs Variant B at 0.4% CTR with test metrics overlay

    Most Sponsored Brands Video (SBV) advice gives you a list of things to test. Hook vs. no hook. Product-first vs. lifestyle. CTA wording A vs. CTA wording B. And that advice isn’t wrong — those variables genuinely matter. But it misses the part that actually kills most SBV testing programs before they generate a single useful data point.

    The problem isn’t knowing what to test. It’s that Amazon’s review process, ad structure choices, and creative fatigue timelines interact in ways that quietly invalidate your tests, delay your launches, and turn your “winner” data into noise. You run a test, a creative gets rejected three days before your peak traffic window, your variants run at different times, your campaign structure comingles data — and at the end of four weeks you have numbers you can’t actually trust.

    This post is about building a testing system that doesn’t have those failure points. One that produces creatives that pass review on the first submission. One that generates data you can actually act on. And one that extends the working life of your winners instead of watching them decay after two weeks with no plan for what comes next.

    The phrase “survives review” means two things here: getting through Amazon’s moderation process intact, and producing creative that keeps performing long enough to tell you something meaningful. Both matter. Neither works without the other.

    Why SBV Is the Most Punishing Ad Format to Test On Amazon

    Before getting into the system, it’s worth being clear about what makes SBV uniquely difficult to test compared to other Amazon ad formats.

    Video Has the Highest Rejection Rate of Any Amazon Ad Format

    Sponsored Products text ads and even standard Sponsored Brands static creatives go through relatively quick automated checks. Video doesn’t. Because you can upload any video you want, Amazon applies both automated checks and a manual human review to every SBV submission. Agencies and tools providers that track rejection rates consistently report that video has one of the highest creative rejection and flagging rates of any Amazon ad format.

    The consequences of a rejection aren’t just a delayed launch — they’re a delayed test. If you’re planning a head-to-head creative test over a two-to-three week window, a single rejection on one variant can mean that variant spends three to five days in the resubmission queue while the other is already accumulating impressions. You’ve immediately introduced a time-of-day, day-of-week, and inventory availability bias into your test before a single impression has been matched to a search term.

    SBV Data Is Messier Than It Looks

    Amazon’s reporting for Sponsored Brands Video gives you impression counts, click-through rates, conversions, and video view metrics. What it doesn’t give you is easy creative-level comparison in a campaign where multiple creatives are live. Most advertisers running standard campaigns with multiple creatives in a single ad group end up with blended data — numbers that reflect some mixture of all the creatives running, without clean attribution to any individual one.

    Add to that the fact that SBV ads serve in a very specific placement — primarily in the search results page below the fold, on mobile and desktop — and any variation in keyword bid competitiveness or dayparting between your test windows creates noise that can easily dwarf the actual effect of the creative variable you’re trying to measure.

    Creative Fatigue Is Faster Than Most Sellers Expect

    Across advertiser data and Amazon’s own guidance, SBV creatives typically reach peak performance during weeks one through four of active delivery. After that, fatigue begins — meaning the same audience, shown the same video repeatedly, stops clicking at the same rate. For high-spend accounts or smaller audience segments, meaningful fatigue can emerge in as few as ten to fourteen days.

    The result: if your testing window and your fatigue window are the same window, you might be measuring performance decay rather than creative quality. Your “losing” creative might have just been the one that went live first.

    The Review Process Most Advertisers Misread (And What It’s Actually Checking)
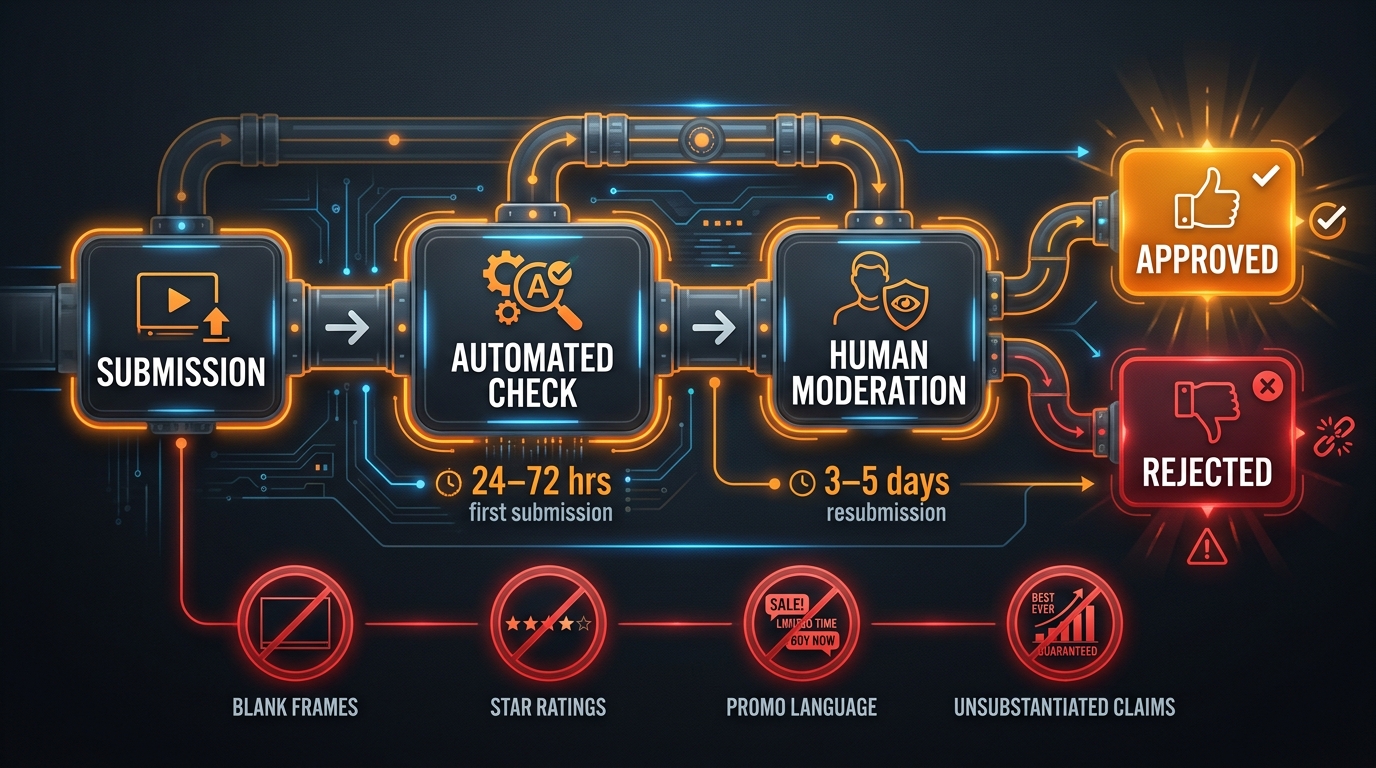
    Amazon SBV review process pipeline diagram showing submission, automated check, human moderation stages with 24-72 hour timeline and common rejection triggers

    Amazon’s SBV review process runs in two layers, and misunderstanding where rejections actually happen leads most advertisers to fix the wrong things when they get rejected.

    Layer One: Automated Technical Checks

    The first pass is automated and checks hard technical specs. These are binary — pass or fail, no gray area. The required specs are well-documented: video duration must be between 6 and 45 seconds (Amazon strongly recommends 20 seconds or under for performance reasons), dimensions must be 1280×720, 1920×1080, or 3840×2160 pixels at a 16:9 aspect ratio only, file format must be MP4 or MOV, and file size cannot exceed 500 MB. Square pixels only. No letterboxing or pillarboxing.

    The automated layer also checks for common video quality issues: blank or black frames at the start or end of the video, missing or corrupt audio tracks, and insufficient video quality or resolution. These failures come back quickly and with reasonably clear rejection reasons.

    Layer Two: Human Moderation

    The second layer is where most experienced advertisers still get caught, and where the more ambiguous rejections live. A human reviewer checks the creative against Amazon’s content and claims policies. This is where the nuanced violations appear.

    The most common policy-level rejection triggers in SBV include:

    • Customer reviews or star ratings: Showing any customer review text, star rating imagery, or aggregated review scores in your video is explicitly prohibited. This applies even if the stars are graphical rather than screenshots.
    • Amazon branding and references: You cannot reference Amazon, Amazon Prime, or any Amazon-specific features in your video creative. This includes phrases like “available on Amazon” or Prime-adjacent language.
    • Promotional and pricing language: Phrases referencing deals, discounts, savings, limited-time offers, or specific price points are disallowed. This catches a lot of creatives that were built for paid social and repurposed for SBV without modification.
    • Unsubstantiated claims: Any performance, efficacy, or comparative claim that isn’t directly substantiated must be removed. “The best [category product] on the market” is a textbook rejection. “Dermatologist-tested” without a qualifying disclosure visible on screen is another.
    • External URLs, contact information, and private data: No off-Amazon links or URLs of any kind in the video creative.
    • Restricted CTAs: Certain call-to-action phrases are disallowed, particularly those that create artificial urgency (“Buy now before it’s gone”) or that imply an Amazon-specific action (“Click here to buy on Amazon”).
    • Distracting visual elements: Flashing, blinking, rapidly pulsating imagery, or simulated interactivity (making the ad appear to be a clickable UI element) will fail review.

    Why Resubmissions Take Longer

    First-time submissions typically clear review within 24 to 72 hours. Resubmissions after a rejection increasingly take 3 to 5 days in 2026, likely because resubmitted creatives are flagged for closer scrutiny. This asymmetry is important for your test planning: a rejection isn’t just a one-day setback. If you’re testing around a seasonality window — back-to-school, Prime Day prep, Q4 — a resubmission queue that runs into a weekend can cost you the entire relevant traffic window.

    The practical implication: build and submit test creatives at least 10 days before any window you want to test in. Not 3 days. Not 5 days. Ten, to absorb one rejection cycle without losing the window entirely.

    The Compliance Architecture: Building Creatives That Clear Review First Time

    Getting to zero rejections isn’t about being conservative with your creative — it’s about separating the “compliance layer” from the “creative layer” in how you build videos.

    The Compliance Script Review

    Before anything goes to production — before any footage is shot or any motion graphics are built — the script and visual storyboard should go through a compliance check against Amazon’s policy list. This is a five-minute process that catches probably 80% of the issues that would otherwise come back as rejections.

    The questions to answer at script stage:

    • Does any line of on-screen text or spoken audio reference Amazon, Prime, or any Amazon feature?
    • Does any line reference a price, discount, sale, or time-limited availability?
    • Are any claims made that require substantiation not visible in the video? (If yes, can the substantiation be added on screen, or should the claim be rephrased?)
    • Does the script include any customer review language, star ratings, or aggregated sentiment?
    • Does any CTA use language that implies Amazon-specific interaction?

    Run this against the storyboard as well, not just the audio script — visual elements get caught by human reviewers even when audio is clean.

    The Technical Pre-Submission Checklist

    Once the video is rendered, run through this before every upload:

    • Duration confirmed between 6–45 seconds. If over 20 seconds, verify there’s a strong reason given the performance data showing shorter typically outperforms.
    • Aspect ratio confirmed at 16:9. No pillarboxing. No letterboxing. No black bars.
    • First and last frames are not black, blank, or a freeze-frame of a static logo with no motion context.
    • Audio track is present, clean, and synced.
    • File format is MP4 or MOV.
    • File size is under 500 MB.
    • Resolution is one of the three approved pixel dimensions.
    • No on-screen URLs of any kind.

    The Repurposing Trap

    One of the most common sources of SBV rejection is creative repurposed from paid social without appropriate policy scrubbing. A Meta Reels ad or TikTok video that mentions pricing, includes user-generated testimonials with star ratings shown, or has a CTA that references the platform will fail Amazon review every time. SBV requires its own production track or at minimum a dedicated Amazon-cut of any video that originated elsewhere.

    If you’re working with a production team or agency, this should be a brief in the production spec, not an afterthought at the upload stage. The cost of a compliance-aware production brief is one extra conversation. The cost of discovering a violation at upload when you’re ten days from a launch window is significantly higher.

    The Four Variables Worth Testing in SBV (And the Ones That Waste Your Time)
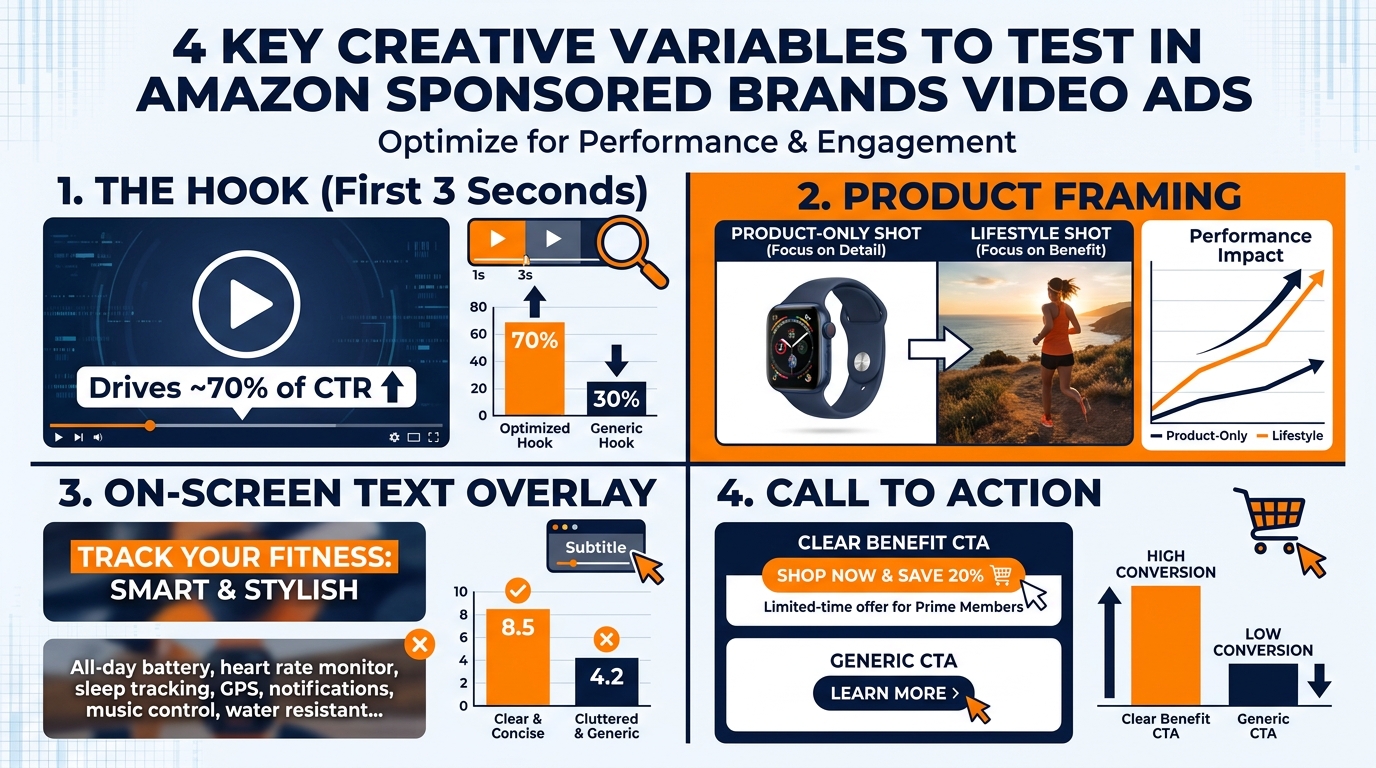
    Four-quadrant infographic showing the key SBV creative variables to test: The Hook, Product Framing, On-Screen Text Overlay, and Call to Action

    The standard list of “things to test” in SBV creative is longer than it is useful. Here’s a more honest breakdown of which variables actually move the metrics that matter, and which ones are noise.

    Variable 1: The Hook (First 3 Seconds) — Highest Leverage

    Amazon’s own creative guidelines attribute roughly 70% of CTR outcome to the first 0–3 seconds of an SBV ad. That’s not a small effect. It means that in any test where you hold the hook constant and vary something else, you may be optimizing the remaining 30% of CTR impact. The first three seconds are where the large majority of your creative testing budget should go.

    What’s worth testing in the hook specifically:

    • Product-first vs. problem-statement: Does showing the product immediately outperform an opening that states the shopper’s problem? In most categories, product-first wins on CTR, but problem-statement can outperform on CVR for high-consideration products where purchase intent needs to be earned.
    • Motion vs. static opening: Does a video that starts with high-energy movement (product in action, kinetic text overlay) outperform one that opens with a clean, still product shot?
    • On-screen text in the hook vs. none: Many advertisers test whether a bold text overlay in the first three seconds (stating the key value proposition) drives more or fewer clicks than pure visual.

    Variable 2: Product Framing (Seconds 3–12) — Medium Leverage

    After the hook captures attention, how the product is framed for the majority of the video affects both watch-through rate and conversion rate. The key test here is in-use/lifestyle framing versus pure product feature framing. Lifestyle tends to resonate more strongly with top-of-funnel shoppers who are in category research mode. Feature framing tends to convert better for shoppers already comparing specific products — which is largely who you’re reaching when SBV appears in keyword-targeted search results.

    A practical approach: test lifestyle-heavy versus feature-heavy in separate phases of your product launch cycle. In early launch, you’re building category awareness, which may favor lifestyle. In a mature phase competing on specific search terms, feature clarity often wins.

    Variable 3: On-Screen Text Treatment — Lower Leverage for CTR, Higher for CVR

    The text overlay approach — whether you use minimal text, bold claim-driven text, benefit-bullet text, or purely product-name-and-tagline — affects how much information a shopper absorbs from the video before clicking. SBV plays without audio on by default for most users in most contexts, which means the on-screen text is doing a significant portion of the communication work that the voiceover or music handles when audio is active.

    Test text-heavy versus text-light versions of the same underlying video. The text-light version will often look more polished and premium; the text-heavy version often converts better in commodity categories where the shopper is making a quick comparison decision.

    Variable 4: The End Card and CTA — Lower Leverage Than Expected

    The end card is the last two to three seconds of the video — typically a brand logo, product shot, and CTA. Most advertisers over-invest testing here relative to the leverage it provides. Because the majority of CTR decisions are made in the first three seconds, a shopper who has already decided not to click will not be rescued by a clever end card.

    End card tests are worth running, but treat them as refinement-level optimization after you’ve locked in a strong hook. Testing end card language before you’ve optimized the hook is putting polish on a door before you’ve verified the frame is sound.

    What’s Not Worth Testing (Yet)

    Audio treatment, music style, color palette variations, and voiceover versus no-voiceover tests all have lower expected lift and require substantially larger impression volumes to reach statistical significance. These are round-three tests, not round-one priorities. If your account doesn’t generate enough volume to reach significance on a hook test in three weeks, it definitely won’t reach significance on a color palette test.

    Structuring Your Campaigns for Clean Data
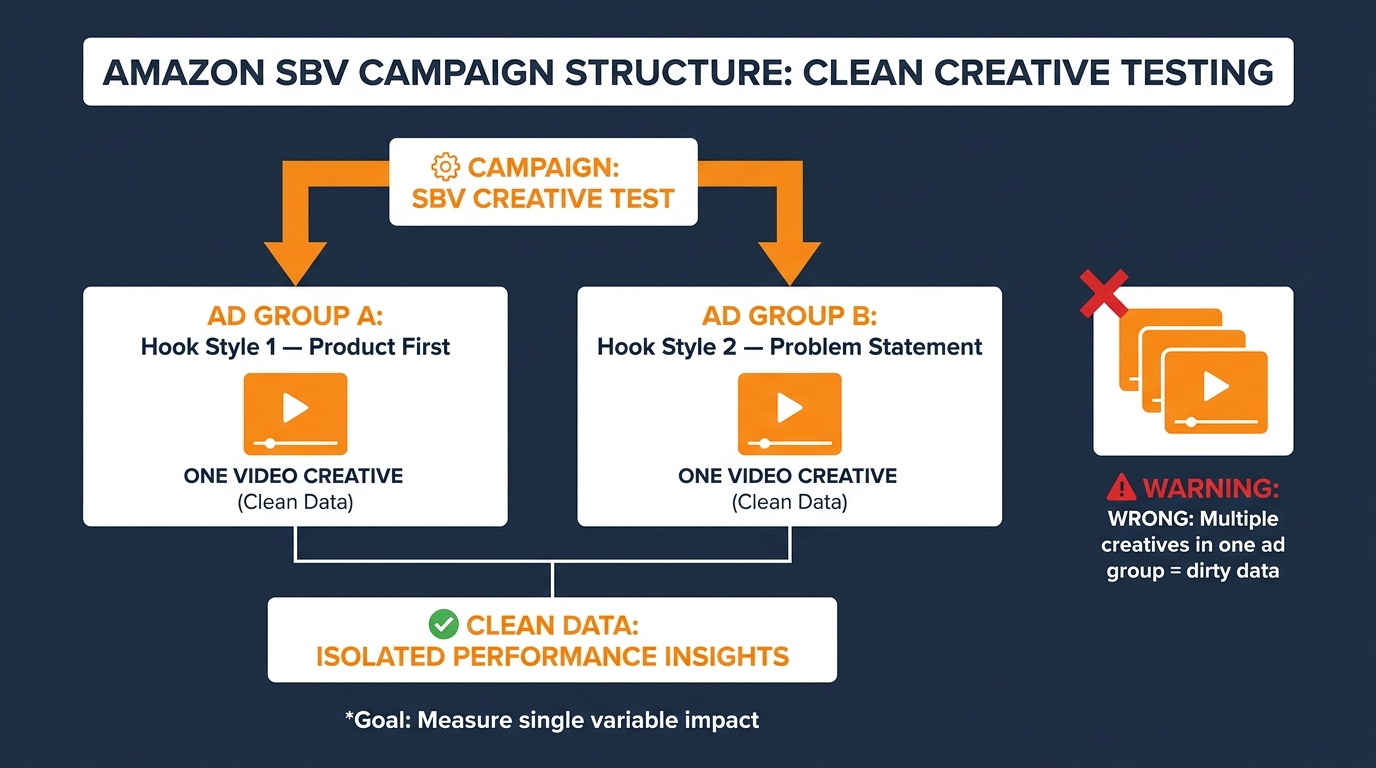
    Campaign structure diagram showing proper single-creative ad group setup for Amazon SBV testing versus wrong approach of multiple creatives in one ad group

    The most commonly cited reason for unusable SBV test data has nothing to do with the creatives themselves. It’s campaign structure. Specifically, most advertisers run multiple creatives inside a single ad group and expect to extract meaningful per-creative performance from that setup. You cannot.

    The Single-Creative Ad Group Rule

    Every creative variant in a test must live in its own separate ad group. One creative per ad group, period. This is not an optimization nicety — it’s the structural prerequisite for having any confidence in what your data is telling you.

    When multiple creatives share an ad group, Amazon’s algorithm will preferentially serve the creative it predicts will win the auction or improve quality score. This introduces platform-level selection bias into your test before the shopper has made any choice at all. The creative the algorithm shows more often will accumulate more impressions and clicks, making it look like it’s winning — when it may simply be the one Amazon decided to favor based on factors entirely outside your test design.

    The correct structure for a two-variant test:

    • Campaign: SBV Test — [Category] — [Date]
    • Ad Group A: Variant 1 — Product-First Hook — [one creative only]
    • Ad Group B: Variant 2 — Problem-Statement Hook — [one creative only]
    • Identical keyword targeting, identical bids, identical budget allocation across both ad groups.

    Timing: Run Variants Simultaneously, Not Sequentially

    Running Variant A for two weeks, then Variant B for two weeks, and comparing the results is a common mistake. Seasonality, competitor activity, Prime Day proximity, inventory fluctuations, and algorithm changes between those two windows will introduce more variation than your creative variable ever could. Both variants must run at the same time on identical keyword sets with identical bids.

    If budget constraints mean you can only afford to run two simultaneous ad groups at meaningful spend, that’s the correct trade-off to make. Slower accumulation of clean data is more valuable than faster accumulation of dirty data.

    Controlling for Keyword Intent

    Your keyword set for both ad groups in a creative test should be identical and held constant throughout the test. If you add keywords to one ad group mid-test, you’ve changed the audience mix for that group. If your test keywords include both broad-match and exact-match terms, the different match types will attract different shopper intent signals, which affects CVR in ways that may have nothing to do with the creative.

    Best practice for a controlled creative test: use exact-match keywords only. The tighter the intent signal, the cleaner the data.

    The Naming Convention That Saves You Later

    Implement a consistent naming convention from campaign creation that encodes the variable being tested. A structure like [Brand]_SBV_[TestRound]_[Variable]_[VariantID]_[Date] means that six months later, when you’re auditing past tests to inform new creative briefs, you can reconstruct exactly what was tested, when, and in which order. Without this, your historical test data becomes a graveyard of unnamed campaigns with no extractable insight.

    The Stats That Tell You Something vs. The Stats That Lie to You

    Amazon surfaces a lot of numbers for SBV campaigns. Most of them, in isolation, tell you very little about creative quality.

    The Metrics That Actually Matter

    CTR (Click-Through Rate) is your primary read on hook quality. It tells you whether the creative was compelling enough at the search-results-page impression level to get a click. High CTR with low CVR usually means the creative is promising something that the product detail page doesn’t deliver, or that you’re attracting intent-mismatched shoppers.

    CVR (Conversion Rate) is your primary read on audience-offer fit. A creative that selects for shoppers who are close to purchase intent will convert at a higher rate than one that attracts broad attention but low purchase readiness. For most SBV tests, you want both CTR and CVR moving together, but if you have to choose which matters more, CVR is the better revenue proxy.

    Video View Rate and View Duration are underused. Amazon provides data on what percentage of viewers watched 25%, 50%, 75%, and 100% of your video. A sharp drop-off at 25% (the 3–5 second mark) tells you the hook failed. A sharp drop-off at 75% tells you the middle of the video is losing people before they reach your CTA. These metrics can help you diagnose where in the video the failure is occurring, which makes your next iteration more targeted.

    The Stats That Mislead

    Impressions in isolation tell you about budget and bid dynamics, not creative quality. A creative running in a higher-traffic time window will naturally accumulate more impressions. Don’t compare creative performance on raw impression volume.

    ROAS in small samples is heavily affected by a small number of high-value orders. If one ad group had two or three unusually large orders during the test window, its ROAS will look dramatically better than a competitor creative that drove more consistent but smaller orders. Wait for at least 200–300 clicks per variant before reading ROAS into your conclusions.

    CPC (Cost Per Click) can reflect keyword auction dynamics rather than creative quality. A creative that Amazon’s algorithm likes better may receive a lower effective CPC over time, which can make its ROAS look stronger independent of the creative quality itself. Track CPC as a contextual signal, not a creative quality indicator.

    How to Know When You Have a Winner (And When You’re Just Seeing Noise)

    The hardest discipline in creative testing is stopping yourself from calling a winner before you have enough data to trust the result.

    The 200–300 Click Threshold

    For SBV creative tests, practitioners and statisticians alike typically require at least 200 to 300 clicks per variant before declaring a winner. This is the minimum click volume needed to distinguish a real performance difference from statistical noise at a 90–95% confidence level, assuming a moderate effect size (one variant outperforming by 20–30% on CTR or CVR).

    For most accounts running SBV at normal budget levels, reaching 200–300 clicks per variant takes two to four weeks. For smaller accounts or niche categories with limited search volume, it may take longer. The right answer is to wait — not to call a winner at 80 clicks because you’re impatient to move on.

    The Simultaneity Check

    Before calling any test result, confirm that both variants ran simultaneously throughout the test window. Check the impression timestamps in your campaign reports. If one variant went live three days after the other (because of a review delay), discount the data from that first three-day period and only compare the overlapping window. This adjustment alone will correct a number of false “winners” in tests where a review gap introduced a timing bias.

    When the Winner Isn’t Clear

    If both variants finish within a few percentage points of each other on both CTR and CVR after reaching sufficient click volume, the honest conclusion is that this variable doesn’t produce a meaningful difference for your product and audience. That’s still a useful result — it tells you where not to invest future testing cycles. Archive the result, note it in your creative testing log, and move on to a variable with higher expected leverage.

    Not every test will produce a clean winner. A system that acknowledges this and moves on efficiently is more valuable than one that tries to wring a false conclusion from ambiguous data.

    The Fatigue Curve: When Winners Stop Winning and What to Do About It
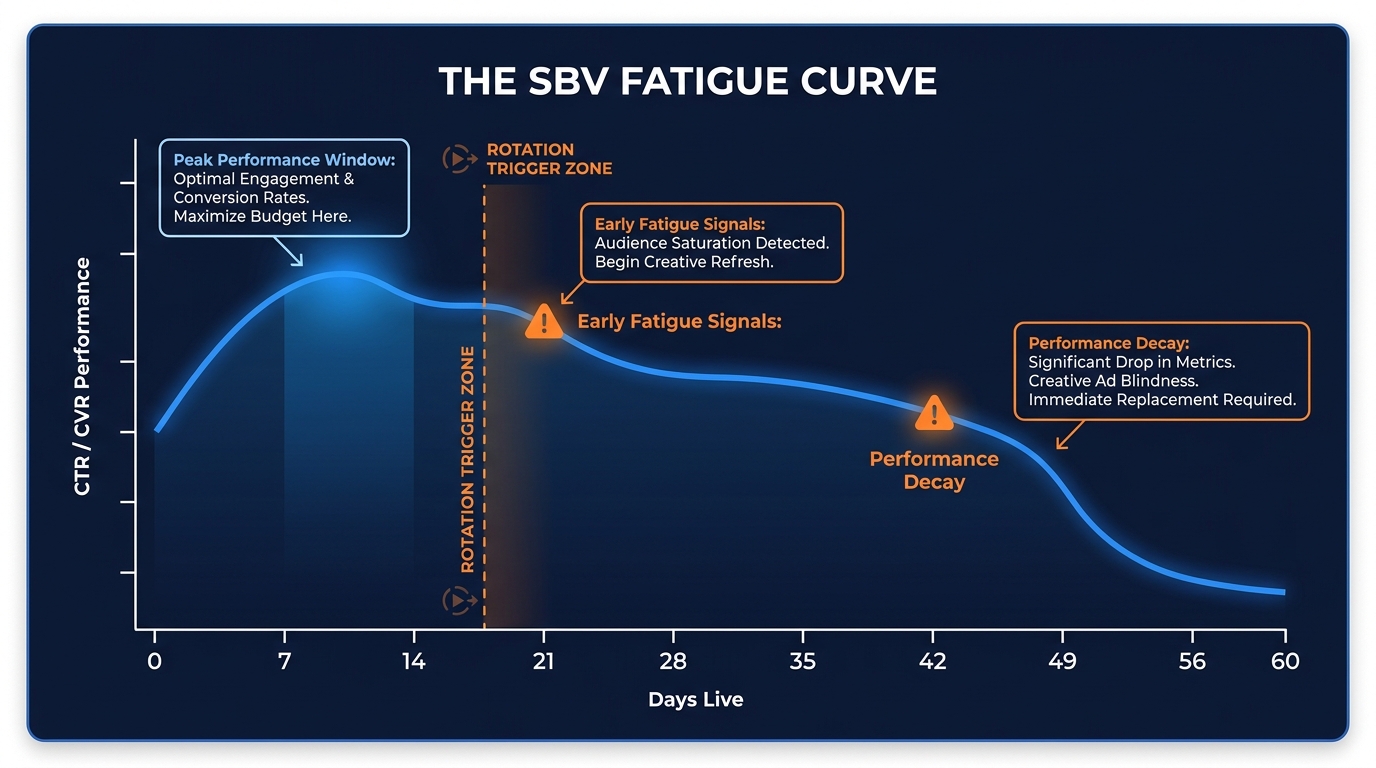
    SBV fatigue curve line graph showing performance peak at days 7-14 followed by gradual decline with rotation trigger zone marked at days 14-21

    Once you have a winning creative, the instinct is to leave it alone and let it run. This is usually the right short-term call. It’s often the wrong long-term one.

    Understanding the Fatigue Window

    SBV creatives typically reach their performance peak somewhere in the first one to two weeks of active delivery. After week three, most accounts begin to see the early signals of fatigue: CTR starts to slowly decline even as impressions hold steady. After week five or six, the decay usually accelerates.

    The mechanism is straightforward: you’re repeatedly showing the same video to an overlapping audience. On Amazon, the “audience” for a given keyword set is not infinite. High-frequency shoppers in your category will see the same creative multiple times per week. By the third or fourth exposure, the video is no longer novel — the shopper has already processed the hook and made a decision. You stop getting the same attention quality from each impression.

    The Early Warning Signals

    You should not wait until CTR has visibly collapsed before acting on fatigue. By the time performance has dropped noticeably, you’ve already spent budget on degraded impressions for weeks. Instead, set a monitoring schedule:

    • Week 1: Baseline CTR and CVR at the ad group level.
    • Week 2: First performance read. Is CTR within 10% of Week 1? Continue.
    • Week 3: Second read. A CTR drop of more than 15% week-over-week is an early fatigue signal.
    • Week 4–5: If CTR has dropped more than 20–25% from baseline, begin transitioning budget to a refreshed creative.

    Having a replacement creative ready to go before you need it is the critical dependency here. If your rotation plan requires building a new creative from scratch when fatigue hits, you’ll almost always be late.

    What “Refreshing” Actually Means

    A creative refresh doesn’t have to mean a full video reshoot. Often the most effective refresh is a variation on the winning creative’s structure: the same overall format, the same product framing, but a different hook in the first three seconds. If your data showed that a product-first hook outperformed a problem-statement hook, your refresh might try a different product-first angle — a different shot, a different on-screen text treatment, a different motion style — while preserving the elements that drove the original win.

    This approach builds on your learning rather than discarding it. You know the underlying structure works. You’re testing whether a surface-level variation can extend the creative’s working life without triggering a new compliance review cycle from scratch.

    Building the Creative Library That Funds Your Testing

    The advertisers running the most effective SBV testing programs aren’t funding each test individually. They’re building a creative library — a structured inventory of tested, approved, and performance-validated video assets — that funds each new test from the learnings of the last one.

    What a Creative Library Actually Contains

    A functional SBV creative library has three layers:

    • Active creatives: Currently live and performing within acceptable range. These are the revenue-generating assets. They should have documentation noting what was tested to arrive at this version, when it went live, and what the current performance trajectory looks like.
    • Pipeline creatives: Built, compliance-checked, and approved by Amazon but not yet live. These are the rotation reserves — ready to deploy when an active creative shows fatigue signals.
    • Learning archive: Past test results, including both winners and losers. The loser data is particularly valuable: it tells you which variables made no difference for your audience and which ones actively hurt performance, which means you can stop reinvesting time and budget testing the same dead ends.

    The Minimum Viable Library Size

    For an account running SBV at meaningful spend — say, enough to generate 200+ clicks per variant in two to three weeks — you should maintain at minimum two active creatives and two pipeline creatives at any given time. This gives you one rotation cycle of insurance without requiring emergency production when fatigue signals appear.

    Higher-spend accounts or accounts with multiple product lines should scale this accordingly. A rough target: for every major keyword cluster you’re targeting with SBV, have enough approved pipeline creatives to rotate through a six-week cycle without repeating an asset.

    Batching Production to Reduce Per-Test Costs

    The per-creative cost of SBV production drops significantly when you batch. If you’re commissioning a video production or generating AI-assisted video, producing four or five variants in a single session costs a fraction of producing each variant individually. The variants can share a shoot day, the same raw footage cut in different ways, or the same motion graphics template with different text treatments.

    Batching also has a compliance benefit: a single compliance review of the script and storyboard before production begins covers all variants simultaneously, rather than requiring a separate compliance check for each one.

    The Iteration Loop: From Review Rejection to Stronger Creative
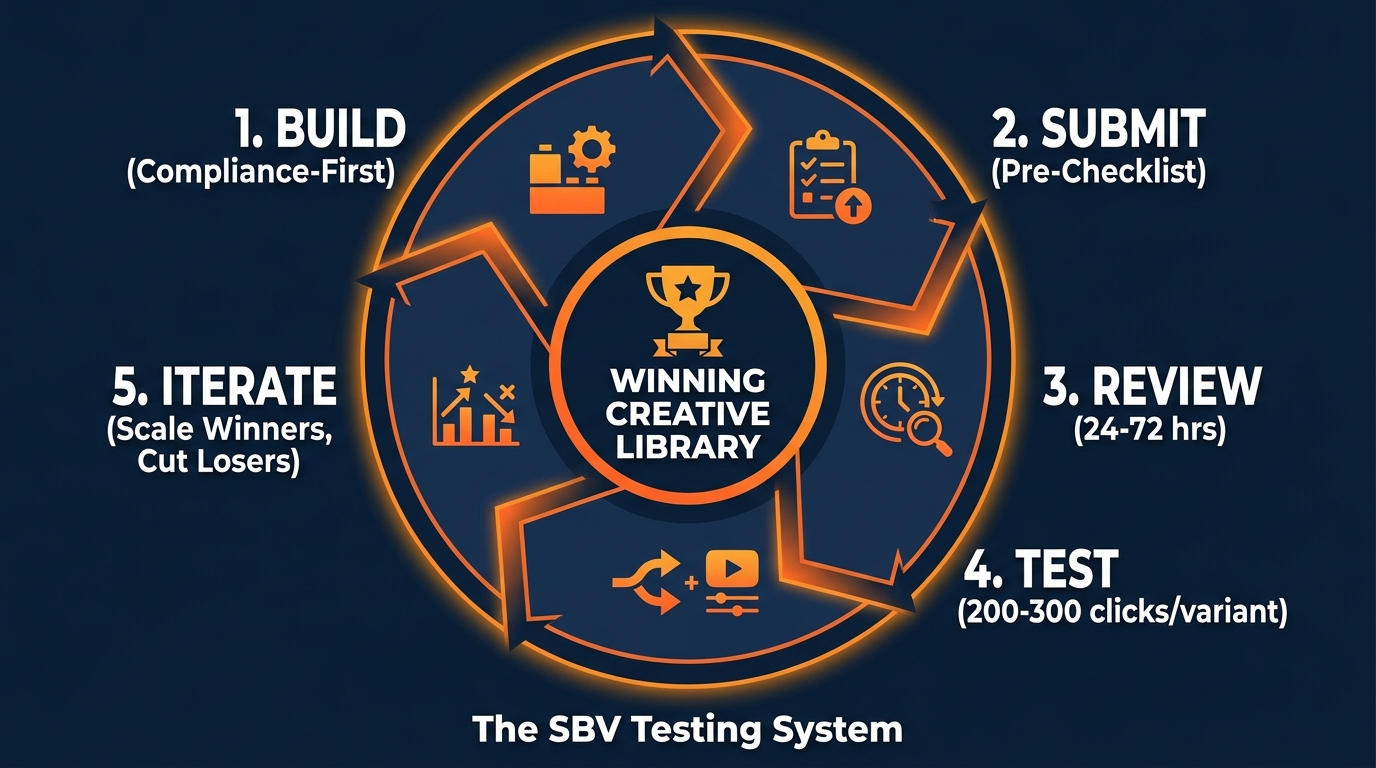
    Circular creative testing loop diagram showing five stages: Build, Submit, Review, Test, Iterate — with winning creative library at the center

    Every rejection is information. Not the rejection you wanted, but information nonetheless. The advertisers who turn rejections into productive iteration are the ones who end up with the cleanest compliance records and the most policy-resilient creative libraries.

    Reading the Rejection Reason Correctly

    When Amazon rejects an SBV creative, a rejection notice is sent via email that specifies the policy or technical issue. These notices are sometimes vague, which creates a frustrating second loop where you fix one thing and get rejected for something else. The fix is to treat the rejection reason as a starting point, not a complete diagnosis.

    When you receive a rejection, run the full compliance checklist against the rejected creative — not just the specific violation cited. Amazon’s review process may catch one issue at a time, meaning that fixing the cited issue and resubmitting without checking for others can result in a second rejection for a different issue, starting the resubmission queue timer over again.

    One systematic fix: treat your first submission of a new creative type as a compliance pilot. Build the creative, run every item on your checklist, submit it, and document the outcome. If it’s approved, add the creative type to your “clean template” library. If it’s rejected, document the rejection reason and update your checklist to include an explicit check for that issue in all future productions.

    Building Rejection Patterns Into Your Briefs

    Over time, every advertiser accumulates a set of rejection patterns specific to their category, their production style, and their typical claims. These patterns are gold for your creative brief template.

    If you consistently get rejected for claim-related violations in a health and wellness category, your brief should include an explicit section titled “Claims Requiring Substantiation” with a list of the specific phrases that need either on-screen substantiation or removal. If you consistently get rejected for audio issues (video exports with silent or corrupt audio tracks from a specific production workflow), your brief should include a mandatory audio QA step before any upload.

    A brief that encodes your historical rejection patterns is a brief that gets progressively shorter review cycles over time.

    The Compounding Advantage of a Clean Compliance Record

    Advertisers with clean compliance histories — consistent first-submission approvals, few or no policy flags — benefit from the structural advantages of having their creative inventory fully loaded at all times. They can run tests on their preferred schedule rather than the schedule imposed by review delays. They can respond to competitive events (a competitor’s major launch, a trending search term, a category news cycle) with creative already approved and ready to activate.

    Advertisers with poor compliance histories are perpetually catching up. Their creative is in resubmission queues when they need it live. They’re running last year’s approved creative on this week’s inventory instead of the one they built for this week’s context.

    The Practical Testing Calendar: What a Quarter Actually Looks Like

    Abstract frameworks are easier to implement when you can see what the actual execution rhythm looks like across a full testing cycle. Here’s a realistic quarterly SBV testing calendar for a mid-size advertiser running two to three active keyword clusters.

    Month One: Foundation

    • Week 1: Audit current SBV creative inventory. Identify compliance gaps, missing technical specs, and historical rejection patterns. Build or update your compliance checklist and brief template.
    • Week 2: Commission or produce two hook variants for your primary keyword cluster. Run both through the compliance checklist. Submit for review 10 days before your intended test start date.
    • Week 3: Test goes live (assuming approvals in week 2). Begin accumulating click data with both variants running simultaneously in single-creative ad groups on identical keyword sets.
    • Week 4: First performance read at the end of week one of live testing. Baseline CTR and CVR recorded.

    Month Two: Data and Decision

    • Week 5–6: Continue running both variants. Reach 200–300 clicks per variant. Track view duration data weekly.
    • Week 7: Call the test result. Archive the outcome in your creative testing log. Identify the winning variable (or document that no significant difference was found).
    • Week 8: Brief the next test round based on Month One learnings. Commission pipeline creatives for Month Three rotation. Submit new creatives for review.

    Month Three: Iteration and Library Build

    • Week 9–10: Deploy the Month Two winner as the primary creative. Monitor for fatigue signals. Begin second test round on the variable identified in Month Two (or move to Variable 2 if Month One’s variable was inconclusive).
    • Week 11–12: Conduct mid-quarter review. How many approved creatives are in the pipeline? Are the fatigue signals in any active creative approaching the rotation trigger threshold? What did the Month Two test teach you about your audience’s response to the creative variables you’ve tested?

    After one quarter of this cycle, you’ll have run at minimum two clean tests, produced four to six compliant approved creatives, built a meaningful learning archive, and developed enough category-specific understanding of your audience’s creative preferences to make your Month Four brief substantially smarter than your Month One brief.

    Why Most SBV Testing Fails — and What Separates the Programs That Work

    The fundamental failure mode for SBV testing isn’t strategic — it’s structural. Most SBV testing programs fail because they confuse “running multiple creatives” with “running a test.” Submitting two videos to Amazon and seeing which one has better numbers at the end of a month is not a test. It’s an observation with no controls, no sample-size discipline, and no way to isolate cause from effect.

    The programs that generate compounding, bankable learning share a specific set of structural properties:

    • Pre-submission compliance is treated as non-negotiable, not optional. The first-submission approval rate is tracked as a KPI and optimized over time.
    • Campaigns are built for measurement from day one — single-creative ad groups, synchronized launch dates, identical bid and budget conditions, naming conventions that encode test parameters.
    • Statistical significance is a precondition for declaring a winner, not a post-hoc justification for an already-made decision.
    • Fatigue monitoring is calendared, not reactive. There’s always a pipeline creative approved and ready to rotate before the active creative shows serious decay.
    • Every test result — including null results — is documented and used to improve the next brief. The learning archive compounds over time into a meaningful competitive advantage.

    The result of running this system for two or three quarters is not just better SBV performance in isolation. It’s a durable creative library that provides insurance against competitive events, algorithm changes, and inventory shifts — because you always have approved, performance-validated creative ready to activate on short notice.

    Conclusion: The System Matters More Than Any Single Test

    SBV creative testing is often talked about as a creative problem — as if the main challenge is knowing what hook style to try or what CTA language converts best. Those questions matter. But they’re secondary to the structural and operational questions that determine whether your testing program produces trustworthy data at all.

    Getting creatives through review on the first submission is a compliance architecture problem. Getting clean data from your tests is a campaign structure problem. Knowing when you have a real winner is a statistics problem. Managing the fatigue curve is a production pipeline problem. None of these have creative solutions. They all require operational systems built in advance of running any test.

    The advertisers gaining the most durable advantage from SBV in 2026 aren’t the ones with the most creative video concepts. They’re the ones who built the operational infrastructure to test those concepts quickly, measure the results reliably, and rotate winners before they decay — without ever losing a launch window to a review queue they didn’t plan for.

    Build the system first. The creative insights will follow.

    Key Actionable Takeaways

    • Run your full compliance checklist at the script/storyboard stage, before production. Fix violations before they become rejection delays.
    • Submit new SBV creatives at least 10 days before any window you intend to test in, to absorb one rejection cycle without losing the timing.
    • Use single-creative ad groups with identical keywords, bids, and budgets for every A/B test. No exceptions.
    • Run variants simultaneously — never sequentially — to eliminate time-based confounds.
    • Prioritize the hook (first 3 seconds) for your first testing cycles. It carries approximately 70% of your CTR outcome and is the highest-leverage creative variable.
    • Require at least 200–300 clicks per variant before calling a winner.
    • Set a weekly CTR monitoring schedule and treat a 15%+ week-over-week CTR decline as an early fatigue trigger — not a signal to wait and see.
    • Maintain at minimum two pipeline creatives (approved but not yet live) at all times for every active keyword cluster running SBV.
    • Document every test result in a creative testing log, including null results. The archive compounds into your most valuable briefing resource.
  • SBV Creative Testing: Why the First 15 Seconds Are the Only Seconds That Matter

    SBV Creative Testing: Why the First 15 Seconds Are the Only Seconds That Matter

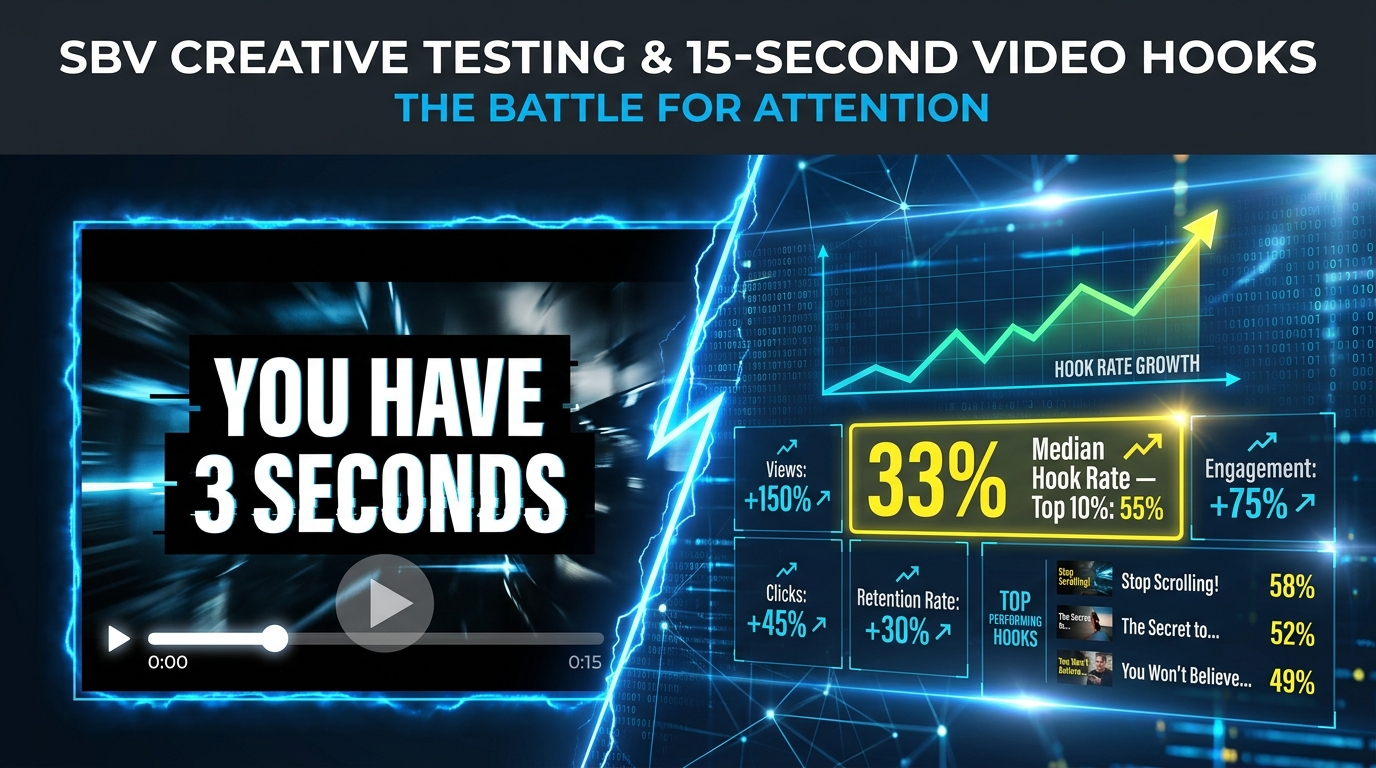
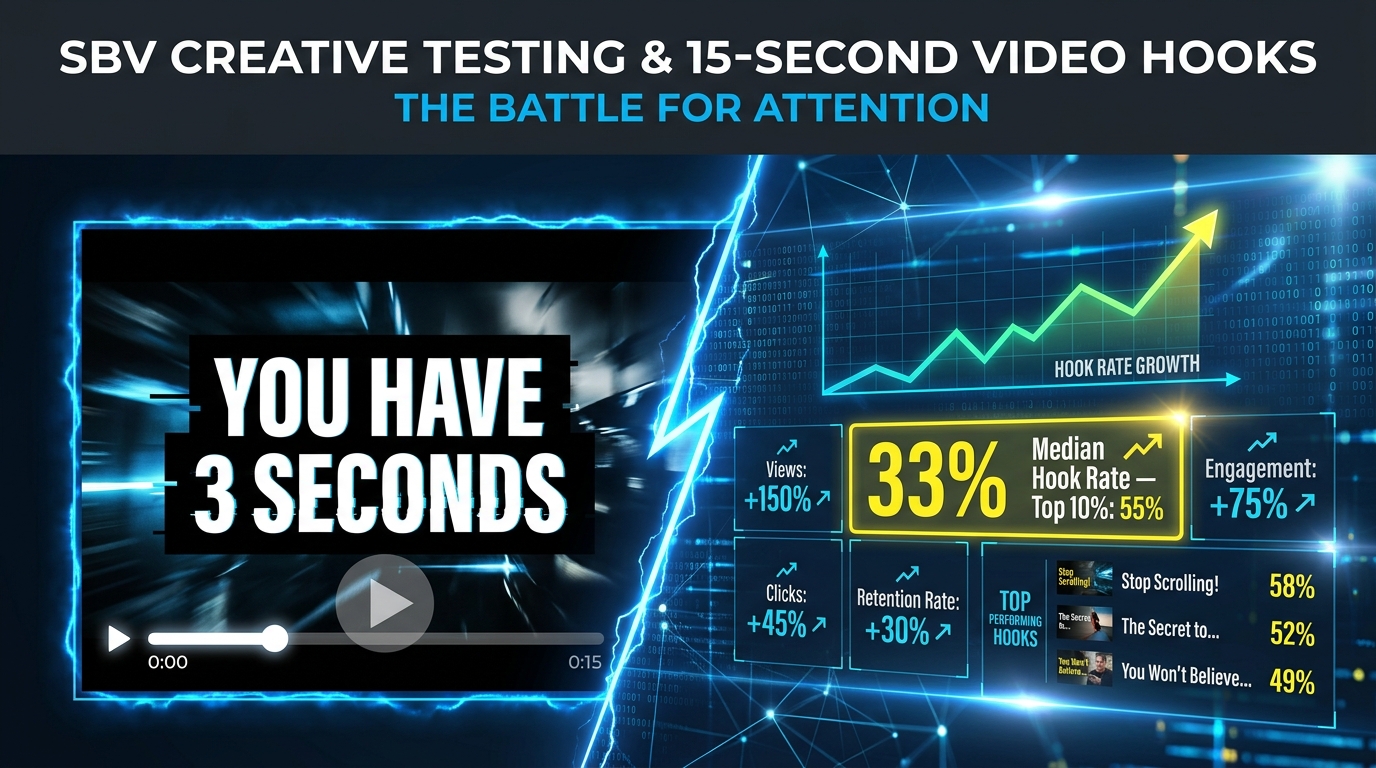
    SBV creative testing hero image showing a 15-second video hook performance dashboard with hook rate benchmarks and rising metrics

    There is a number that changes everything about how you should approach video advertising: 3. Three seconds. That is the window you have to stop a scroll, establish relevance, and earn the next twelve seconds of a viewer’s attention. Everything that comes after — the product demo, the social proof, the call-to-action — is irrelevant if you have not cleared that threshold first.

    SBV creative testing — whether you are working with Amazon Sponsored Brands Video or applying the broader short-form boost video methodology across Meta, TikTok, and retail media — has evolved into a rigorous, data-driven discipline built around one central insight: the hook is the ad. Everything else is execution. The brands closing the gap between creative spend and measurable return are the ones treating the first 15 seconds not as a format constraint, but as a decision architecture.

    This article is not about creative inspiration or mood boards. It is about the mechanics of hook construction, the benchmarks that separate winners from expensive guesses, and the testing architecture that transforms a single lucky creative into a repeatable system. We will cover the six hook types that consistently outperform across platforms, the four-stage metric waterfall that diagnoses creative health, and the kill/keep/scale decision framework that most teams skip — burning budget on creatives they should have cut in day three.

    If your video ads feel like they should be performing better than they are, the problem almost always lives in the first three seconds. Here is how to find it, fix it, and build a system that keeps finding winners at velocity.

    What SBV Creative Testing Actually Is (and What Most Teams Get Wrong)

    The term “creative testing” gets used loosely across performance marketing to mean almost anything — running two versions of an ad, trying a new colour palette, swapping a headline. That is not creative testing. That is creative guessing with extra steps.

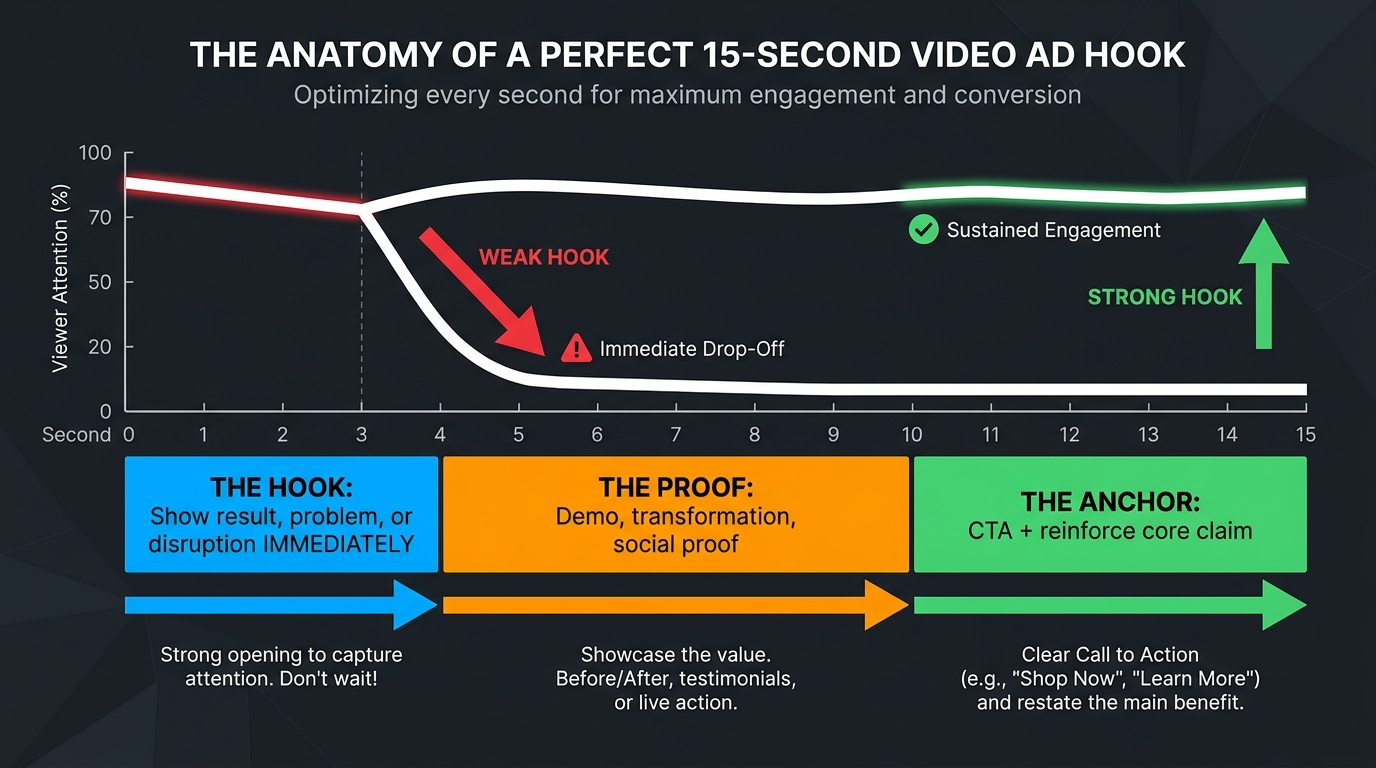
    SBV creative testing is a structured, methodology-first approach to video ad production and evaluation. The core principle is simple: isolate one variable at a time, let the data decide, and build learning systems rather than chasing one-off wins. Applied to short-form video, this means treating your 15-second ad not as a single creative unit, but as three distinct, testable components — the hook (seconds 0–3), the proof layer (seconds 3–10), and the call-to-action anchor (seconds 10–15) — and testing them separately before assembling a complete winner.

    The Modular Creative Framework

    Most brands approach video production the way they approach television commercials: conceive the full 15 or 30-second narrative, produce it, run it, and hope. This approach fails systematically in performance media because it makes it impossible to know which element drove the result — or killed it.

    The modular framework flips that logic. You begin by testing hooks exclusively. Keep the offer identical. Keep the target audience identical. Keep the product demonstration identical in the body of the ad. Change only the opening 2–3 seconds across 10 to 20 variants. That single-variable constraint is what converts raw results into actionable intelligence.

    Once you have identified a hook that clears your performance thresholds, you port it into the body-layer test. Then you test CTA variants. By the time you have a “full creative winner,” you know exactly why it won. That knowledge compounds: each hook test teaches you something transferable about your audience’s psychology, their pain points, and the visual language they respond to. That is the difference between a lucky creative and a learning machine.

    Why Most Brands Start at the Wrong Layer

    The most common mistake in SBV testing is investing the majority of production budget and testing cycles in the body of the ad — the product demo, the lifestyle footage, the animated proof points — while running only one or two hook variants. It is intuitively backwards: the hook is the smallest creative unit to produce and the highest-leverage variable to test, yet it receives the least systematic attention.

    A 2026 analysis of structured creative testing accounts found that brands running 15–30 hook variants across a testing window outperformed those running fewer than five variants significantly on CPA efficiency, not because they had better creative instincts, but because they had more decision data. Volume in testing is not a vanity metric — it is a sample size problem. With two hook variants, you cannot trust a winner. With twenty, the signal is real.

    The Muted Majority: Building Hooks That Win Without Sound

    Infographic showing 71% of video ads play muted, comparing audio-only hooks versus visual plus text overlay hooks for performance advertising

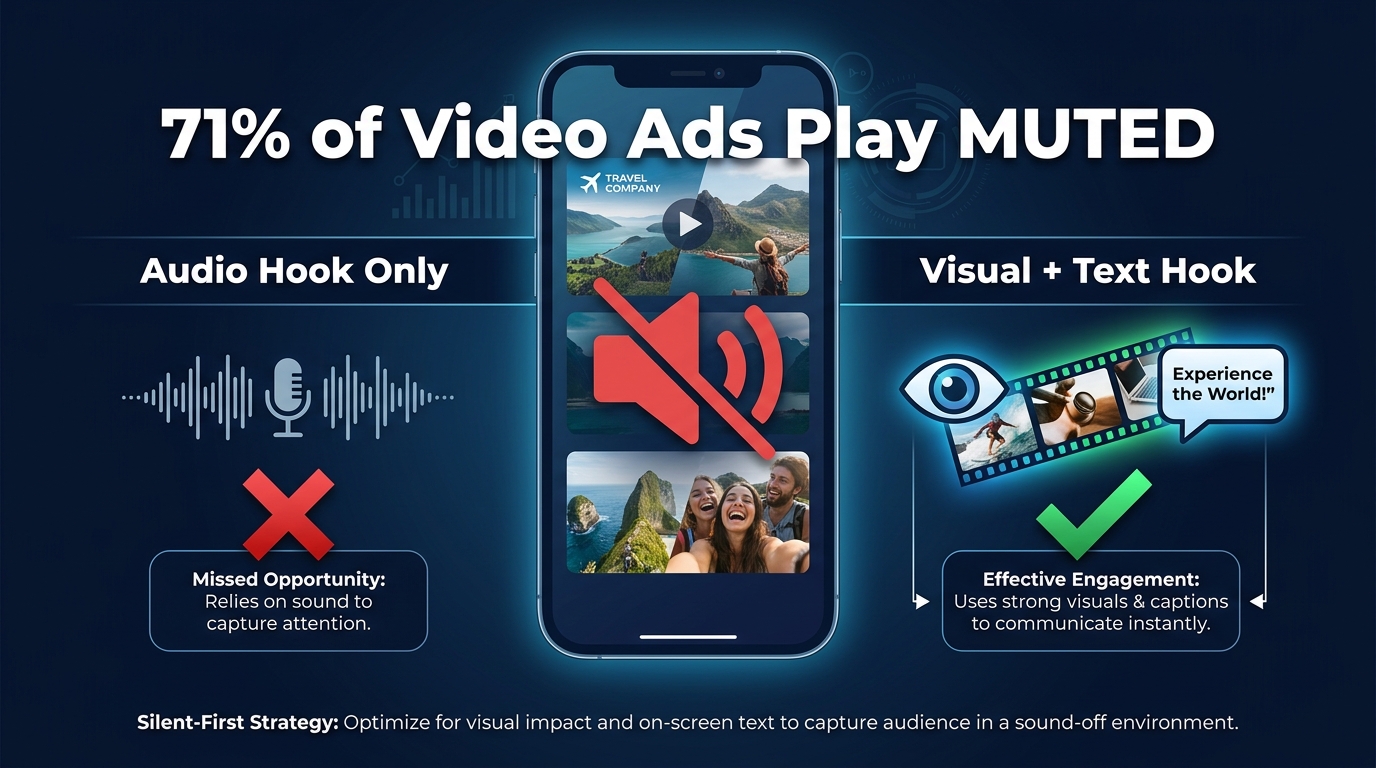
    Before you write a single hook script, you need to accept one uncomfortable reality about where your ad actually lands: most people will never hear it. Amazon Sponsored Brands Video ads autoplay muted by default — the audio control is tucked in the lower-right corner, and most viewers never touch it. Across paid social platforms, the pattern is similar. Estimates from practitioners in 2026 consistently put muted impressions at 70–75% of total SBV plays.

    This is not a technical footnote. It is a fundamental design constraint that invalidates entire categories of hook strategy.

    The Visual-First Hook Design Imperative

    A hook built around a compelling voiceover — “Are you still paying too much for X?” — loses approximately three-quarters of its audience before the question even registers. An audio-led hook is not a hook at all for the majority of your impressions. It is silence overlaid on moving pixels.

    Visual-first hooks operate on a completely different logic. They use three primary tools to communicate instantly without sound:

    • Bold on-screen text overlays — Large, high-contrast text that delivers the hook’s message in the first 1–2 seconds. Not a subtitle. Not a lower-third. A statement that is the first thing the eye lands on when the video begins.
    • Product-in-action visuals — Showing the product being used, the transformation occurring, or the outcome already achieved. The brain processes visual narrative faster than it processes text. A before/after in two seconds is more efficient than six seconds of explanation.
    • Motion as attention signal — Rapid, deliberate movement in the first frame — a hand reaching into frame, a product dropping into shot, a sudden colour change — that triggers the reticular activating system and breaks the passive scroll state.

    The Silent Hook Checklist

    Before any hook variant goes into testing, run it through this filter: mute the video entirely and watch only the first three seconds. Ask these questions: Does the viewer know what product category this is? Does the viewer understand the benefit or problem being addressed? Is there a reason to keep watching? If the answer to any of these is no, the hook is not ready to test. It is ready to rebuild.

    For Amazon SBV specifically, the silent-hook imperative is compounded by the placement context. These ads appear in search results, between a shopper and the product they were already looking for. The bar for disruption without sound is high — you are competing with organic listings and the shopper’s existing intent. Your silent hook has to be more interesting than whatever they were about to click.

    Hook Taxonomy: The 6 Types That Win Consistently

    Visual taxonomy of 6 winning video hook types including product outcome showcase, pattern interrupt, curiosity gap, frustration-led, polarizing claim, and story tease

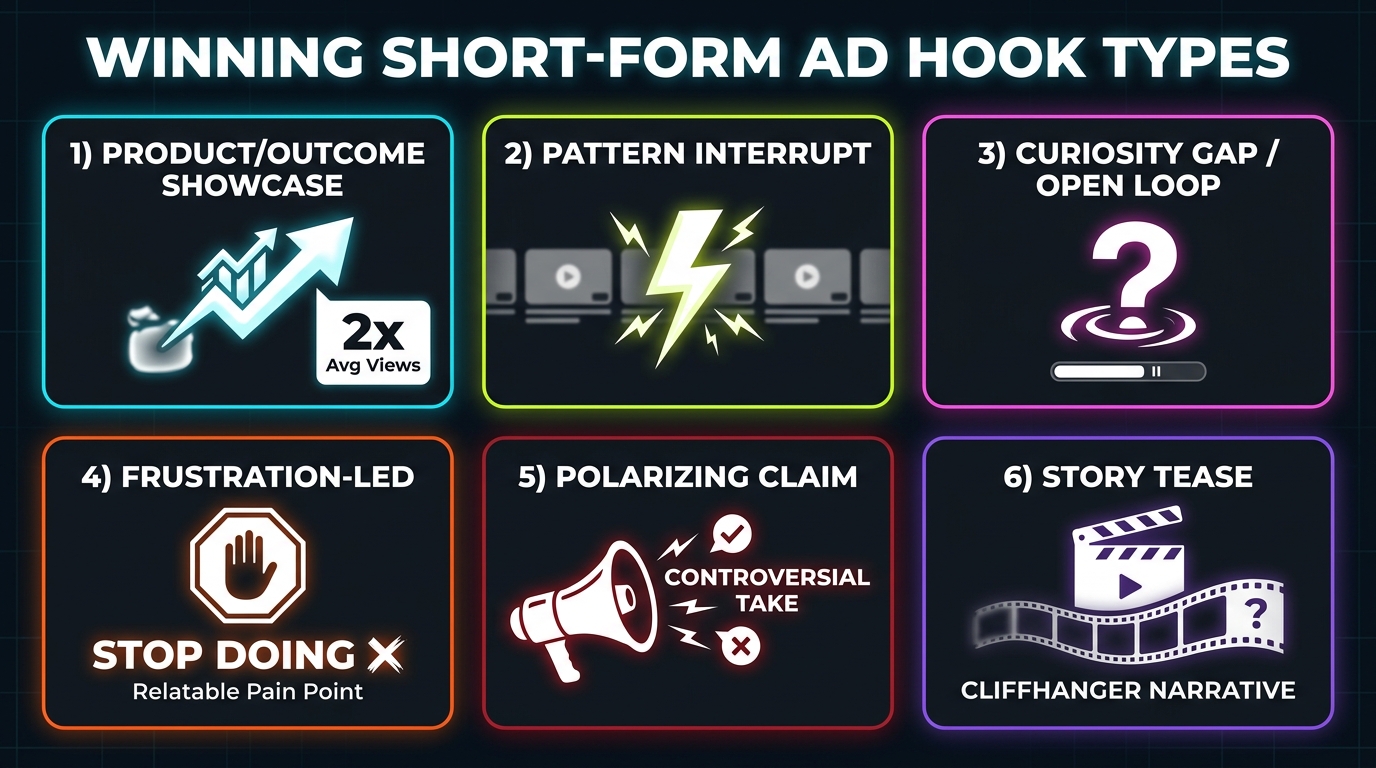
    A 2026 analysis of 34,635 short-form video creatives identified a clear performance hierarchy among hook types. The top-performing category — product/outcome showcases — averaged approximately 2× the views of the worst-performing hook type in the dataset. That is a 100% performance gap driven entirely by the opening frame. Here are the six hook types that the data consistently rewards.

    1. Product/Outcome Showcase

    The highest-performing hook type in large-scale analysis. The mechanic is simple: show the result, the transformation, or the product in its most compelling moment of use within the first two seconds. No preamble. No context-setting. The outcome is the hook.

    For an e-commerce product, this might be a before/after visual of the problem solved — a cluttered desk versus an organized one, dull hair versus glossy and styled, a leaking pipe joint versus a clean, sealed fix. For a supplement brand, it is the product being held up against a clean background with a specific claim in the text overlay: “Dropped 12lbs in 6 weeks.” The specificity is the hook. Vague benefit statements (“feel better every day”) are not outcomes. Data points and concrete results are.

    Why does this work? It skips the audience’s ambient skepticism about advertising by delivering the value proposition before they have time to register that they are watching an ad. By the time the brain has processed what it saw, curiosity has already replaced cynicism.

    2. Pattern Interrupt

    The pattern interrupt hook exploits a neurological reflex. The brain in scroll mode is running a filtering heuristic — everything that looks like typical content gets processed passively, while genuine novelty or unexpectedness triggers a shift to active attention. The pattern interrupt is a deliberate violation of what the viewer expected to see next.

    Effective pattern interrupts include: an unexpected colour combination that does not match the platform’s native aesthetic, an unusual camera angle or motion direction, someone doing something that the viewer cannot immediately categorise, or a sudden sonic contrast (if the viewer has audio on). On TikTok and Instagram Reels, where native content norms are extremely established, a pattern interrupt has to be meaningfully different — not just “unusual” by television standards, but unusual by feed standards.

    3. Curiosity Gap / Open Loop

    The curiosity gap hook withholds a piece of information the viewer wants, then makes continuing to watch the only way to get it. The brain physiologically dislikes unresolved questions — it is one of the most reliable drives in human cognition. A well-constructed open loop turns that neurological drive into view time.

    Effective curiosity gap hooks are specific, not vague. “You’re making a mistake with your morning routine” is weak — it is too broad and too generic to feel personal. “The one thing dermatologists say you should never do before applying SPF” is stronger — it names a category expert, implies a specific prohibited action, and creates a concrete stakes feeling. The viewer knows something has been withheld that is directly relevant to them. That specificity is what generates the drive to keep watching rather than scrolling past.

    4. Frustration-Led Opening

    Naming a pain point that the viewer already has — before you pitch any solution — creates an instant relevance bridge. The frustration-led hook says “I know what you are dealing with” before you say “I have something that fixes it.” The structure is typically: identify the frustration, validate it briefly, then transition to the product as the resolution.

    The most effective frustration-led hooks are category-specific and granular. “Tired of dry skin” is too common. “Tired of your moisturiser pilling under makeup by 10am” speaks to a specific, lived experience that only people with that exact problem will recognise — and when they do, the recognition is powerful enough to pause the scroll.

    5. Polarizing Claim

    A bold, counterintuitive statement that challenges received wisdom in the product’s category. The polarizing claim hook works because it triggers a disagreement or surprise response — both of which are cognitively engaging states that interrupt passive processing. “Stop using sunscreen every day” (for a product that challenges conventional SPF guidance) or “Protein shakes are making your gains slower” (for a brand with an alternative approach) forces the viewer into an active stance: agree, disagree, or investigate further. All three outcomes require continued watching.

    The risk with polarizing claims is that they attract the wrong audience if not precisely targeted, or alienate existing customers who agree with the conventional view. Structural discipline in audience targeting is therefore more important with this hook type than with others.

    6. Story Tease

    The story tease hook drops the viewer mid-narrative, forcing them into the “what happens next” position. It borrows the mechanics of serialised content — the mid-episode cliffhanger — and applies them to a 15-second ad unit. The opening frame might show someone in an extreme situation (“I almost quit my business last year”), a visible emotional state without context (tears, relief, shock), or an action already in progress. The incompleteness of the narrative is what sustains attention through the remainder of the ad.

    Story tease hooks work particularly well with UGC-style creative, where the format naturally mimics personal social content. A founder talking directly to camera, mid-story, with visible emotional authenticity generates the parasocial pull that polished studio video cannot replicate.

    The Metrics That Tell You If Your Hook Actually Worked

    Hook diagnostic waterfall infographic showing four stages: hook rate, hold rate, completion rate, and conversion with 2026 benchmarks for Meta and TikTok

    One of the most costly errors in SBV creative testing is optimising for the wrong metric. Teams that evaluate hook performance using click-through rate alone miss the crucial diagnostic layer that sits between impression and click — the attention metrics that tell you where in the ad the viewer disengaged and why.

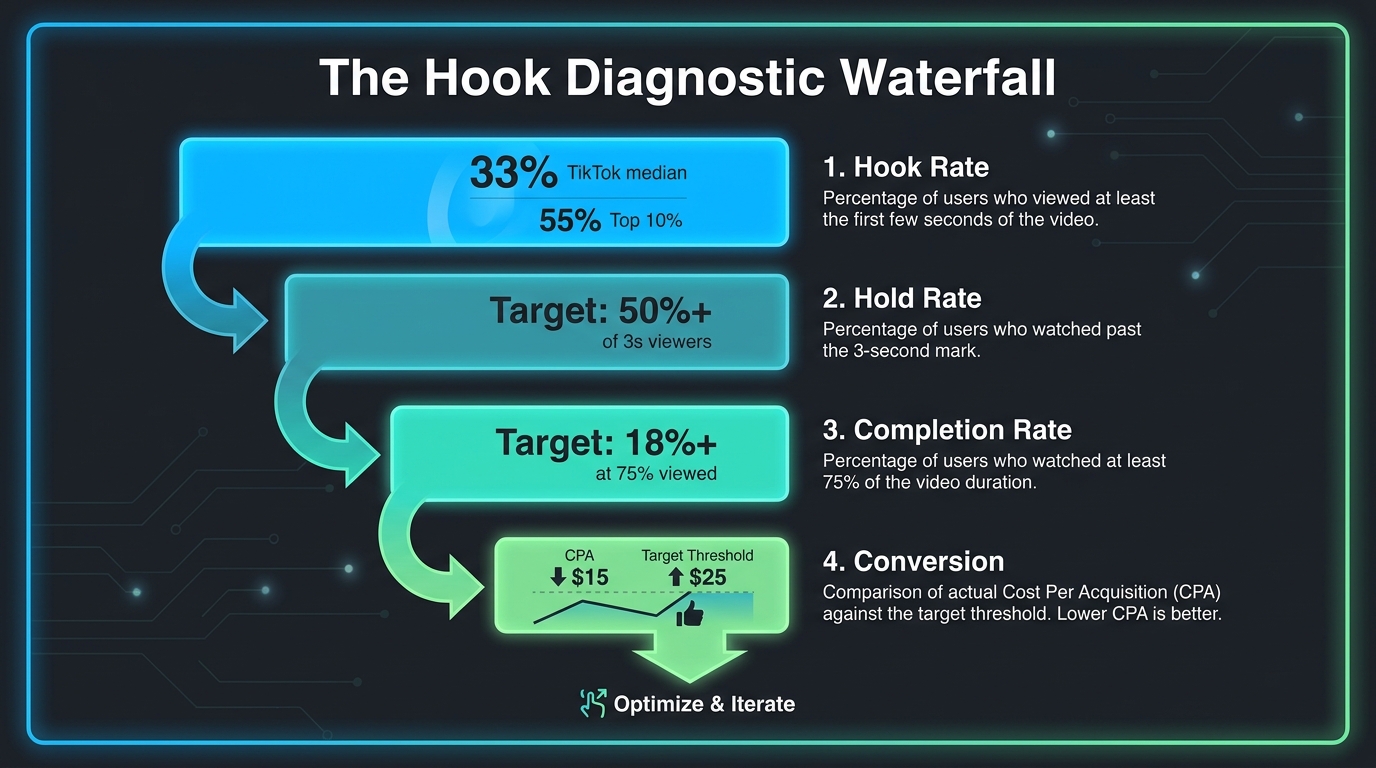
    The correct evaluation framework is a sequential waterfall: four metrics in order, each one revealing a different layer of creative health.

    Stage 1: Hook Rate

    Hook rate is defined as the percentage of impressions that result in at least a 3-second view (on Meta and most SBV placements) or a 2-second view (on TikTok’s native measurement). It is the primary signal for how effectively the opening frame is stopping the scroll.

    2026 benchmarks from multi-account datasets show clear performance tiers across platforms:

    • Meta (Facebook/Instagram): Median hook rate 28%; top 25% clear 37%; top 10% reach 45%
    • Instagram Reels: Median 31%; top 25% reach 40%; top 10% reach 50%
    • TikTok: Median 33%; top 25% reach 44%; top 10% reach 55%

    A hook rate below 25% is a clear signal to rebuild the opening. At that level, the creative is losing approximately three-quarters of its impression pool in the first three seconds — everything downstream is irrelevant because the audience is gone. A hook rate above 40% on Meta or 44% on TikTok places you in the top quartile of performers. That is the threshold where it is worth investing in body and CTA testing.

    Stage 2: Hold Rate

    Hold rate measures what happens after the hook works. It is typically defined as the percentage of 3-second viewers who continue watching to at least 25% of the video’s total length. The target benchmark is 50% or above — meaning at least half of everyone who stayed for your hook should be engaged enough to continue through the proof layer.

    A high hook rate paired with a low hold rate is a specific diagnostic: your hook is compelling, but your body content is not delivering on the promise the hook made. This is one of the most common failure modes in short-form creative — a pattern interrupt or curiosity gap that grabs attention, followed by a generic product demonstration that fails to resolve the tension. The viewer was promised something interesting; they got a catalogue shot.

    Stage 3: Completion Rate

    Completion rate (often measured at the 75% or 100% view mark) indicates whether the narrative arc of your 15-second ad is strong enough to carry viewers to your CTA. The target for 75% completion in a competitive 2026 environment is approximately 18% or above across the total impression pool. Completion rate below 12% suggests a structural problem in the back half of the ad — either the proof layer is too long, the energy drops after the hook, or the CTA is poorly positioned.

    Stage 4: Conversion Signal

    Cost per conversion relative to your target is the final gatekeeper. A creative can clear all three upstream metrics and still fail at conversion if the offer, landing page, or product-market fit is misaligned. Conversely, a creative with a slightly weaker hold rate but strong conversion signal should be retained and iterated — the funnel math may still work.

    The waterfall reads from top to bottom. You diagnose at each stage before drawing conclusions about the creative as a whole.

    The Testing Architecture: Lab Campaigns vs. Scaling System

    Lab versus system creative testing architecture diagram showing discovery lab and scaling system environments with feedback loop for paid social video

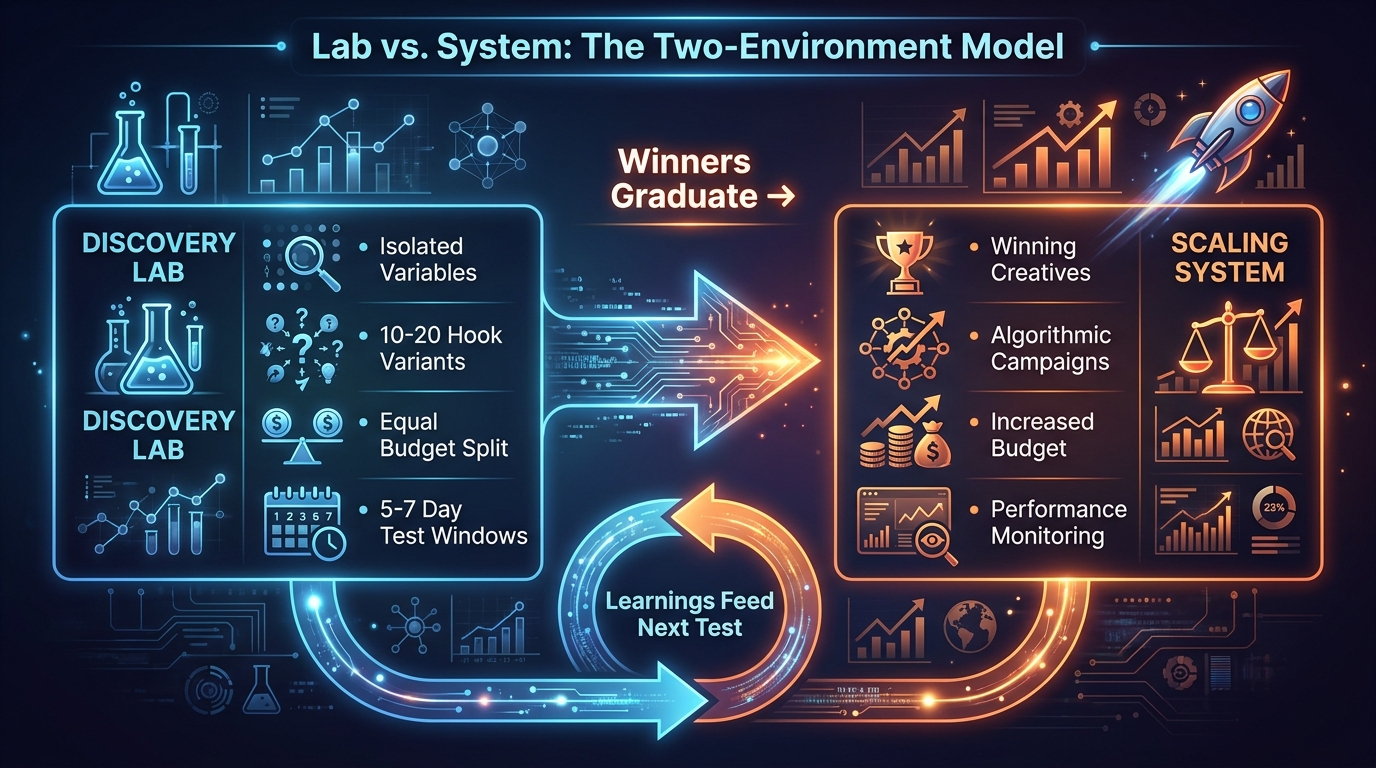
    The structural breakthrough that separates sophisticated SBV testing from casual creative experimentation is the two-environment model: a dedicated Discovery Lab campaign and a separate Scaling System campaign. Running both simultaneously in the same campaign architecture is one of the most common structural errors in paid social creative testing — and it is expensive.

    The Discovery Lab

    The lab is where you find winners. Its defining characteristics are:

    • Strict variable isolation: Only one creative element changes between variants — ideally the hook. Audience, bid strategy, ad format, placement, and offer are held constant across the entire lab campaign.
    • Controlled budget allocation: Equal spend distributed across all variants. If any single creative receives a disproportionate spend share from algorithmic optimisation before the test window closes, the comparison is compromised.
    • Fixed test windows: Five to seven days is the standard testing period for most placements. Shorter windows risk insufficient data; longer windows risk creative fatigue contaminating results.
    • Volume commitment: Effective lab testing requires 10–20 hook variants minimum per cycle. With fewer than 10 variants, the winner that emerges may simply have gotten the most favourable initial impression distribution. With 15–20 variants tested simultaneously, genuine statistical separation becomes visible.

    The Scaling System

    The scaling system is where proven winners live. Creatives that clear your hook rate, hold rate, and conversion thresholds in the lab are ported into consolidated campaigns with full algorithmic optimisation enabled. Here, you want the platform’s machine learning doing what it does best: finding the specific users within your audience who are most likely to convert to that specific creative, and allocating spend accordingly.

    The critical discipline is never introducing untested creative into the scaling system. That is what the lab is for. The system is reserved for creatives that have already demonstrated performance credentials. Mixing tested and untested creative in the same campaign confuses the algorithmic signal and degrades the system’s ability to optimise.

    The Feedback Loop

    The two-environment model only compounds its value over time if learnings flow from the system back into the lab. Every winner in the system tells you something about hook psychology, visual preference, or message framing that should inform the next lab cycle. Teams that treat each testing cycle as independent are leaving the most valuable asset — accumulated creative intelligence — on the table.

    Leading performance creative teams build explicit documentation systems for this: a hook library that records every variant tested, its metric outcomes, and the qualitative hypothesis it was testing. Over three to six months of consistent lab cycling, that library becomes a predictive resource. You stop guessing which hook types will resonate and start making educated directional bets based on what your specific audience has already rewarded.

    Structuring a 15-Second Creative for Maximum Hook Power

    Anatomy of a 15-second video ad hook timeline showing three segments: 0-3 seconds hook, 3-10 seconds proof layer, and 10-15 seconds CTA anchor with viewer attention curve

    Knowing what hook types work and understanding the metrics are necessary conditions for SBV testing excellence. But the structural architecture of the 15-second creative itself — how the seconds are allocated, what each segment must accomplish, and how the components interact — is what determines whether good hook theory translates into good hook execution.

    Seconds 0–3: The Commitment Frame

    This window exists for one purpose: to earn the next twelve seconds. It does not need to explain the product. It does not need to establish brand credibility. It does not need to demonstrate the full value proposition. It needs to create a state of curiosity, recognition, or disruption that makes stopping feel like a loss.

    Operationally, this means your most powerful visual asset, your most specific claim, your most dramatic moment — whatever that is for your product — goes here. Not in the middle. Not as a payoff. Here, in the first three seconds, where most of your audience will still be watching. The instinct to “build up” to the good part is the creative instinct that kills SBV performance. There is no building up. There is only the good part, placed at the front.

    For Amazon SBV specifically: the product should appear on screen within the first two seconds. Amazon’s own research shows that CTR rises materially as view length increases past the five-second mark — but you only reach five seconds if you earned seconds one through four with a compelling visual hook. Show the product, show the outcome it delivers, or show the problem it solves. Do it immediately.

    Seconds 3–10: The Proof Layer

    The proof layer is where you honour the promise the hook made. If your hook was a curiosity gap (“The one thing dermatologists never tell you about daily SPF”), seconds 3–10 must deliver the promised insight — not tease it further, not digress, but deliver it clearly and specifically. Betraying the hook’s implied contract is the fastest route to a low hold rate despite a high hook rate.

    Effective proof layers use one or more of three structural elements: a product-in-use demonstration that shows the mechanism of action, a specific data point or social proof signal that validates the claim, or a transformation visual that makes the outcome tangible. The best-performing 15-second SBV creatives use all three compressed into seven seconds. That requires tight scripting and intentional visual sequencing — every frame earns its place or gets cut.

    Seconds 10–15: The Anchor

    The anchor closes the loop opened by the hook and directs the viewer toward the next action. In 15-second creative, this is not a traditional call-to-action sequence — there is not enough time for elaborate instruction. The anchor is a reinforcement of the core claim plus one direct action directive: “Shop now,” “Learn more,” “Try it today.” Simple, specific, and tied back to the opening frame’s promise.

    A common anchor error is introducing new information in the final five seconds — a secondary benefit, a disclaimer, a brand history statement. This creates cognitive interference at the exact moment the viewer is being directed toward conversion. The last five seconds should feel like a resolution, not a new chapter. Reinforce what you already said, name the action, and get out.

    UGC vs. Polished Creative in SBV Testing

    A consistent finding in 2026 performance creative data is that UGC-style vertical video — creator-shot, lower production value, native to the feed context — outperforms studio-produced polished creative on most performance metrics across Meta, TikTok, and Reels placements. Short-form vertical video under 30 seconds now drives approximately 78% of top-performing e-commerce campaigns across these platforms, with UGC skewing heavily within that segment.

    The mechanism is not mysterious. UGC looks like the content around it. It passes the first-frame pattern matching test that most ads fail — rather than immediately registering as an interruption, it blends into the feed’s native aesthetic long enough for the hook’s actual content to register before the viewer’s advertising filter activates.

    The caveat is fatigue velocity. UGC-style content fatigues faster than polished creative because the format’s novelty is lower — audiences in high-impression-frequency environments see similar-looking content repeatedly and begin dismissing it passively. This makes high-velocity creative production a non-negotiable complement to the UGC strategy. If you are running UGC-style hooks, you need a pipeline of new variants, not a single winner you milk until performance collapses.

    The Kill/Keep/Scale Decision Framework

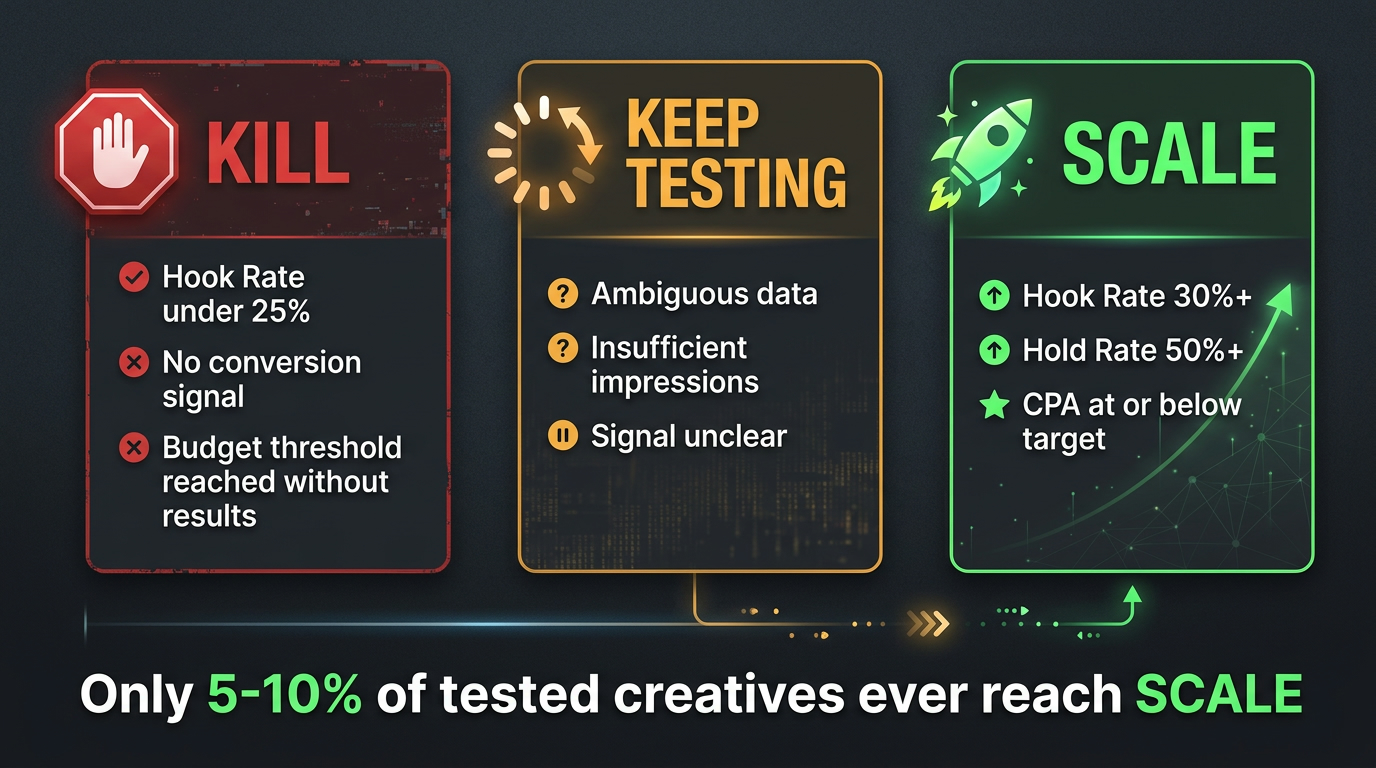
    Kill keep scale decision framework for creative testing showing three columns with criteria for killing, continuing to test, or scaling video ad creatives

    The decision architecture for SBV creative outcomes is the element most often left informal — a gut-feel call made by whoever is looking at the dashboard that day. Formalising it into explicit, pre-agreed thresholds removes the subjectivity that allows poor performers to survive and borderline winners to be cut prematurely.

    Kill: When to Stop Spending

    A creative should be killed when it fails one or more of these conditions:

    • Hook rate falls below 25% after a meaningful impression volume (minimum 1,000–2,000 impressions depending on spend).
    • Cost per conversion exceeds your target threshold by 40% or more, and the trend shows no improvement over the test window.
    • The creative reaches your pre-defined spend threshold (typically 1–2× your target CPA for the first data decision point) without generating a single conversion.

    The discipline here is speed. Most under-performing creatives are kept alive far longer than the data justifies, either because the creative took effort to produce or because the team is not aligned on kill criteria. Pre-define these thresholds before the test begins, not after results come in. A threshold agreed in advance is a rule. A threshold decided after seeing results is a rationalisation.

    Keep Testing: Ambiguous Data States

    Some creatives live in a genuinely uncertain zone — hook rate in the 26–30% range, conversion signal present but statistically thin, hold rate marginal. These warrant continued testing at a controlled budget rather than a hard kill or premature scale decision. The holding pattern has a defined end point: a pre-agreed impression or spend threshold beyond which you will make a final call regardless of how ambiguous the signal remains.

    The ambiguous zone is where many teams stall. They keep creatives alive indefinitely because they cannot commit to a kill, spending modest budget continuously without ever generating enough data for a real decision. Building an explicit “keep testing” budget ceiling — beyond which the decision becomes kill — eliminates this failure mode.

    Scale: When Winners Earn More Budget

    A creative is ready to scale when it clears all of these:

    • Hook rate at or above 30% (Meta/SBV) or 33%+ (TikTok).
    • Hold rate at 50% or above of 3-second viewers continuing to the 25% watch mark.
    • Cost per conversion at or below your target, with a stable or improving trend.
    • Sufficient impression volume to trust the signal (typically 3,000+ impressions and 5+ conversions for directional confidence).

    When these criteria are met, the creative moves from the lab into the scaling system with a meaningful budget increase. The key discipline at this stage is monitoring for fatigue: even genuine winners have a performance lifecycle. On TikTok and Meta, high-frequency placements can fatigue a winning creative in as little as two to three weeks. Watch the hook rate trend daily during scale. A declining hook rate on a previously strong creative is the earliest signal that fatigue is setting in, well before CPA deterioration becomes visible.

    The 5–10% Reality

    The most grounding benchmark in SBV creative testing is this: across structured testing programmes, only 5–10% of tested creatives become true scale-ready winners. That is not a failure rate — it is the expected outcome of a functioning test system. The implication is clear: the input volume of creative variants you feed into the lab must be high enough that 5–10% of winners still constitutes a meaningful, scalable creative portfolio. If you are running five variants per test cycle, a 10% winner rate gives you half a winner per cycle. If you are running 20 variants per cycle, it gives you two winners.

    Volume in testing is a multiplier on the entire system. It is the variable that most teams underinvest in because production feels expensive — and it feels expensive because teams are still producing full-length, highly polished ads rather than lean, hook-focused variants designed specifically for testing.

    Creative Fatigue and Velocity: The Hidden Bottleneck

    The operational challenge that follows a successful SBV testing programme is one that most teams do not anticipate until they hit it: you need a continuous supply of new hook variants. Winning a test is not the endpoint. It is the beginning of a race against fatigue.

    How Fatigue Works in Practice

    Creative fatigue in paid social video has a specific signature. Hook rate begins declining — typically 5–10 percentage points below the creative’s initial performance — while the ad’s completion rate and conversion metrics remain relatively stable. This is the early warning window: the opening frame has been seen enough times by enough of your audience that its novelty has worn off, but the body of the ad still performs for those who make it through.

    The correct response at this stage is not to kill the creative but to test new hooks against the same proven body. This is the compounding efficiency of modular creative production: because your body layer was already validated, you do not need to re-test it. You only need new opening frames — a much lower production effort than rebuilding the entire creative.

    Building a Creative Pipeline

    The teams winning in SBV creative testing in 2026 are not running campaigns. They are running production pipelines. The distinction matters: a campaign mindset produces one creative at a time, launches it, evaluates it, and then produces the next one. A pipeline mindset maintains a continuous backlog of hook variants in production, in testing, and in rotation, with explicit replenishment triggers.

    A basic pipeline looks like this: for every creative currently in the scaling system, maintain three to five new hook variants in the lab at any given time. When a scaling creative shows early fatigue signals (hook rate declining for two consecutive reporting periods), a replacement should already be in the lab pipeline — not being briefed for production. Two to three weeks of lead time between briefing a new hook variant and having tested performance data is standard. That lag is the gap that kills performance for teams without a pipeline.

    AI-Assisted Hook Variation

    The most significant structural change in SBV creative production in 2026 is the integration of AI-assisted variation generation into the hook testing workflow. AI tools are now being used at several points in the process: generating alternative hook scripts from a single winning hook concept, producing text overlay variations at volume, and creating preliminary visual treatments that can be rapidly tested before committing to full production.

    The practical effect is a dramatic compression of the production timeline for testing variants. Where producing 20 distinct hook variations might previously have required a week or more of creative team capacity, AI-assisted production can compress that to one to two days for the scripting and text-based variation layer. This does not eliminate the need for human creative judgment — the best AI-assisted hook programmes still use human reviewers to filter generated variants for brand appropriateness and strategic alignment — but it breaks the production bottleneck that previously limited testing volume.

    Amazon SBV-Specific Considerations for Hook Testing

    While the broader principles of hook testing apply across platforms, Amazon Sponsored Brands Video has specific constraints, measurement tools, and behavioural context that require particular attention in how you design and evaluate your testing programme.

    The Search Intent Context

    Amazon SBV ads appear in search results — immediately above or below organic listings for keywords you are bidding on. This placement context is fundamentally different from TikTok or Meta, where ads interrupt an entertainment or social browsing state. On Amazon, the viewer is in an active purchase consideration mode. They searched for something, and your ad appears in their results.

    This changes the optimal hook strategy in a specific way: the most effective Amazon SBV hooks are relevance-confirming rather than purely attention-grabbing. A pattern interrupt that might work brilliantly on TikTok — an unexpected visual that has nothing obvious to do with the product category — can create confusion in a search context where the viewer has a specific intent already activated. The Amazon SBV hook needs to confirm category relevance in the first frame, then differentiate. Show the product, show the problem it solves, then earn attention through specificity and proof — in that order.

    Amazon’s View-Through Metrics for Testing

    Amazon’s reporting tools have evolved to give SBV advertisers clearer hook-level diagnostic data through quartile view rates. These metrics show what percentage of your impression pool reached each 25% mark of the video — essentially a coarser version of the hold-rate measurement used on Meta and TikTok. For hook testing on Amazon, the critical metric is the 25% quartile view rate: what percentage of impressions watched past the initial hook frame.

    Agency practitioners running structured Amazon SBV tests use 10–14 day test windows, equal spend allocation across variants, and the 25% quartile view rate as the primary hook performance signal. Amazon’s CTR data provides the conversion-funnel signal: multiple analyses confirm a notable CTR lift for viewers who watch past the five-second mark compared to those who drop before it. That lift represents the commercial value of a hook that holds attention through the proof layer’s initial beat.

    Technical Specifications That Affect Hook Design

    Amazon SBV ads have a defined display area in search results — the video plays in-line with a product title and star rating visible below it. This means the bottom portion of your video frame is partially obscured by the product information panel. Design your most critical hook text overlays to appear in the upper two-thirds of the frame to ensure they are not cut off by the product information display.

    Video length for Amazon SBV runs from 6 to 45 seconds, but 15 seconds is the dominant performing format for testing and initial creative launches. Ads under 15 seconds avoid the mid-roll drop-off that longer formats experience while still providing enough time for the three-part hook/proof/anchor structure to operate effectively.

    The Compound Effect of Systematic Hook Testing

    The individual creative wins — a hook variant that beats its control by 40% on hook rate — are valuable in isolation. But the cumulative value of a systematic SBV creative testing programme is qualitatively different from the sum of its individual test results. The compound effect is what separates brands that run creative testing from brands that have a creative testing system.

    The Learning Flywheel

    Each hook test answers a question about your audience’s psychology. Does this audience respond to outcome-showcase hooks more than frustration-led hooks? Does a direct problem statement outperform a curiosity gap for this product category? Does UGC-style opening footage retain more viewers than a polished product shot for this price point?

    These questions are not answerable through intuition or industry benchmarks. They are answerable only through systematic testing against your specific audience with your specific product. And every test cycle that adds to your hook library compounds the accuracy of your directional hypotheses for the next cycle. By the end of month three of a disciplined testing programme, you are not starting from zero with each new hook concept — you are building on a documented understanding of what your audience has already told you it responds to.

    Before and After: What Hook Rewrites Actually Do

    Consider the before/after arc of a typical hook optimisation across a 60-day testing cycle. A brand launches its initial SBV campaign with a hook built around the founder’s story — a story-tease open that feels authentic and engaging to the team that made it. The hook rate lands at 22% on Meta. The hold rate is reasonable at 48%, suggesting the body of the ad works for the people who stay through the opening. But 78% of the impression pool is leaving before the story has a chance to land.

    Testing cycle one introduces five new hook variants: a product-outcome showcase with a specific result claim, a frustration-led open naming a category pain point, a curiosity gap built around expert positioning, a polarising claim about a conventional category approach, and a pattern interrupt using unexpected motion in the first frame. After seven days at equal spend, the outcome-showcase and frustration-led hooks both clear 32% hook rate — a 45% improvement over the original. The curiosity gap reaches 29%. The other two are killed.

    Testing cycle two takes the two proven hook mechanics and tests six variations of each — different result claims, different problem statements, different visual executions of the same structural type. The best variant from this cycle reaches 38% hook rate, landing in the top quartile for the platform. It gets ported to the scaling system. The brand’s cost per conversion drops by approximately 28% from the original campaign baseline, driven almost entirely by the improvement in impression-to-engagement conversion in the first three seconds of the ad.

    That is what hook testing does at the operating level. Not incremental creative improvement. Compounding structural efficiency, built one three-second frame at a time.

    Building Creative Intelligence as a Competitive Moat

    The final compounding effect of systematic hook testing is competitive. The hook library you build over six months of structured SBV testing — what hook types work for your category, which emotional triggers your audience responds to, which visual patterns hold attention — is not publicly available. Your competitors cannot see your test results. They cannot see your hook rate data. They can see your ads, if they are paying attention, but they cannot see the systematic learning that produced them.

    This is one of the few genuine information advantages still available in performance digital advertising. Platform algorithms are increasingly commoditised — everyone is bidding on the same audiences with the same tools. The creative itself, and the organised intelligence behind it, is where differentiated performance comes from. A brand that has run 200 hook tests over 12 months has a fundamentally different information asset than a brand that has run 10.

    What a Functional SBV Testing Programme Looks Like Week by Week

    Translating the framework into operational reality requires a weekly cadence with clear ownership, defined deliverables, and non-negotiable data review points. Here is what a functioning SBV creative testing operation looks like in practice.

    Week 1: Lab Setup and Baseline

    Launch the discovery lab campaign with 10–15 hook variants. Set equal budget allocation. Define your test window end date (day 5–7). Brief the next batch of hook variants for production so they are ready to enter the lab before the current cycle closes. Establish the kill/keep/scale thresholds in writing, agreed by all stakeholders before results come in.

    Week 2: First Data Review and Kill Decisions

    At the test window close, review all variants against the diagnostic waterfall. Kill variants with hook rate below 25% and no conversion signal. Flag ambiguous performers with their data status and a spend cap for a continued watch period. Identify any variants clearing 30%+ hook rate for potential scaling.

    Week 3: Scale Winners and Launch Next Cycle

    Port qualifying winners into the scaling system. Launch the next batch of hook variants in a fresh lab cycle. Begin building new hook variants for the following cycle based on learnings from cycle one — which hook types outperformed, which emotional angles resonated, which visual patterns achieved the highest hook rate.

    Ongoing: Fatigue Monitoring and Pipeline Replenishment

    Check hook rate trends on all scaling creatives weekly. When any scaling creative shows a two-period declining hook rate trend, accelerate the next lab cycle to ensure replacement candidates are in pipeline. Document every test result — variant description, hook type, metric outcomes, and qualitative hypothesis being tested — in a shared hook library. Review the library monthly for emerging patterns that should inform the next briefing cycle.

    The Mindset Shift That Makes SBV Testing Work

    Every principle in this article rests on a single underlying premise that is harder to internalise than it sounds: you are not in the business of making great ads. You are in the business of finding great hooks at volume, systematically, using data rather than intuition.

    Great ads, in the traditional creative sense, are one-off achievements. They require exceptional creative instinct, expensive production, and favourable market timing. The SBV testing framework produces something less poetic and more reliable: a repeatable process for identifying which 3-second opening frames resonate with a specific audience, at a specific moment, in a specific placement context — and then capitalising on that knowledge before the signal decays.

    The teams that execute this well share a specific characteristic: they are comfortable with the math of failure. In any given lab cycle, 90–95% of what they produce will not scale. They accept that before they start. They design their production pipeline to absorb that failure rate without friction. And they know that every failed test is not a sunk cost — it is a data point in the hook library, a question answered, a direction eliminated, a future decision made faster.

    Actionable Takeaways

    1. Audit your current SBV creative for hook rate. If you are not measuring hook rate (3-second view rate ÷ impressions), add it to your reporting dashboard immediately. It is the single most actionable early diagnostic available to you.
    2. Run a hook-only test cycle. Keep your best-performing body and CTA content constant. Test 10–15 different opening frames, each representing a different hook type from the taxonomy above. Let the data identify your highest-performing category.
    3. Design for muted viewing first. Before launching any SBV hook, watch it on mute and ask: does this communicate clearly enough to earn continued viewing without audio?
    4. Formalise your kill/keep/scale thresholds. Write them down. Agree on them with your team before the campaign launches. Do not negotiate with data after results come in.
    5. Build a hook library. Document every test result. After three months, patterns will emerge that are specific to your product and audience — and those patterns are more valuable than any external benchmark.
    6. Calculate your required production volume. If 5–10% of tested hooks become scale-ready winners, and you need two to three winners active at any time to maintain performance, work backward from those numbers to determine how many hook variants you need to produce per month. Then build a pipeline that reliably produces that volume.

    The first 15 seconds of your video ad are not a creative challenge. They are a data problem. And data problems, unlike creative challenges, have systematic solutions. Build the system. Run the tests. Let the hooks tell you what your audience wants — before the algorithm makes that decision for you.