Tag: SBV

  • Why Most Sellers Are Using Amazon’s SBV Video Generator Wrong — And What the Data Actually Shows

    Why Most Sellers Are Using Amazon’s SBV Video Generator Wrong — And What the Data Actually Shows

    Amazon’s SBV Video Generator has been available to U.S. sellers since its broader rollout, and by mid-2026 it expanded to Canada, India, Mexico, France, Germany, Italy, Spain, and the UK. It’s free. It’s built directly into the Amazon Ads console. It generates up to six ad-ready video variants from a single ASIN in minutes.

    And yet the majority of sellers using it are doing so in a way that leaves significant performance on the table.

    The problem isn’t the tool. Sponsored Brands Video consistently benchmarks at a 0.89%–1.0% CTR — approximately 2.6 times higher than static Sponsored Brands ads — and a conversion rate around 11.2%, roughly 13% better than image-based alternatives. ACoS frequently runs 15–45% lower than Sponsored Products in well-managed accounts. The format demonstrably works.

    The gap is between access and execution. Most sellers either treat the generator as a one-and-done production tool, misunderstand how the ad actually renders in a live shopping environment, or apply a brand-storytelling framework to a format that demands conversion logic. Those mismatches compound quietly — producing campaigns that spend budget, generate impressions, and deliver mediocre returns that get blamed on the format instead of the execution.

    This piece is about closing that gap. We’ll cover what the tool actually does under the hood, the muted-autoplay reality that changes everything about creative structure, how to use the six-variant output as a genuine testing engine, what targeting configurations actually work, and how to build a campaign stack that moves from test to scale without blowing your budget in the process.
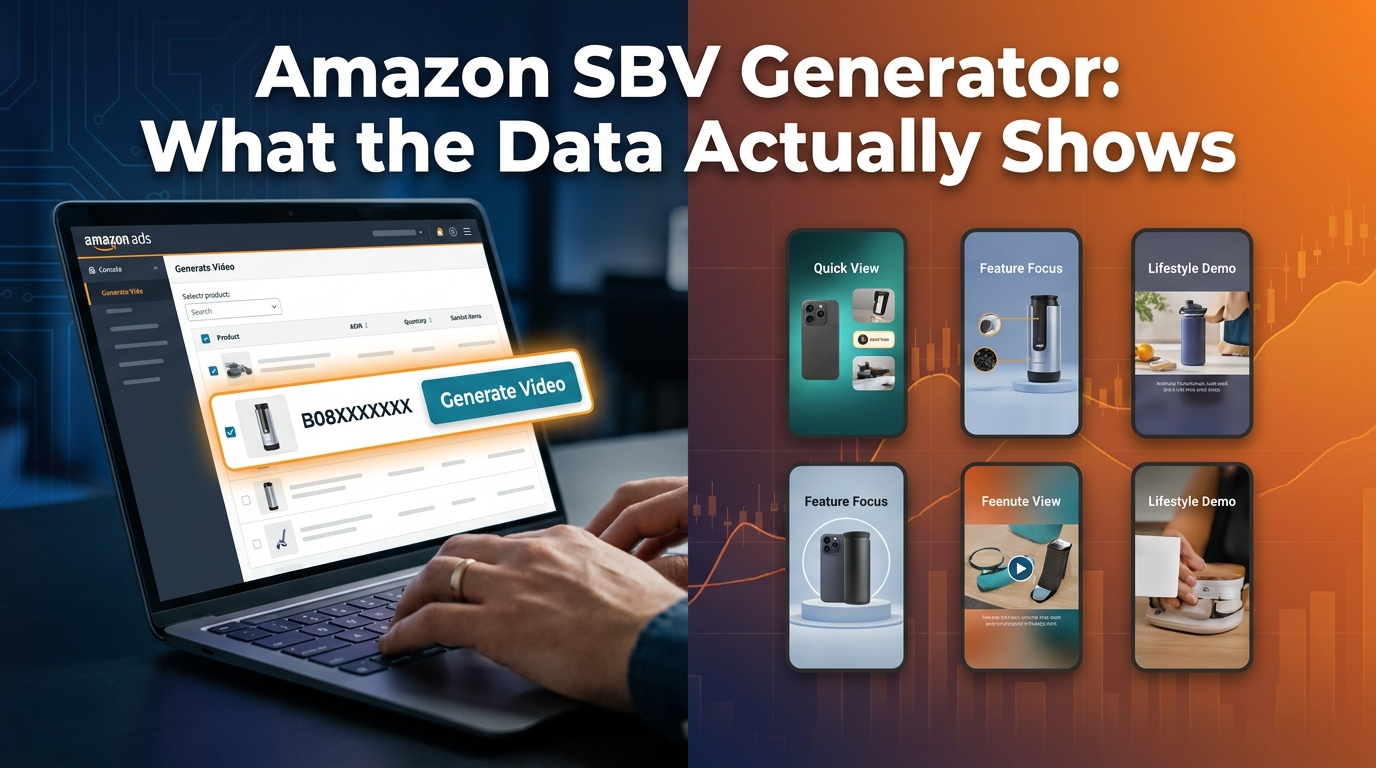
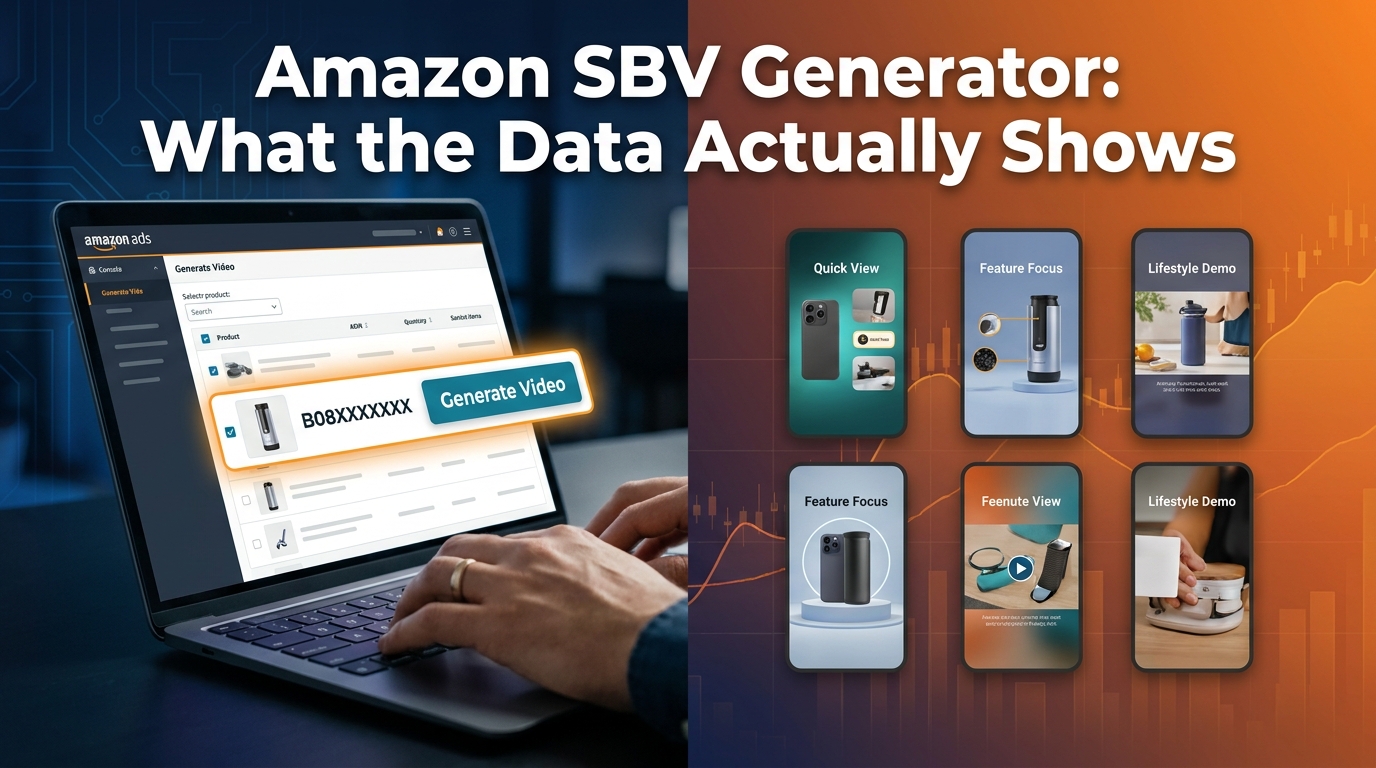
    Amazon SBV Video Generator workflow showing ASIN selection and six AI-generated video variants in the Amazon Ads console

    What the SBV Video Generator Actually Does (Beyond the Marketing Copy)

    Amazon’s official description of the Video Generator is that it “creates ad-ready videos from a product image or ASIN in minutes.” That’s accurate but incomplete. Understanding the mechanics matters because the tool’s architecture shapes what you can and can’t optimize from the output.

    The Input-to-Output Pipeline

    The generator works by pulling structured data from your product detail page — title, bullet points, primary images, and brand name — and feeding that into a multi-scene video construction model. It’s not simply animating your main listing image. The updated model, which Amazon began rolling out in 2026, now includes enhanced motion shot generation: the ability to take a still product image and synthesize realistic in-use motion, including scenes featuring people and pets where contextually appropriate.

    The result is six 15-second video options, each built around a different scene composition, text animation style, or product emphasis. Some variants will lead with the product floating in a clean environment. Others will show the product in use or place it in a lifestyle context derived from your listing’s imagery and copy. You don’t control which six you get before generation — but you do get to choose which one to deploy, and you can regenerate if none of the initial set is usable.

    What You Can Customize Post-Generation

    Inside Creative Studio, after generation, you have editing access to several elements: headline copy, font selection, logo placement, color palette adjustments, and to a degree, music selection. What you can’t do is restructure the core video timeline or re-sequence the motion scenes. The generated video comes as a pre-built sequence. You’re working with the frame, not the architecture.

    This matters strategically. It means your primary lever for differentiation isn’t in-editor customization — it’s in what you feed the tool going in. Listings with richer imagery, more specific bullet point copy, and cleaner product photography produce measurably stronger generator outputs. A listing with a single white-background hero image and generic bullet points will produce six variants that look nearly identical to each other. A listing with multiple contextual lifestyle images and specific benefit-driven bullet points gives the model more material to work with, and the output variance across the six variants increases meaningfully.

    Video Summarization and Upload Pathways

    The generator also supports a second input pathway: you can upload an existing video clip, and the tool will summarize it into an ad-ready shorter format. This is particularly useful for brands that have product demo footage from external shoots or UGC content. Rather than treating the generator as purely a creation tool, treating it as a compression and formatting tool for existing assets opens up a different use case — one that combines the polish of professionally shot footage with the speed of AI-assisted editing.

    The key spec boundary: the output needs to fit within the 6–45 second window (Amazon recommends 20 seconds or less, with 15 seconds being the sweet spot), and must meet the 16:9 aspect ratio, MP4/MOV format, and H.264/H.265 codec requirements before it can be submitted for review.

    The Muted Autoplay Reality: Why Audio Is a Red Herring
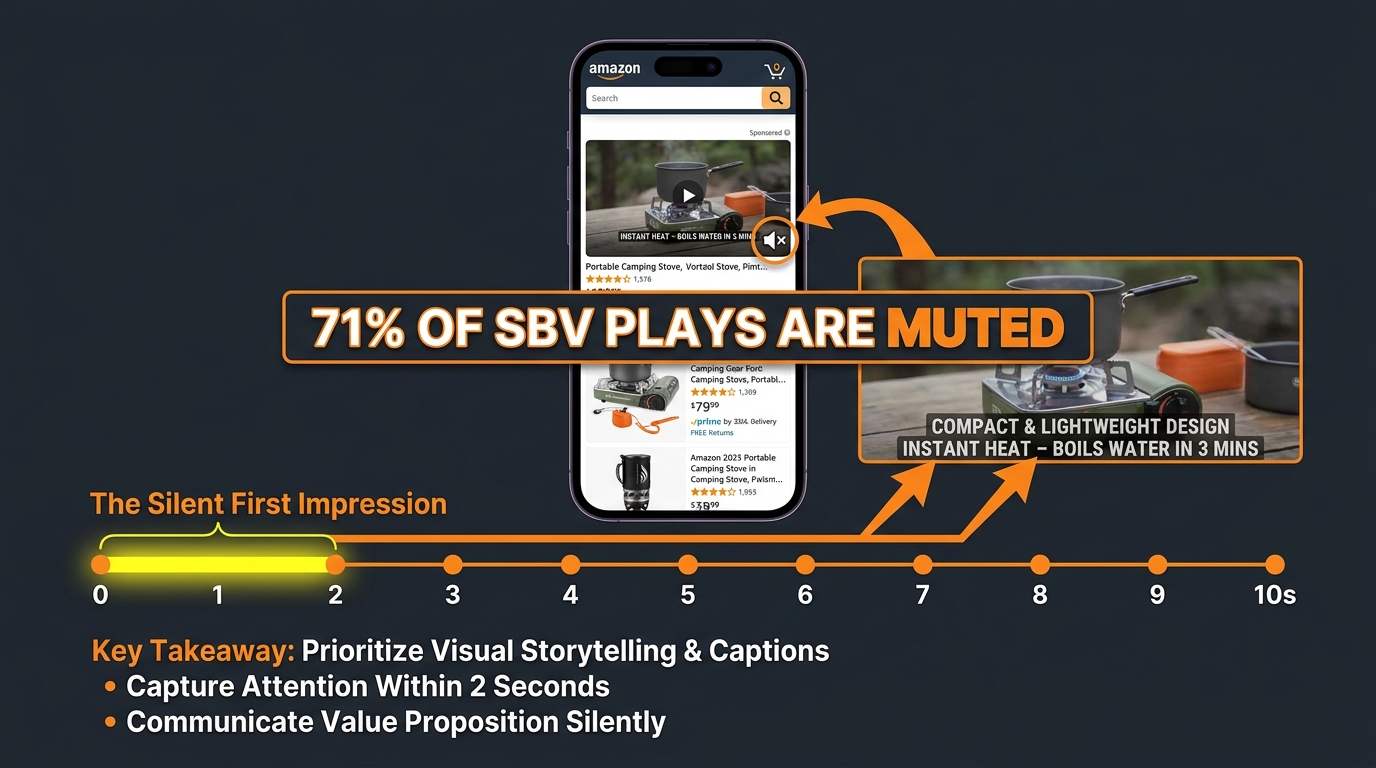
    Smartphone showing Amazon search results with muted SBV ad playing, stat overlay showing 71% of SBV plays are muted in 2026

    This is the single most consequential thing most sellers get wrong about SBV creative strategy, and it’s almost never discussed at the campaign-setup level.

    Amazon Sponsored Brands Video ads autoplay muted by default. Sound only activates if a shopper explicitly taps the mute toggle. By 2026, approximately 71% of all SBV plays are muted — up from an estimated 64% in 2024. That number is going in one direction as mobile shopping continues to grow and as shoppers increasingly browse Amazon in contexts where audio is socially inappropriate (commuting, offices, shared spaces).

    The practical implication is stark: if your SBV creative relies on a voiceover to communicate your product’s key benefit, you are communicating nothing to more than seven in ten people who see your ad. The voiceover isn’t a backup — it’s the primary communication channel for most professionally produced videos. And it’s inaudible for the majority of your impressions.

    What “Mute-First” Creative Actually Means

    Designing for muted autoplay isn’t just about adding subtitles to an existing video. It requires rethinking the entire communication hierarchy. In a muted environment, the following elements carry 100% of the message:

    • The first frame: What does the shopper see in the literal first second before they decide to keep scrolling or watch?
    • Motion quality: Is the movement interesting enough to slow the scroll even without audio cues?
    • On-screen text overlays: These are not supplemental. They are the primary copy channel.
    • Product visibility: Is the product large, clear, and unambiguous in the frame?

    Amazon’s generator, when working well, builds text animation into the video structure by default. But the default text it pulls is often the product title — which is typically optimized for keyword indexing, not for human readability in a 2-second window. Sellers who accept the default title as their on-screen headline are missing an opportunity. The headline field in Creative Studio is where your actual conversion hook lives. It should answer the question a high-intent shopper is implicitly asking when they search for your product: not “what is this?” but “why this one?”

    The Captions Question

    Amazon recommends closed captions for SBV, and they’re worth adding — but captions are not a substitute for strong on-screen text design. Captions are small, typically rendered at the bottom of the frame, and read at audio pace. On-screen text overlays, by contrast, can be sized, positioned, and timed for impact. The most effective SBV creatives use large, high-contrast overlay text (think 3–4 words maximum per card) that communicates the key benefit independent of any audio track. Captions handle the audio transcript. The overlay text handles the persuasion.

    For sellers using the Video Generator, this has a specific tactical implication: after generation, open the Creative Studio editor and review every text element for muted readability. Ask whether someone scrolling at normal speed, with no audio, would understand within two seconds what the product is and why they should click. If the answer is no, you have editing work to do before launch.

    The 15-Second Architecture: How to Structure Every Frame
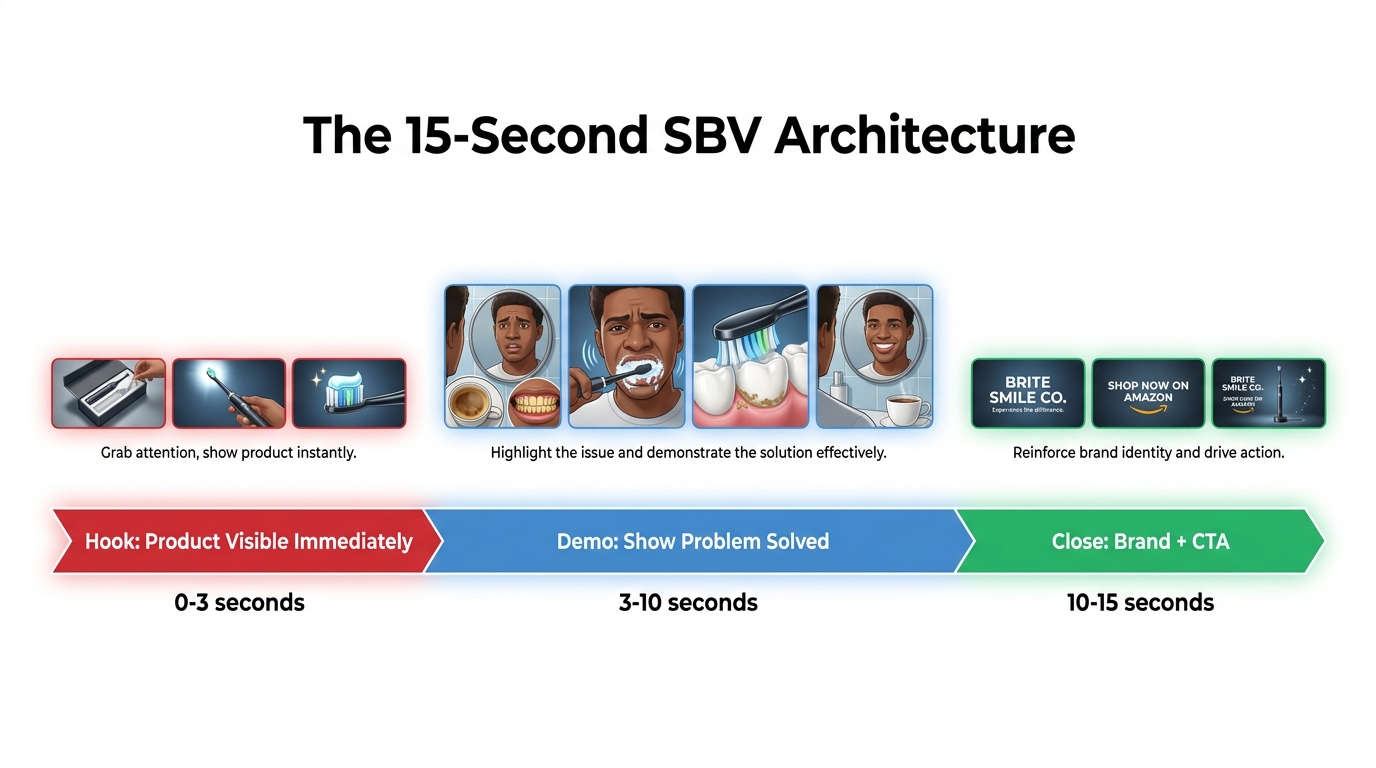
    Diagram showing the ideal 15-second Amazon SBV video structure divided into three phases: Hook (0-3s), Demo (3-10s), and Close with CTA (10-15s)

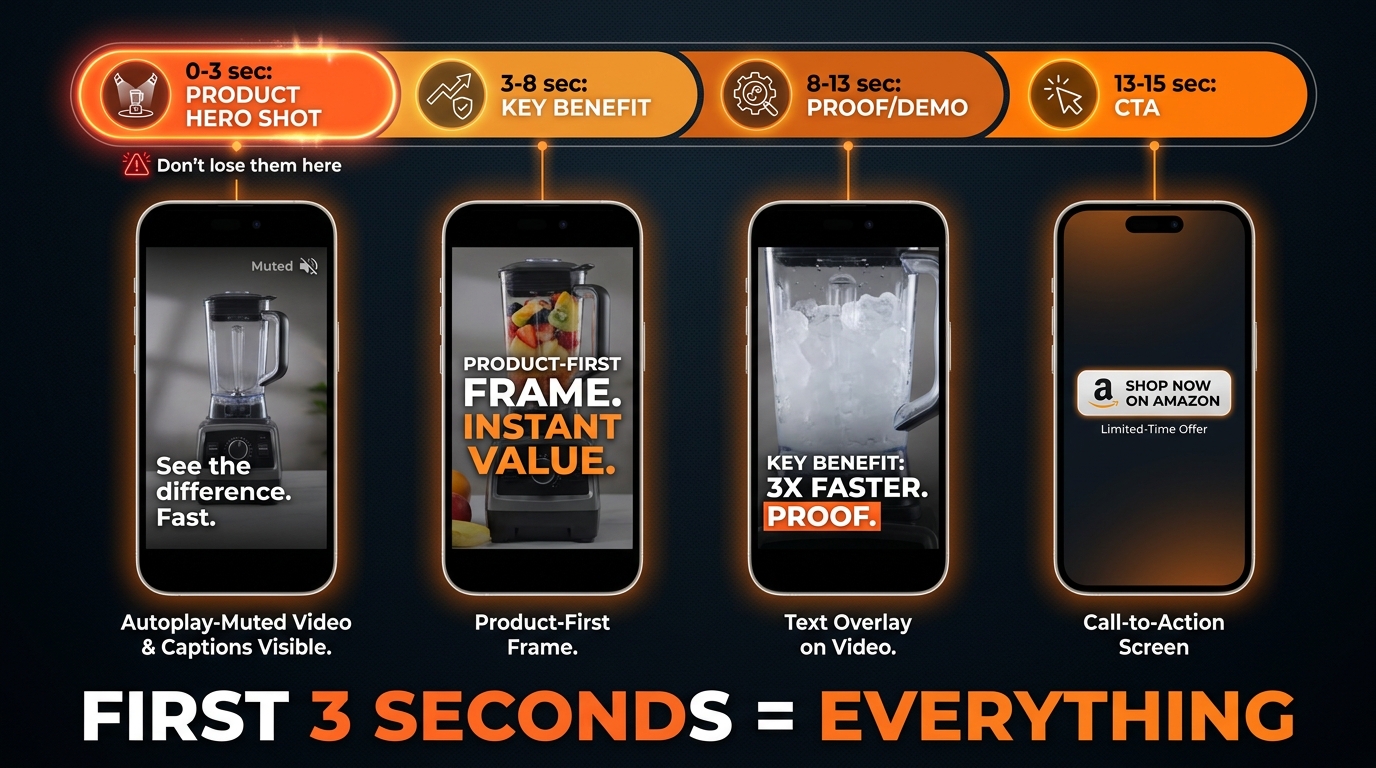
    Amazon’s own guidance says to show the product within the first two seconds and its function within the first five. Those aren’t aspirational suggestions — they’re based on drop-off data from the platform’s video analytics. Shoppers who don’t see a clear product in the opening seconds scroll past. The decision to engage or continue happens almost immediately.

    The 15-second window isn’t just a technical constraint. It’s a communication architecture. When you approach it structurally, every second has a job.

    Seconds 0–3: The Hook

    The hook’s only job is to stop the scroll and establish what the product is. Not what it’s great at, not who makes it, not a brand logo. The product, clearly visible, in a context that signals relevance to the shopper’s search. If they searched for “insulated water bottle,” they need to see a water bottle — not a lifestyle scene that eventually reveals a water bottle.

    The most common mistake in this window is the brand intro. Opening with a logo animation or a brand name card is a pattern inherited from broadcast television, where audiences are captive. Amazon shoppers are not captive. A logo intro in the first three seconds is a conversion killer because it communicates nothing to a shopper who doesn’t already know your brand — and the shoppers you need to convince are precisely those who don’t know you yet.

    The Video Generator, by default, sometimes produces logo-first or lifestyle-first openings depending on how it interprets your listing data. This is one of the most important things to check and, if necessary, edit or regenerate before launch.

    Seconds 3–10: The Demo or Proof Point

    This is where you show the product doing something, or solving something, or being used in a way that makes the key benefit tangible. The enhanced motion shot feature in the updated Video Generator is particularly valuable here — for products that benefit from in-use demonstration (tools, kitchen gadgets, fitness equipment, skincare, pet products), an AI-generated motion sequence showing the product being used can be more persuasive than a static lifestyle image.

    If you have multiple key differentiators, this seven-second window can handle two of them — but only if the transitions are clean and the text overlays are distinct and readable. Cramming three or four proof points into this section results in nothing landing. Discipline matters. Pick the one or two benefits that match the search intent of the keywords you’re targeting, and let those breathe.

    Seconds 10–15: The Close

    The close doesn’t need to be elaborate. A clean product name, a brief brand logo appearance (here, not at the start), and optionally a single CTA phrase (“Shop Now,” “See All Sizes,” or a specific proof point like “4.7 Stars, 12,000 Reviews”). Shoppers who have watched to this point are already engaged — they don’t need to be convinced again. They need to be directed.

    One frequently missed opportunity in the close: if your product has a strong social proof number (review count, star rating, or a bestseller badge), surfacing it in the final seconds adds measurable conversion weight. Unlike a landing page where shoppers actively look for this information, an SBV ad controls the information sequence. Putting your strongest proof point at the end, after the interest is established, is structurally sound.

    Six Variants, One Strategy: Using the Generator as a Creative Testing Engine
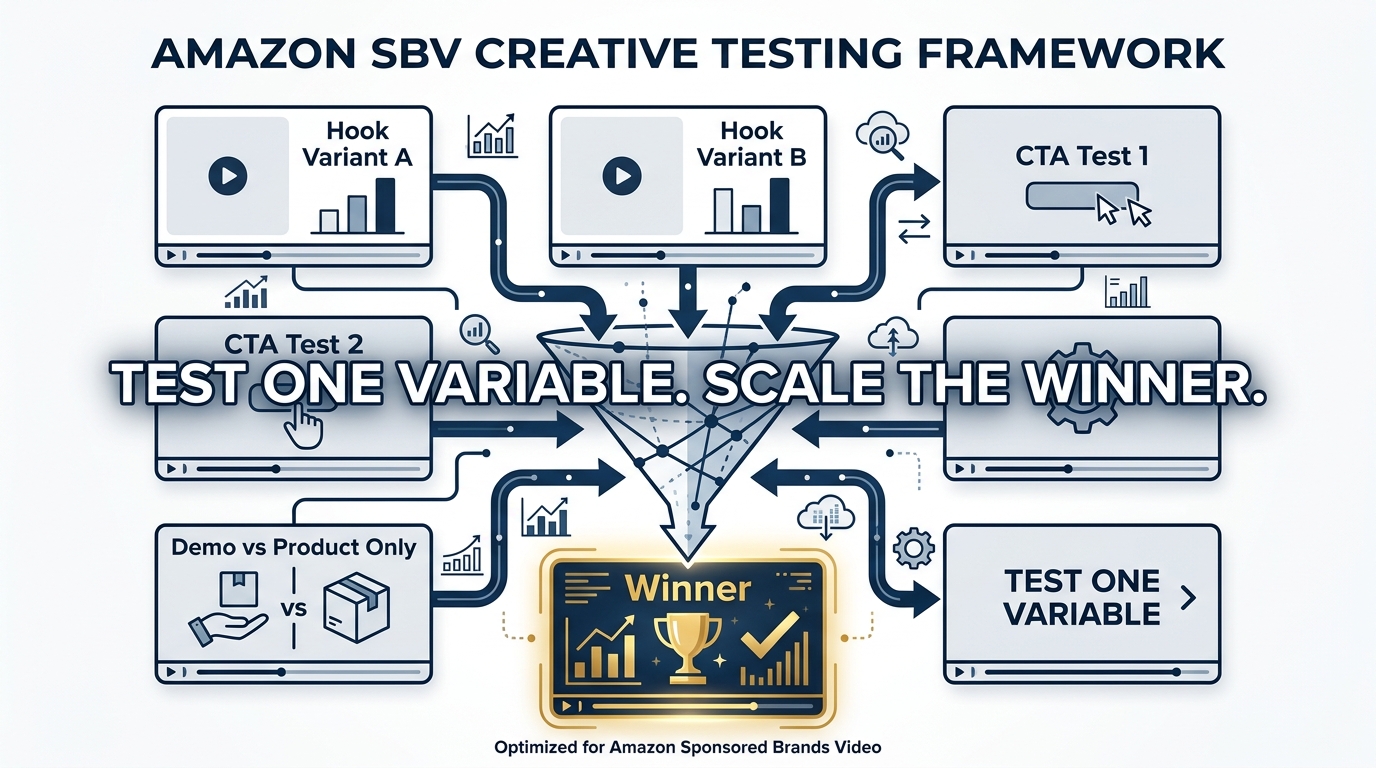
    A/B testing framework showing six SBV video variants being tested and funneled down to one winning creative

    The most underutilized aspect of the Video Generator isn’t any individual feature — it’s the six-variant output structure itself. Most sellers pick one variant they like aesthetically and launch it. That’s the wrong use of the tool.

    The six variants are a creative testing starter pack. They give you differentiated creative options at zero additional production cost. The correct workflow is to treat them as hypotheses and the campaign as the experiment.

    Designing the Test Before You Launch

    Effective creative testing on SBV requires an upfront decision about what variable you’re testing. The generator gives you six different compositions, but they may vary across multiple dimensions simultaneously — scene type, text placement, pacing, and color treatment. That makes direct A/B comparisons difficult unless you impose some structure on the test design.

    The most practical approach for sellers without a dedicated media buying team: run two to three variants simultaneously in separate ad groups within the same campaign, with identical keyword targeting and bids. Let them run until each has accumulated enough data (typically at least 1,000 impressions per variant at a minimum, with 5,000+ giving more reliable signal), then compare primarily on CTR first, then conversion rate, and finally ACoS or ROAS.

    CTR is the right leading indicator for creative testing because it reflects how well the creative is connecting with the audience at the point of impression — before any product page variables intervene. A creative that wins on CTR but underperforms on conversion usually has a messaging mismatch between the ad and the listing, not a creative problem per se. A creative that performs on both CTR and conversion is your winner to scale.

    The Variable Isolation Framework

    Once you’ve identified a general winner from the generator’s output, the next iteration should isolate specific variables. Amazon’s analytics suite now provides view-through rate (VTR), 5-second views, quartile views (what percentage watched 25%, 50%, 75%, and 100% of the video), and sound-on view rate. These metrics make it possible to diagnose where in the 15-second arc a variant is winning or losing the viewer.

    If a variant has strong 5-second views but drops off sharply at the 50% quartile, the hook is working but the middle section is losing people. If the 5-second view rate is low relative to impressions, the hook itself needs reworking. If sound-on rates are higher than average, your audio may be contributing meaningfully — or your visual hook is strong enough to make shoppers curious about what’s being said.

    Refresh Cadence

    Creative fatigue on Amazon video is real, though it manifests differently than on social platforms. Because SBV impressions are tied to search queries (not social feeds), the same shopper sees your ad repeatedly only if they’re searching frequently for your keyword. In high-competition categories, refresh cycles of 60–90 days are reasonable. In lower-volume categories, a strong creative can run for 6 months or more without significant performance decay.

    The generator makes frequent refreshes economically viable in a way that professional video production never could. A monthly creative refresh cycle that would cost thousands in production fees costs nothing except the time to run the generator and evaluate the output. This changes the economics of creative iteration substantially, particularly for smaller sellers and growing brands.

    Targeting and Placement: Where SBV Actually Wins

    The video format is powerful. But video format advantages are realized only at the right intersection of placement, intent, and keyword relevance. Getting the targeting wrong negates the creative.

    Search Intent Is the Foundation

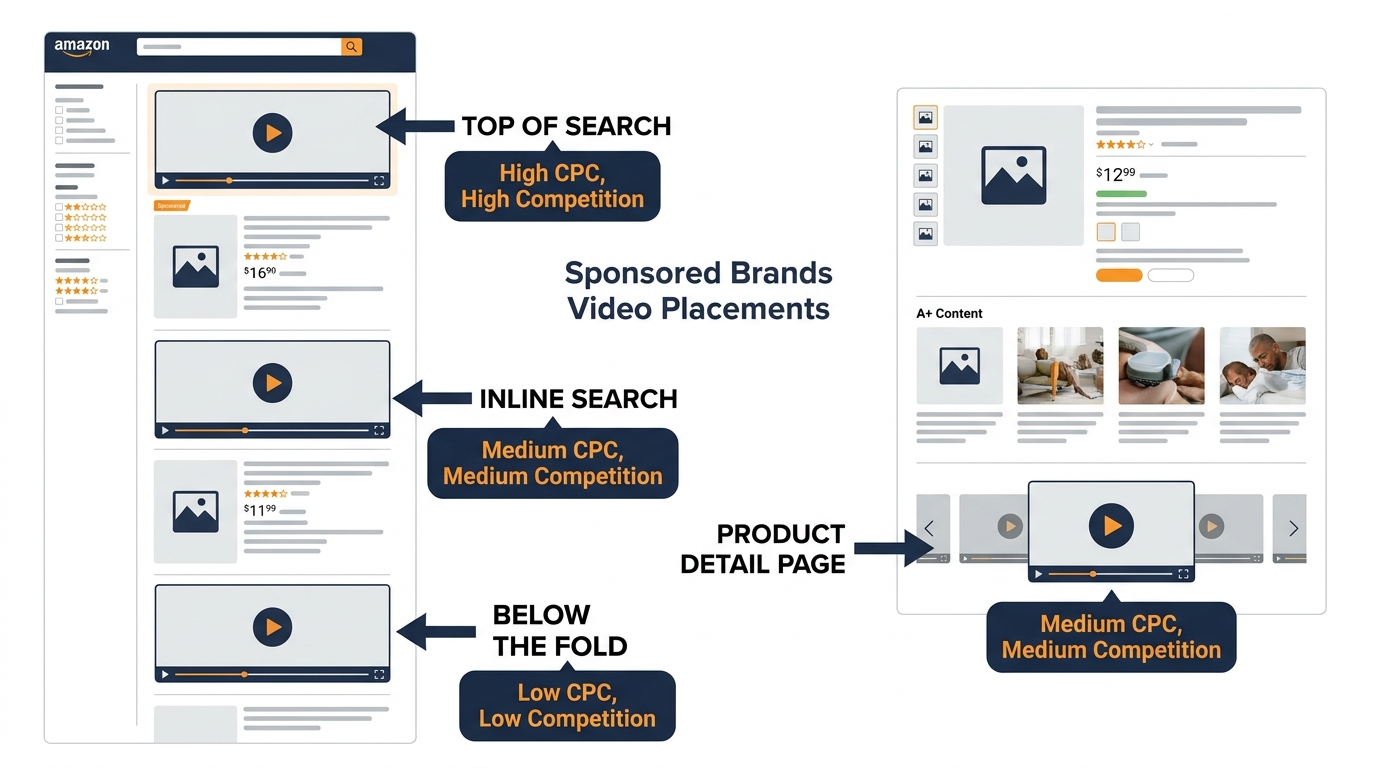
    Sponsored Brands Video appears primarily at the top of search results and within search results pages. This is fundamentally different from display or video advertising on other platforms. The audience is not passive — they are actively searching, expressing high purchase intent through their query. Your video creative needs to be evaluated against the intent of the keyword, not just as a standalone piece of content.

    A video showing your product being unboxed might perform well against branded keywords from existing customers who already know your product. The same video against competitive conquesting keywords (targeting a competitor’s product name) needs a different message — one that speaks to comparison shopping and why someone should switch. The creative and the keyword need to align.

    Match Type Configuration

    The strongest SBV campaigns in 2026 are overwhelmingly exact and phrase match-led. Broad match on SBV is not inherently wrong, but it introduces keyword misalignment risk that’s harder to control in a video format. A static ad displayed against an irrelevant query wastes budget. A video displayed against an irrelevant query wastes budget and impressions — and because SBV competes partly on a quality-signal basis, irrelevant impressions can degrade campaign health over time.

    The recommended structure is a tiered approach:

    • Tier 1 (Exact Match): Your highest-converting commercial terms. These are the queries where you know purchase intent is highest. Bid more aggressively here and keep the keyword list tight — 10 to 20 terms maximum per ad group.
    • Tier 2 (Phrase Match): Variations and longer-tail derivatives of your core terms. Useful for capturing intent signals you haven’t thought of explicitly.
    • Tier 3 (Broad Match / Category / Product Targeting): For discovery and expansion. Use this tier with strict negative keyword management and lower bids. Treat it as a research campaign that feeds intelligence into Tiers 1 and 2.

    Product Targeting as a Complement

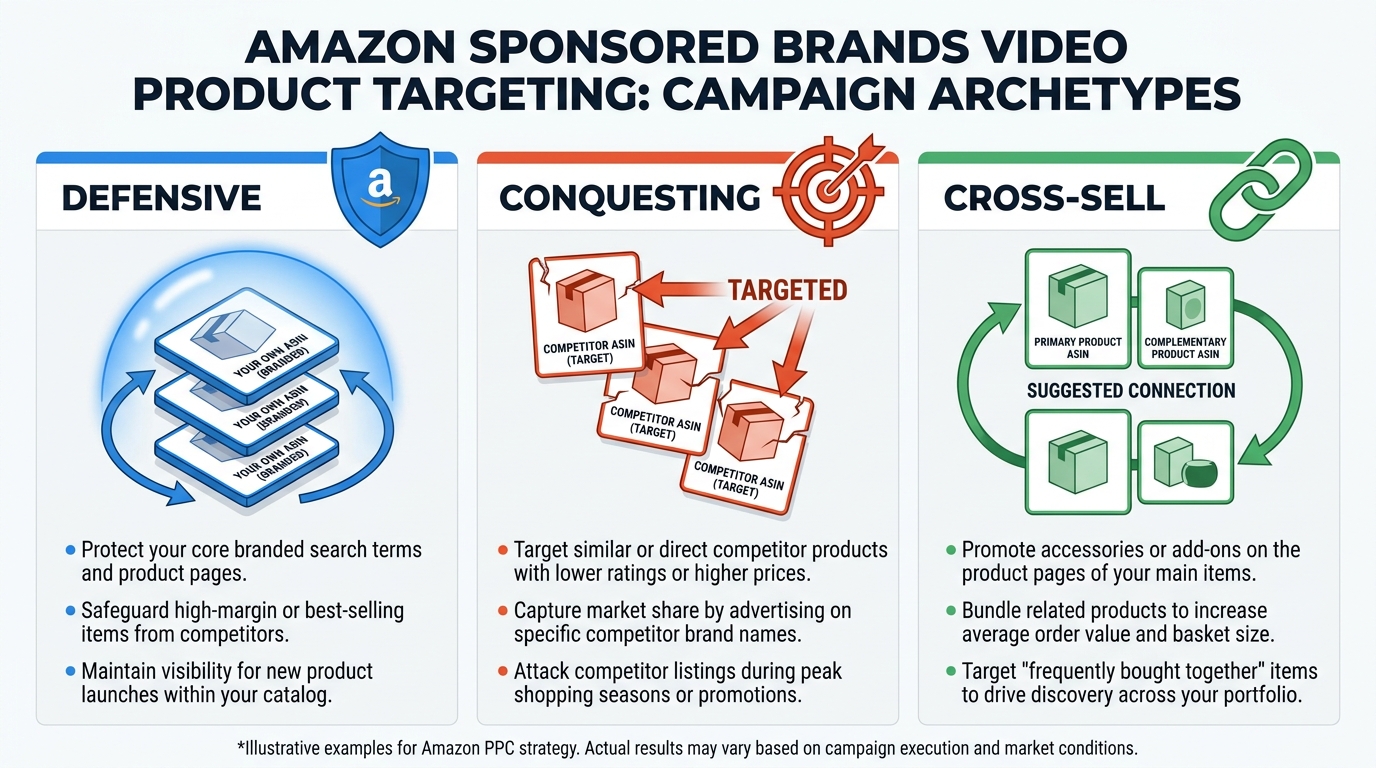
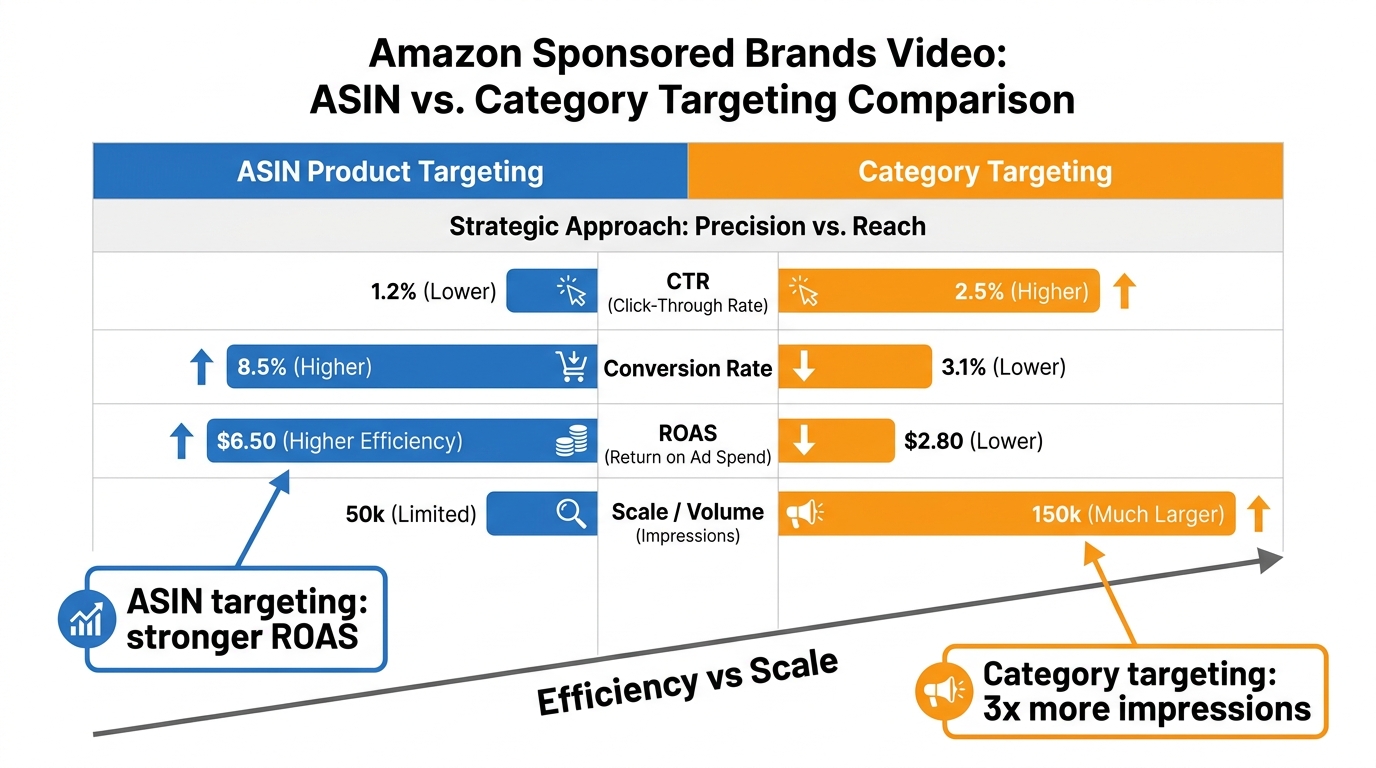
    ASIN and category targeting in SBV is an underused configuration. By targeting competitor ASINs — particularly those with high review counts or bestseller status — you place your video in a context where comparison intent is already active. A shopper viewing a competitor’s listing and seeing your SBV creative in the search results immediately before or after is seeing you in a direct comparison context.

    This works best when your creative addresses the comparison directly — whether that’s price, a specific feature advantage, or a proof point (review count, certifications, material quality) that your competitor’s product lacks. Generic creative deployed against competitive ASIN targeting wastes the placement. Specific, comparative creative in this context can produce outsized conversion rates because the shopper is already in a decision-making mindset.

    The AI Creative vs. Professional Video Debate: What the Numbers Say
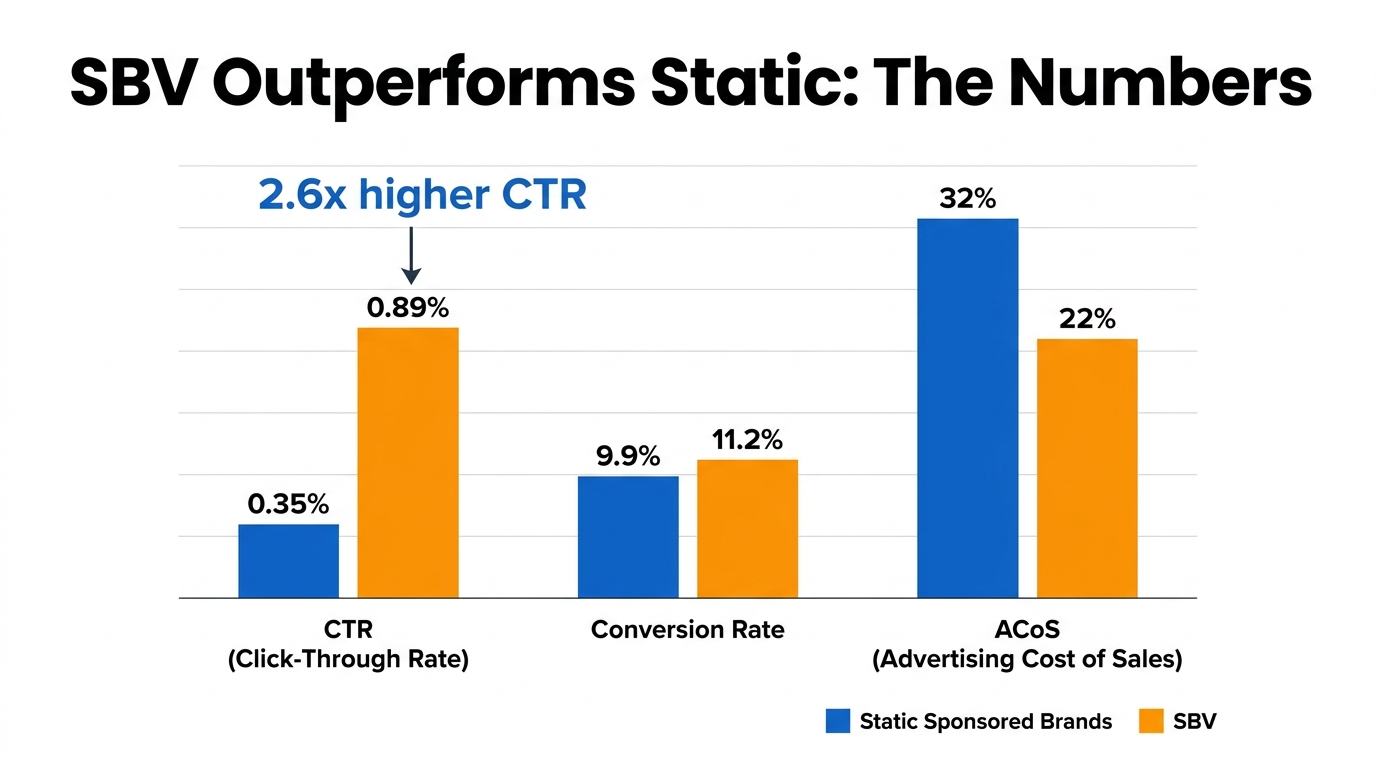
    Performance comparison chart showing SBV vs static Sponsored Brands ads with CTR, conversion rate, and ACoS metrics side by side

    The question of whether to use the Video Generator or invest in professional video production comes up constantly in seller communities, and the answer is more nuanced than either camp typically acknowledges.

    The Cost Reality

    Professional video production for Amazon advertising ranges from a few hundred dollars for a basic product showcase from a freelance videographer to several thousand for a multi-scene, talent-featuring, professionally edited commercial-grade video. Agency-produced SBV creative can run considerably higher when licensing, talent fees, and revision rounds are factored in.

    The generator costs nothing. That’s not a small difference in scale — it changes the decision calculus entirely for sellers who would otherwise skip video advertising entirely due to production cost.

    Where Each Wins

    Professionally produced video consistently delivers in contexts where differentiation is the primary goal: hero videos for brand storefronts, launch campaign assets for flagship products, or creative that needs to showcase complex features that require real-world filming. A food product that needs to show texture, steam, and color saturation realistically will produce a better output from professional production than from AI image-to-motion synthesis. A complex fitness device with moving parts and multiple configuration options needs actual product footage to demonstrate properly.

    The Video Generator wins in three specific contexts:

    • Volume testing: When you need multiple creative variants quickly to identify what resonates with your audience before investing in professional production.
    • New product launches: When a product hasn’t yet generated enough sales or reviews to justify professional video spend, AI-generated creative allows you to run SBV from day one.
    • Long-tail keyword campaigns: High-volume professional creative is wasted on low-impression keyword targets. AI-generated creative is the appropriate cost level for these placements.

    The intelligent approach isn’t either/or. It’s using the generator for testing and discovery, then investing professional production spend into the specific message and format that your test data shows is working. You’re not guessing what to film — you’re filming what the data told you to.

    Quality Ceiling Considerations

    It would be misleading to suggest AI-generated video is indistinguishable from professional production. In categories where visual sophistication is a brand signal — luxury goods, premium beauty, gourmet food — the AI generator’s output can look inconsistent with a brand’s positioning. The enhanced motion shots are more realistic than the first-generation tool, but they’re still identifiable as AI-generated to a trained eye.

    However, Amazon shoppers looking at SBV ads in search results are not evaluating production quality against a Hollywood standard. They’re evaluating relevance, product clarity, and benefit communication in a 2–3 second window. In that context, a clean, well-structured AI-generated video frequently outperforms a polished professional video that opens with a brand logo and takes five seconds to show the product.

    Category-Specific Playbooks: What Works Varies Wildly by Product Type

    SBV creative strategy isn’t uniform across categories. The same structural principles apply, but the execution varies substantially based on what the product needs to demonstrate, who the buyer is, and what objections need to be addressed in 15 seconds.

    Hard Goods and Tools

    For physical products where the mechanism of action matters — power tools, kitchen equipment, fitness devices, storage solutions — the demo-centric video format performs strongly. The video’s job is to show the product solving a problem that the shopper already knows they have. Use the 3–10 second window to show the product in active use, not just on display. The enhanced motion shots from the updated generator work particularly well here: for a drill, show it drilling. For a blender, show it blending. The specificity of the action is what builds confidence.

    On-screen text in this category should address the most common purchase hesitation. For tools: durability signals, compatibility information, or a notable specification. For kitchen equipment: capacity, material quality (stainless steel vs. plastic), or ease of cleaning. These aren’t glamorous copy points, but they directly address what’s stopping the click-to-purchase conversion.

    Health, Beauty, and Personal Care

    This category has the highest creative performance variance on SBV, partly because benefit claims are regulated and partly because results-based claims are hard to demonstrate in 15 seconds. The most effective creative in this space tends to be benefit-led with strong social proof: not “this moisturizer hydrates better” but “4.8 stars | 20,000+ Reviews | Dermatologist Tested.” Claims that Amazon reviews have already validated are more credible in an ad context than unsubstantiated superlatives.

    The generator’s lifestyle scene capability is particularly relevant here. A skincare product shown in a clean, aspirational bathroom setting with appropriate lighting is more effective than the same product on a white background. If your listing has lifestyle images, those feed the generator more useful material — another reason why listing image investment pays dividends beyond organic ranking.

    Supplements and Consumables

    Compliance is the primary constraint. SBV creative for supplements must avoid disease claims, health claims that cross FDA lines, and before/after content that implies specific outcomes. The generator will produce creative from your listing data, but if your bullets are aggressively worded, you may generate a video with claim language that triggers Amazon’s ad review rejection.

    Pre-submission review of all on-screen text against Amazon’s ad policy guidelines is not optional in this category. A rejected SBV creative loses review time (typically 24–72 hours), which is expensive during launch windows or peak seasons. The safest structure: lead with the product clearly, use ingredient or format specifics in the demo section (e.g., “30-Day Supply | Non-GMO | Gluten Free”), and close with star rating and review count.

    Apparel and Fashion

    This is the category where the Video Generator is most limited by its current capabilities. Apparel advertising relies heavily on fit, drape, texture in motion, and the way a garment looks on a human body — details that AI-generated product-in-use shots handle inconsistently. The current generator’s human motion sequences are more convincing for product-with-person adjacency than for on-body apparel demonstration.

    The recommendation for apparel sellers is to use the generator primarily for the upload-and-summarize pathway: shoot brief on-model footage (even 30 seconds of simple model content with a smartphone), then use the tool to compress and format it into an ad-ready 15-second creative. This keeps production costs low while maintaining the visual fidelity the category requires.

    Metrics That Actually Matter: Reading SBV Analytics Beyond CTR

    CTR is the most-reported SBV metric, and it’s genuinely useful as a creative indicator. But treating CTR as the singular performance metric leads to suboptimal decisions. The SBV analytics suite contains richer diagnostic signals that most sellers aren’t using.

    The Quartile View Stack

    Amazon’s video analytics report quartile completion rates: the percentage of viewers who watched 25%, 50%, 75%, and 100% of the video. These numbers, read as a stack, tell you exactly where your creative is losing people.

    A healthy 15-second SBV creative typically shows a steep initial drop (25% → 50%) followed by a relatively flat slope (50% → 100%). Early drop is expected — many shoppers make the scroll-or-stop decision in the first few seconds. But if the drop from 25% to 50% is unusually steep, your first three seconds aren’t compelling enough to sustain engagement. If the 75% → 100% drop is large, your close isn’t earning the final attention — which often means the product and benefit were established but the CTA isn’t clear enough to complete the sequence.

    5-Second View Rate

    This metric deserves more attention than it typically gets. The 5-second view rate tells you what percentage of people who saw the ad watched at least five seconds. High 5-second view rate with low CTR is a specific pattern that means: the creative is interesting enough to watch but isn’t triggering intent to click. This usually signals a creative-keyword mismatch — the video is engaging but isn’t speaking to the specific intent behind the search query.

    Low 5-second view rate against high impressions is a more urgent problem: the first seconds aren’t working. This is the trigger to either regenerate with the Video Generator or directly edit the opening frames in Creative Studio.

    Sound-On Rate

    Given that 71% of plays are muted, a sound-on rate significantly above 30% is meaningful. It tells you that something in the visual creative is generating enough engagement for shoppers to actively unmute — which correlates with higher downstream conversion in most categories. Tracking sound-on rate as a creative quality signal is more useful than tracking it as a reach metric.

    View-Through Conversions

    Amazon’s attribution window for SBV includes view-through conversions — purchases that happened within a defined window after someone saw your video ad, even without clicking it. These are attributed differently by Amazon’s reporting tools and are frequently undercounted in seller-side analysis. Sellers who evaluate SBV purely on direct click-to-purchase metrics systematically undervalue the format. SBV’s influence on brand recall and subsequent organic search is real and measurable through view-through attribution — but only if you’re looking for it.

    The Scaling Stack: Moving from Test Wins to Full Campaign Structure
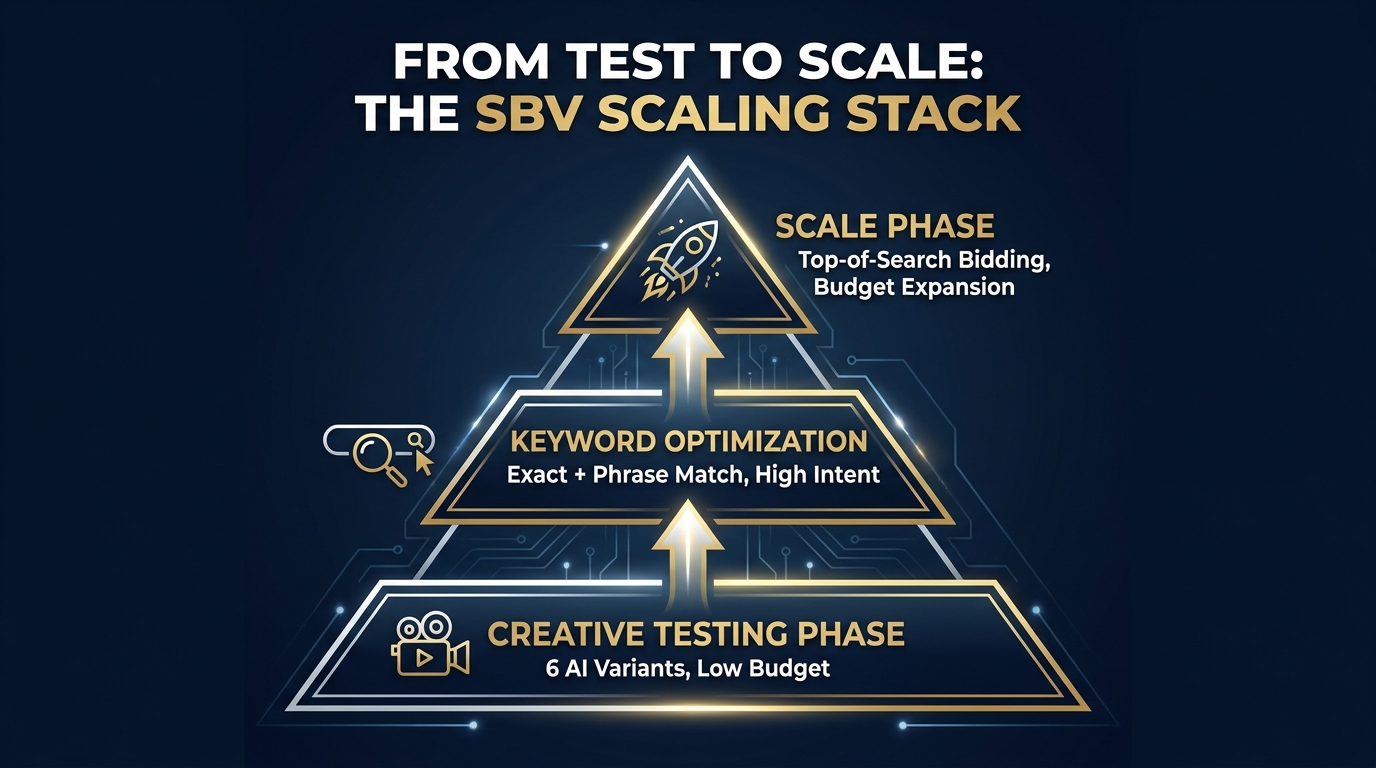
    SBV campaign scaling stack pyramid diagram showing Creative Testing at base, Keyword Optimization in middle, and Scale Phase at top

    Once you have a winning creative and a validated keyword configuration, the structural question is how to build around that win without eroding the performance signal that made it valuable.

    Campaign Architecture for SBV

    The most robust SBV campaign structures in 2026 separate intent tiers into distinct ad groups or campaigns with individual budget allocations. This allows for differentiated bidding by intent level and prevents a single high-spend term from dominating the account’s performance picture and obscuring underperformance elsewhere.

    A recommended structure for a mid-size catalog:

    • Campaign 1 — Branded Defense: Exact match on your own brand terms. Budget and bid set to ensure 90%+ impression share. Creative can be brand-reinforcing since these are existing brand-aware shoppers.
    • Campaign 2 — High-Intent Core: Exact and phrase match on your top commercial keywords. This is your primary volume and ROAS engine. Budget should be your largest allocation.
    • Campaign 3 — Competitive Conquesting: ASIN targeting against competitor products and category-level targeting. Creative must address comparison directly. Budget is secondary to creative quality here.
    • Campaign 4 — Discovery / Exploration: Broad match and category targeting for keyword research and incremental reach. Lowest budgets, harvest insights, feed winners into Campaign 2.

    Bid Strategy for Top-of-Search Dominance

    SBV’s primary placement is top-of-search, and capturing that placement consistently requires actively managing placement bid adjustments. Amazon’s default automated bidding for Sponsored Brands will optimize toward clicks, but top-of-search dominance for high-intent keywords often requires a manual bid adjustment specifically for that placement.

    The standard framework: set your base bid to a level that delivers consistent page 1 visibility, then use a top-of-search placement modifier of 25–50% for your highest-converting terms. Monitor impression share weekly in the early stages. If you’re capturing less than 60% of available impressions for a high-priority keyword, the bid needs to increase or the creative quality score needs improvement — or both.

    Budget Pacing and Dayparting

    SBV campaigns on Amazon don’t natively support dayparting — you can’t schedule ads to run only during peak shopping hours. But budget pacing settings and the distinction between standard and accelerated delivery affect when your budget is consumed throughout the day. For categories with strong evening shopping patterns, standard delivery (which spreads budget across the day) can result in budget depletion before peak hours. Monitoring time-of-day impression data through Amazon’s reporting and adjusting daily budgets accordingly is a manual but effective workaround.

    Common Failure Patterns and How to Avoid Them

    After covering what works, it’s worth being explicit about the patterns that consistently undermine SBV performance. These aren’t hypothetical — they show up repeatedly in account audits and campaign reviews.

    Launching Without Reviewing Generator Output

    The Video Generator is not an autonomous system that produces perfect creative. It works from your listing data, and if your listing data is mediocre — generic images, keyword-stuffed bullets, low-quality product photography — the generator will produce mediocre creative. Sellers who generate and launch without a review step are at risk of running ads with logo-first openers, off-brand color treatments, or on-screen text lifted verbatim from a keyword-optimized title that reads like gibberish in a 2-second window.

    The review step takes 10 minutes. It should be non-negotiable.

    Running All Six Variants in One Campaign

    More variants doesn’t mean more data faster if the budget is split too thin. Six variants in one campaign with a $20/day budget means roughly $3.30 per variant per day — which won’t generate enough impressions for meaningful signal within a reasonable time window. Either reduce the variant count to two or three for testing, or ensure the campaign budget is sufficient to give each variant at least 500 impressions per day.

    Ignoring Negative Keywords

    SBV campaigns without negative keyword management bleed budget. The format is expensive per click relative to Sponsored Products, which means irrelevant clicks cost more both in absolute terms and in ACoS impact. Negative keyword management should begin at campaign launch, informed by your auto-targeting history if you have it, and should be reviewed weekly in the first month.

    Treating SBV as an Awareness Format

    This is a mindset failure more than a tactical one. Some sellers, particularly those with offline marketing backgrounds, position SBV as a brand-building awareness format and evaluate it on reach and impressions. On Amazon, SBV appears in high-intent search results. The shopper has already expressed a purchase intent through their query. Treating the format as awareness-only is leaving conversion opportunity uncaptured.

    SBV should be evaluated as a conversion-driving format with brand reinforcement as a secondary benefit — not the other way around. Campaign structure, creative decisions, and bid strategy all follow from that framing.

    Static Headline Across All Keywords

    The headline field in Creative Studio is set once and applies to the ad across all keywords. This creates an inevitable mismatch: a headline optimized for a broad category search term (“Best Kitchen Knives”) is less relevant for a highly specific query (“8-inch chef knife high carbon steel”). The workaround is to segment keyword campaigns tightly enough that a single headline is reasonably relevant to the entire keyword set within each campaign. More segmentation means more headline specificity, which means higher relevance and better performance.

    The Real Advantage Is Speed — and What to Do With It

    The SBV Video Generator changes Amazon advertising in one fundamental way: it removes the production time and cost barrier to video creative iteration. That’s not a minor convenience — it’s a structural shift in what creative testing looks like for Amazon sellers.

    Before tools like this existed, a brand running SBV had one or two video assets. They might test one against the other, but the cost of producing more variants meant creative testing cycles stretched over months. Production budgets constrained how aggressively you could learn. Smaller brands couldn’t afford to participate in the format at all.

    Today, the generator produces six variants in minutes at no cost. A seller who understands how to use that output strategically can run a complete creative learning cycle — generate, test, read analytics, identify the winner, iterate — in two to three weeks. Then repeat. That velocity of creative learning compounds over time. An account running structured SBV testing every 60 days accumulates more creative intelligence in one year than an account that produced two professional videos and ran them indefinitely.

    The sellers who will get the most from this tool are not the ones who appreciate the convenience. They’re the ones who recognize that the real output isn’t a video — it’s data about what their customers respond to at the moment of search intent. The video is the mechanism. The learning is the asset.

    Actionable Takeaways

    • Audit your listing first. The generator is only as good as the imagery and copy you feed it. Upgrade your listing images before generating, not after.
    • Review every generated variant for muted-autoplay performance. Can a shopper understand the product and its key benefit in two seconds with no audio? If not, edit or regenerate.
    • Use the six variants as a structured test, not a menu. Run two to three in parallel with identical targeting, read the analytics after meaningful impression volume, and scale the winner.
    • Segment your keywords tightly enough that your headline is relevant to every term in the ad group. Relevance compounds.
    • Track quartile views and 5-second view rate, not just CTR and ROAS. The diagnostic value of video analytics is only realized if you’re actually reading the full set of metrics.
    • Treat AI creative as your testing layer, professional production as your scaling layer. Let the data tell you what to produce, then invest in producing it well.
    • Build negative keyword lists from day one. SBV is expensive enough per click that irrelevant traffic materially damages ACoS.

    The format’s performance data is clear. The tool is free and increasingly capable. The sellers who will dominate SBV in the next 12 months won’t be the ones with the largest video production budget — they’ll be the ones who build a systematic creative and testing process around a tool that most of their competitors are either ignoring or using halfway.
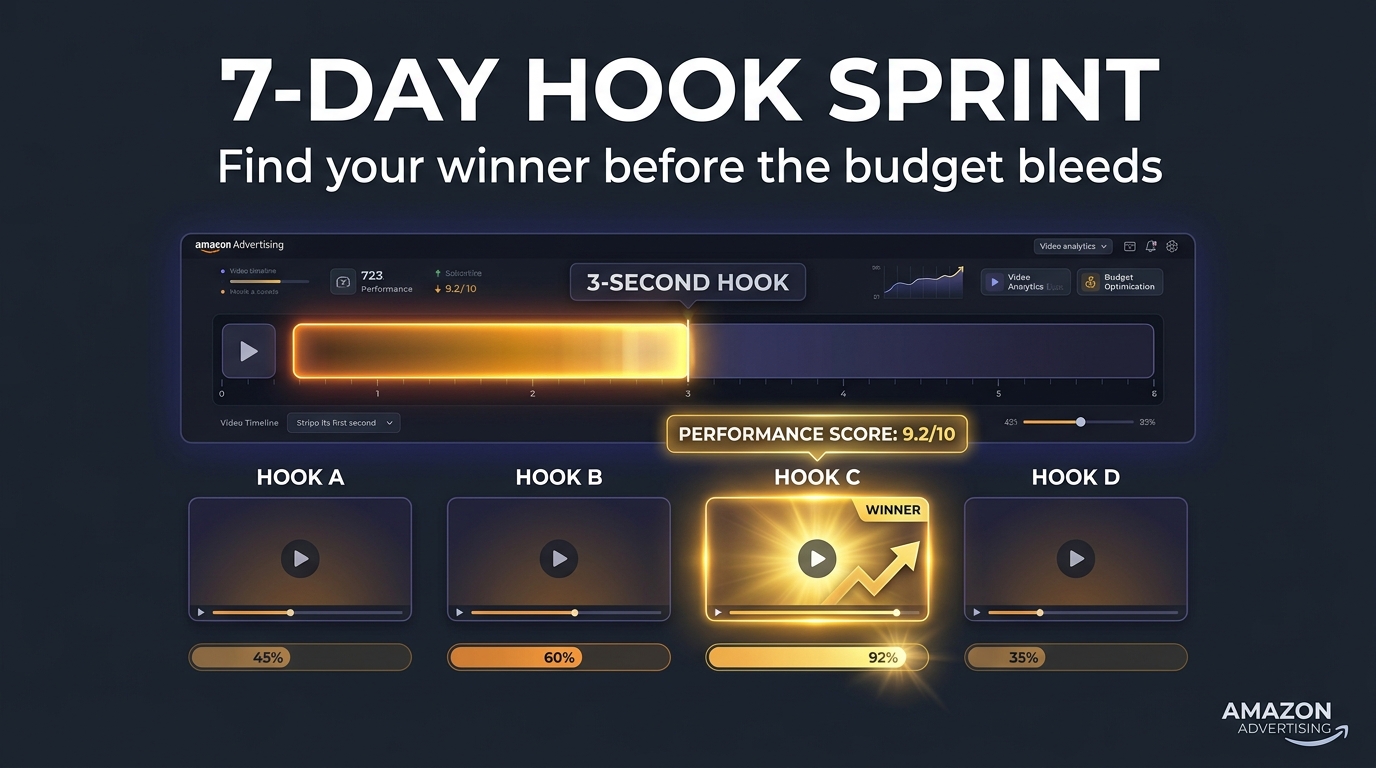
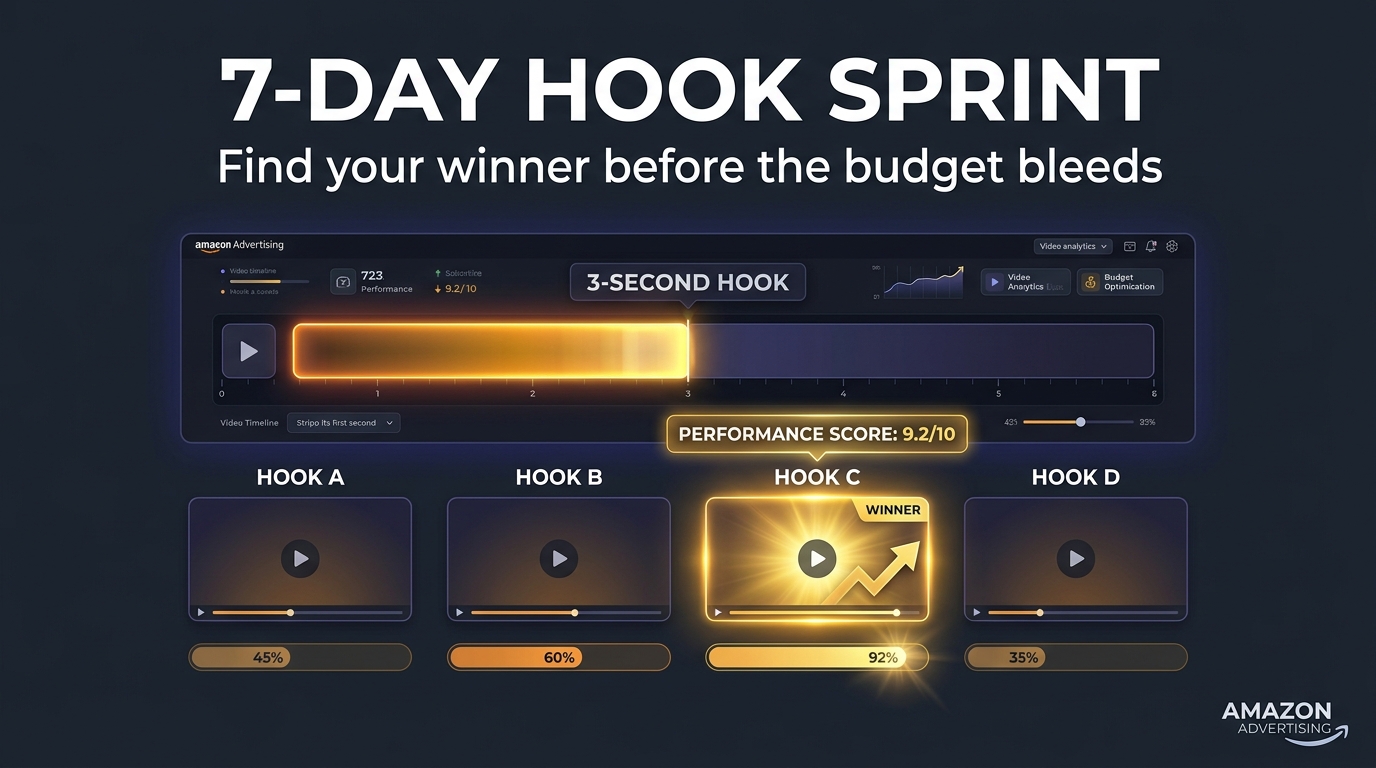
  • Hook-First SBV Creative Testing: Inside the 7-Day Iteration Sprint That Cuts Wasted Ad Spend

    Hook-First SBV Creative Testing: Inside the 7-Day Iteration Sprint That Cuts Wasted Ad Spend

    7-Day Hook-First SBV Creative Testing Sprint Dashboard showing video hook variants and performance scores

    Most Amazon advertisers treat Sponsored Brands Video as a placement, not a laboratory. They produce one polished video, push it live against a broad keyword set, check the CTR a week later, shrug at the numbers, and wonder why they’re burning through budget without hitting their ACOS targets. The video plays. Nobody clicks. The creative ages. The ACoS climbs. Eventually someone commissions a new video — and the cycle repeats.

    The core problem isn’t production quality. It isn’t budget. It’s the absence of a systematic testing methodology built around the one thing that determines whether a viewer engages or scrolls: the first three seconds. The hook.

    Sponsored Brands Video (SBV) is currently Amazon’s highest-CTR ad format, delivering average click-through rates of 0.9–1.0% against a platform-wide average of approximately 0.4% for all Sponsored Brands formats. When that performance gap closes — when your SBV is pulling 0.4% like a static banner — it almost always traces back to a hook failure, not a body-copy problem or a CTA weakness. The opening frame is doing the heavy lifting or none of the work at all.

    This article lays out a complete 7-day iteration sprint for hook-first SBV creative testing. Not a loose framework. Not a theory deck. A day-by-day operating system — complete with the metrics you track at each stage, the kill thresholds that tell you when to pull a creative, the signal patterns that tell you when to scale, and the briefing process that ensures each new sprint is smarter than the last. If you run this process consistently, you will know more about what your audience responds to after four sprints than most of your competitors know after a year of running ads.

    What SBV Creative Testing Actually Measures

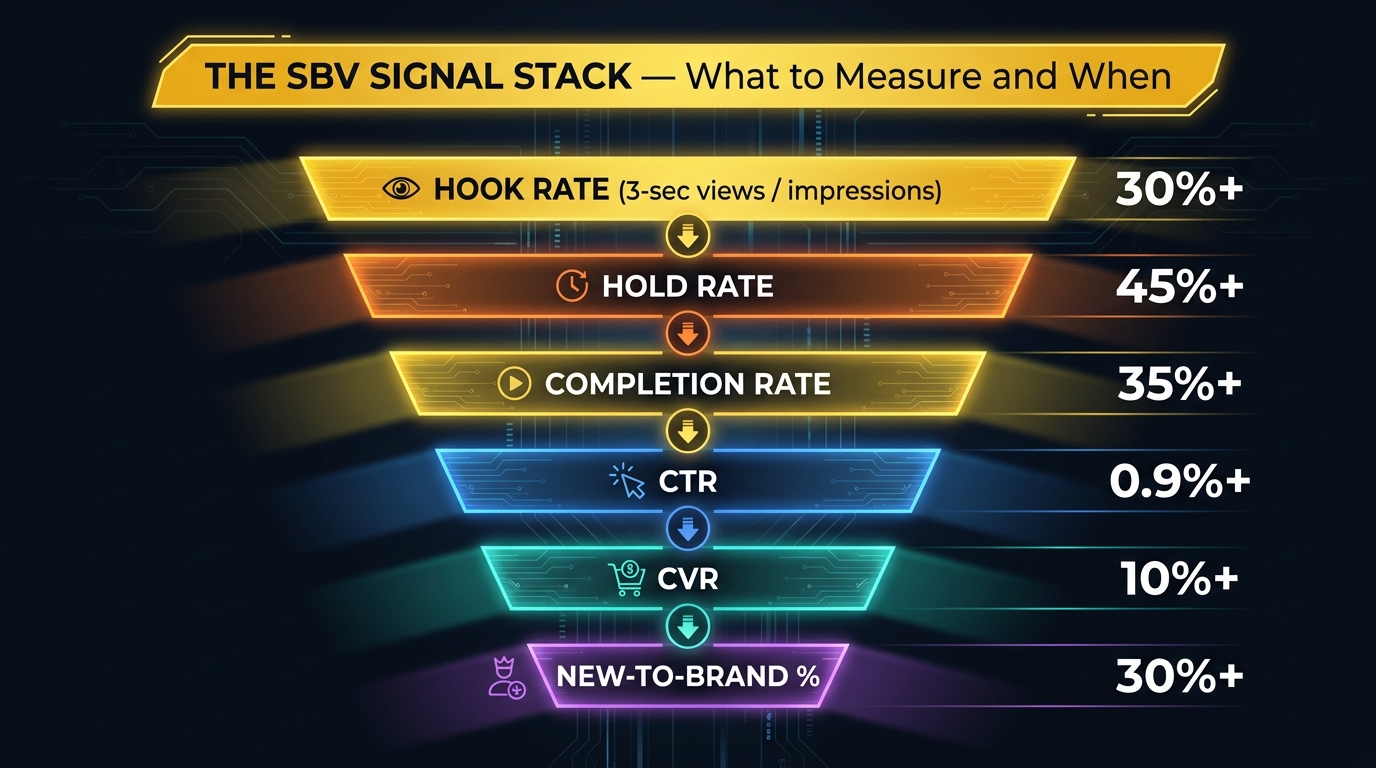
    SBV signal stack infographic showing hook rate, hold rate, completion rate, CTR, CVR, and new-to-brand benchmarks

    Before you can run a testing sprint, you need to be clear about what you’re measuring — and why the full signal stack matters more than any single metric in isolation. Brands that optimise solely for CTR regularly promote creatives that drive clicks but convert poorly. Brands that optimise solely for ACoS sometimes kill high-attention creatives that would have built brand awareness and new-to-brand customers at a reasonable cost over time.

    SBV creative testing uses six primary signals, each measuring something meaningfully different about how a viewer is responding to your video.

    Hook Rate

    Definition: 3-second video views divided by total impressions. This is your opening attention capture metric — it tells you what percentage of people who saw your ad actually stopped to watch the first three seconds rather than scrolling immediately. The 2026 benchmark for ecommerce SBV is a hook rate of 30% or above for solid performance, with top-decile creatives reaching 40–45%. Anything below 20–22% is a signal that your opening frame is failing to arrest attention, regardless of what else the video does well.

    Hold Rate

    Definition: The percentage of viewers who watched past the 3-second mark and continued engaging with the video. Where hook rate tells you about the opening grab, hold rate tells you whether the rest of your creative is delivering on the promise of that first frame. A high hook rate paired with a collapsing hold rate means your opening is misleading or tonally disconnected from the body of the ad. You grabbed them, then immediately lost them. That’s a structural problem, not a hook problem. Target 45% or above for competitive SBV performance.

    Completion Rate

    Definition: The percentage of video starts that result in the full video being watched. For SBV formats running at 15–30 seconds, strong completion rates sit at 35% or above. Completion rate tracks the overall narrative strength of the creative — does the argument you’re making hold attention all the way through to the CTA? Completion rate drops sharply when videos run too long, when transitions are jarring, or when the product demonstration section loses momentum after a strong hook.

    Click-Through Rate (CTR)

    Definition: Clicks divided by impressions. The headline metric most teams default to, and a legitimate one — but it’s most meaningful when read alongside hook rate and hold rate. A strong CTR of 0.9% or above from a low hook rate suggests you’re getting clicks from a small number of highly engaged viewers, but the creative is failing the majority. That’s an efficiency problem hidden behind a respectable number. CTR is the output; the attention metrics above are the inputs.

    Conversion Rate (CVR) and ACoS

    Definition: The percentage of clicks that result in a purchase, and the ratio of ad spend to attributed sales. CVR for strong SBV typically sits in the 10–12% range for ecommerce, though this is heavily category-dependent and also influenced by listing quality, price positioning, and review count — factors outside the creative itself. ACoS is your efficiency governor. It keeps CTR optimisation honest by measuring whether the traffic you’re generating actually converts at a cost that makes sense for your margin structure.

    New-to-Brand Rate (NTB)

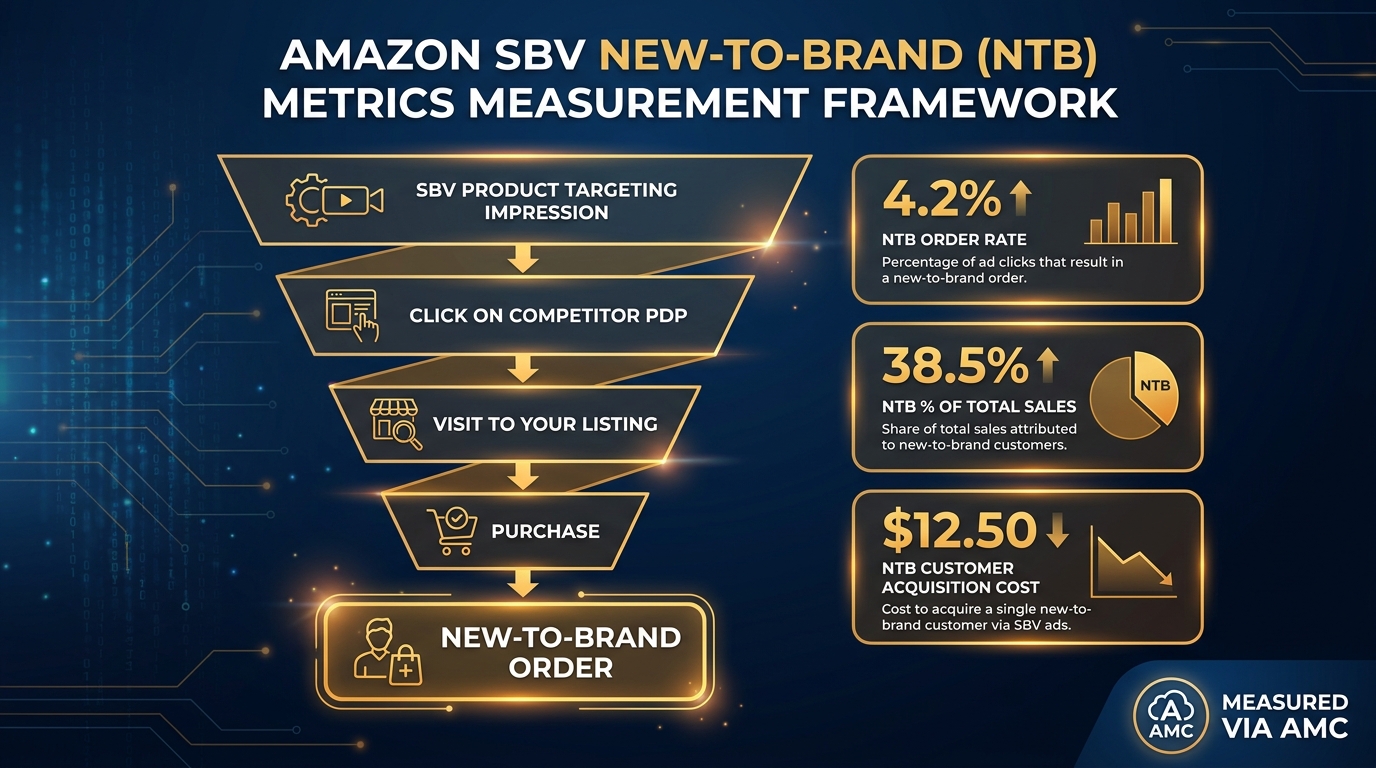
    Definition: The percentage of purchases from customers who have not bought from your brand on Amazon in the past 12 months. SBV is a particularly powerful format for new-to-brand customer acquisition because it appears on search results pages and reaches buyers in active discovery mode. A healthy NTB rate of 30% or above from SBV suggests your creative is genuinely pulling in new customers, not just serving existing ones. Teams that ignore NTB often undervalue SBV’s contribution to long-term brand growth.

    Together, these six signals form your creative testing dashboard. The sprint methodology uses them in sequence: attention metrics first (hook rate, hold rate) to make fast creative decisions, then downstream metrics (CTR, CVR, NTB) to qualify those decisions with business impact data before you commit budget to scale.

    The Hook-First Principle: Why the Opening Frame Decides Everything

    The hook-first testing approach rests on a simple but important operational insight: the hook is the highest-leverage variable in any SBV creative, and it’s also the cheapest and fastest variable to change.

    Re-editing the body of a video requires producer time, potentially re-shoots, and a full review cycle. Changing the hook — the opening 2–3 seconds of footage, motion, text overlay, or voiceover — often requires nothing more than a simple asset swap. You can produce four or five distinct hook openings in the time it takes to produce one complete alternate video. That asymmetry makes the hook the obvious first testing variable.

    The second reason hooks get tested first is that they disproportionately determine performance. Research consistently shows that in search-adjacent placements like SBV, viewers make their scroll-or-watch decision within approximately 1.5–2 seconds of the ad appearing. Your brand story, product demonstration, testimonials, and CTA are all invisible to anyone who scrolls past the opening frame. Optimising those downstream elements before optimising the hook is like repainting the interior of a house when the foundation is cracked.

    What Makes a Hook Work on Amazon Specifically

    Amazon SBV operates in a different attention environment than social platforms. Viewers on TikTok or Instagram are in browsing mode — they’re moving through content for entertainment and discovery. Amazon viewers are in buying mode — they typed a search query, they saw a product grid, and now an ad is interrupting the consideration process. That difference changes what works.

    On Amazon, effective hooks do three things simultaneously in the first two to three seconds: they establish product relevance (this is the thing you’re searching for), they communicate a distinct value proposition (here’s why this one specifically), and they create sufficient cognitive engagement to earn the next five seconds of attention. This is a narrower brief than social video, where emotional or entertainment-led hooks can carry a longer ramp. SBV hooks need to be commercially relevant faster.

    Amazon’s own published guidance reinforces this: the product should appear on screen within the first two to three seconds, its primary function or benefit should be visible within five seconds, and slow logo reveals or brand-first intros consistently underperform against product-forward openings. The viewer didn’t search for your brand — they searched for a solution. Your hook should mirror the intent behind that search query, not introduce your brand identity.

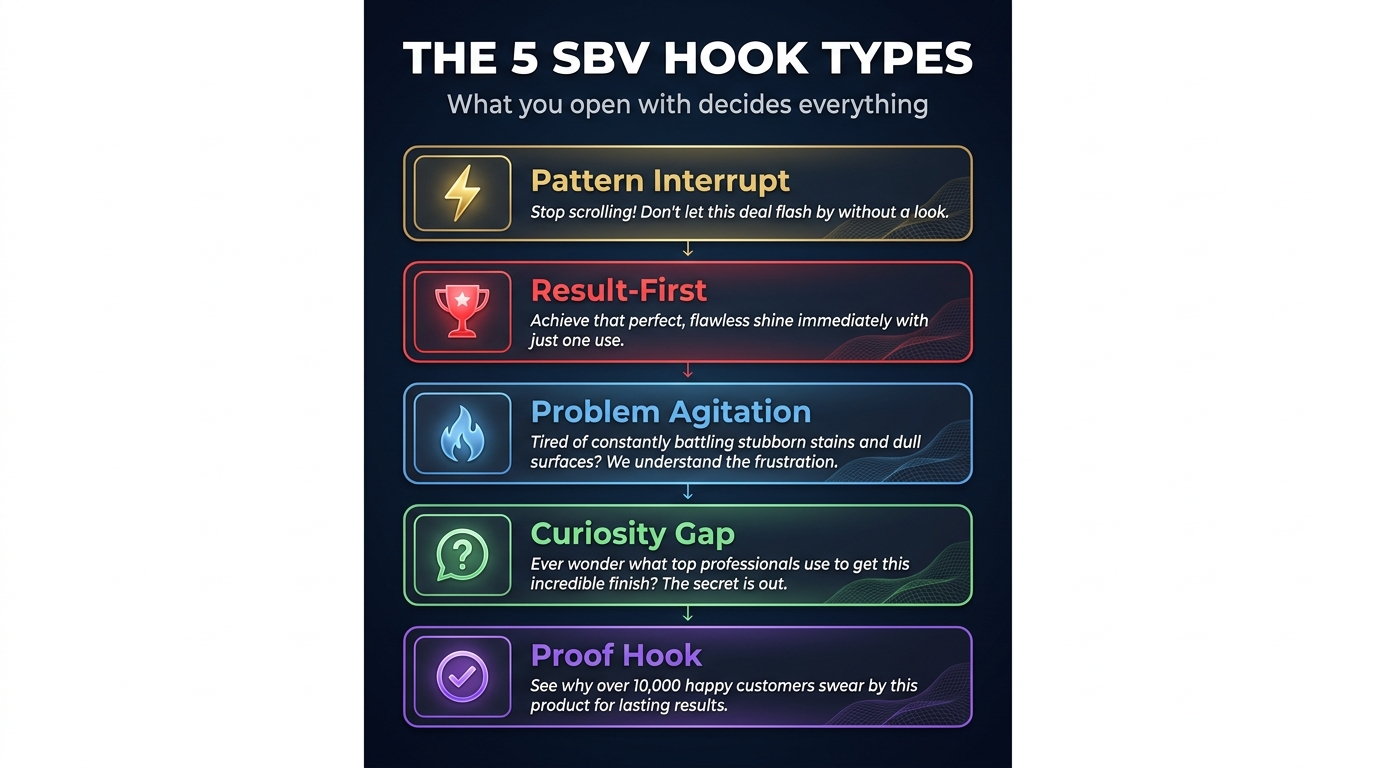
    Hook Taxonomy: The 5 Types That Actually Move SBV Metrics

    The 5 SBV Hook Types: Pattern Interrupt, Result-First, Problem Agitation, Curiosity Gap, and Proof Hook diagram

    Not all hooks are structurally equivalent. Through accumulated testing across SBV campaigns, five distinct hook archetypes have emerged as the most reliable performers. Each works through a different psychological mechanism, and each performs differently depending on category, funnel stage, and keyword intent. A 7-day sprint should typically include hooks from three or four different archetypes so that you’re testing strategic angles, not just surface-level copy variations.

    1. The Pattern Interrupt Hook

    This hook type opens with something visually or auditorily unexpected — a jarring cut, an unusual camera angle, rapid motion, a surprising statistic on screen, or a direct-address opening that breaks the viewer’s scanning pattern. The psychological mechanism is simple: novelty stops the scroll because the brain flags unexpected stimuli as potentially important. On a search results page full of static product images, any video doing something unusual commands attention.

    Structure: Unusual visual or motion element → immediate product reveal → benefit statement within 3 seconds.
    Best for: Competitive categories with high ad density, commodity products that need differentiation on attention.
    Watch for: Pattern interrupt hooks can drive high hook rates but lower hold rates if the unusual opening isn’t logically connected to the product. Test that hold rate carefully before scaling.

    2. The Result-First Hook

    This hook opens by showing the outcome — not the product itself, but what the product produces. A fitness product might open with the transformation. A kitchen gadget might open with the finished dish. A skincare product might open with close-up skin texture post-use. You’re leading with the most emotionally compelling part of the story and then working backward to the product.

    Structure: Compelling result or outcome on screen → product reveal → explanation of how the result was achieved.
    Best for: High-consideration categories where the benefit is visually demonstrable, beauty, health, home improvement, food and kitchen.
    Watch for: Result-first hooks require the result to be immediately legible to a viewer who doesn’t yet know what the product is. If the outcome requires context to understand, this hook type will underperform.

    3. The Problem Agitation Hook

    Opens by naming or showing a pain point the target customer experiences — directly, specifically, and fast. No preamble, no brand setup. Just: “You know that problem you have? We see it.” This hook type works because it creates instant relevance and emotional recognition. When the viewer sees their frustration mirrored in the opening frame, they feel the ad is speaking directly to them rather than broadcasting at everyone.

    Structure: Problem statement (visual, text overlay, or voiceover) → moment of agitation or emotional resonance → product as the pivot point toward resolution.
    Best for: Problem-solution products in health, organisation, pet care, baby, and any category where the purchase is pain-driven rather than aspiration-driven.
    Watch for: Problem agitation hooks can feel heavy-handed if the problem statement is too dramatic or generic. Specificity drives performance — “struggling to sleep through the night” outperforms “tired of bad sleep.”

    4. The Curiosity Gap Hook

    Opens with a partial statement, an intriguing question, or an incomplete visual that the viewer’s brain wants to resolve. “Here’s why most [product category] are actually making your [problem] worse.” “We tested every [product type] on the market. This happened.” The hook works by creating an information gap that the viewer wants to close — which means they keep watching.

    Structure: Partial claim or intriguing question → withhold the resolution for 3–5 seconds → product reveal as the answer.
    Best for: Educational or consideration-phase keywords, research-mode shoppers, and categories where the viewer has existing knowledge and opinions they’re willing to challenge.
    Watch for: Curiosity gap hooks tend to drive strong hold rates and completion rates but sometimes lower immediate CTR — the viewer is engaged but may not yet feel urgency to click. Works best in longer SBV formats (25–30 seconds).

    5. The Proof Hook

    Opens directly with social validation — a specific review snippet, a rating, a user count, a before/after image, or a bold data claim. “47,000 five-star reviews.” “Rated #1 by independent lab testing.” “Before and after: same product, 30 days.” This hook works because social proof is one of the most reliable decision shortcuts in ecommerce. Buyers on Amazon are pre-conditioned to weigh review signals heavily, and a proof hook activates that decision heuristic immediately.

    Structure: Bold proof claim on screen within 1 second → product visual alongside the proof → secondary benefit statement.
    Best for: Products with strong review velocity, established brands with credible third-party validation, or any product with a quantifiable performance claim.
    Watch for: Amazon has policies around specific claim types in ads. Ensure all proof-hook claims comply with advertising guidelines before launching. Unverifiable superlatives (“best in class,” “world’s most”) are typically rejected.

    Before the Sprint Starts: Setup, Budget, and Campaign Architecture

    A 7-day hook testing sprint is only as reliable as the infrastructure supporting it. Running multiple hook variants inside an existing scaling campaign, or testing against a broad match keyword list, introduces too many confounding variables to produce readable results. Setup matters before day one.

    Dedicated Testing Campaigns

    Isolate hook testing inside a separate Sponsored Brands Video campaign, completely distinct from your main scaling campaigns. This prevents test creatives from competing with your proven performers for the same impression pool and ensures budget is being allocated as designed rather than being auto-optimised toward incumbents. The testing campaign runs in parallel with your main campaign — it doesn’t replace it.

    Keyword Selection

    Use a tight keyword cluster of 10–20 exact-match terms that represent your core, highest-intent search queries. Avoid broad match or auto-targeting during the sprint — you want every impression to be from a searcher with equivalent intent so that performance differences between hook variants are attributable to the creative, not to audience variation. The same keyword set should be used across all hook variants to ensure a level testing environment.

    Budget Allocation

    The standard practitioner guidance for 2026 is to run 10–20% of your total SBV budget in testing campaigns and 70–80% in proven scaling campaigns. For a 7-day sprint with 4–5 hook variants, you need sufficient daily budget per variant to generate enough data for a readable signal. A common minimum is approximately $25–$50 per day per variant, which at typical SBV CPCs generates roughly 300–700 clicks per week per creative — enough to get directional hook rate, hold rate, and CTR signals, though CVR will require longer run times to stabilise.

    Ad Group Structure

    Run each hook variant as a separate ad within a single ad group, or in separate ad groups within the same campaign. The critical rule: one creative variable per test. All hook variants should use the exact same body copy, product shots, voiceover script (from second 4 onward), CTA text, and landing page. The only element that differs is the opening 3-second hook. This is what gives you causation rather than correlation when you see performance differences.

    Naming Conventions

    Use a clear naming convention that includes the sprint number, hook type, and variant identifier — for example: SBV_Sprint01_PatternInterrupt_v1, SBV_Sprint01_ResultFirst_v1. This prevents confusion during analysis and makes it easy to build a historical record across sprints that becomes searchable and learnable over time.

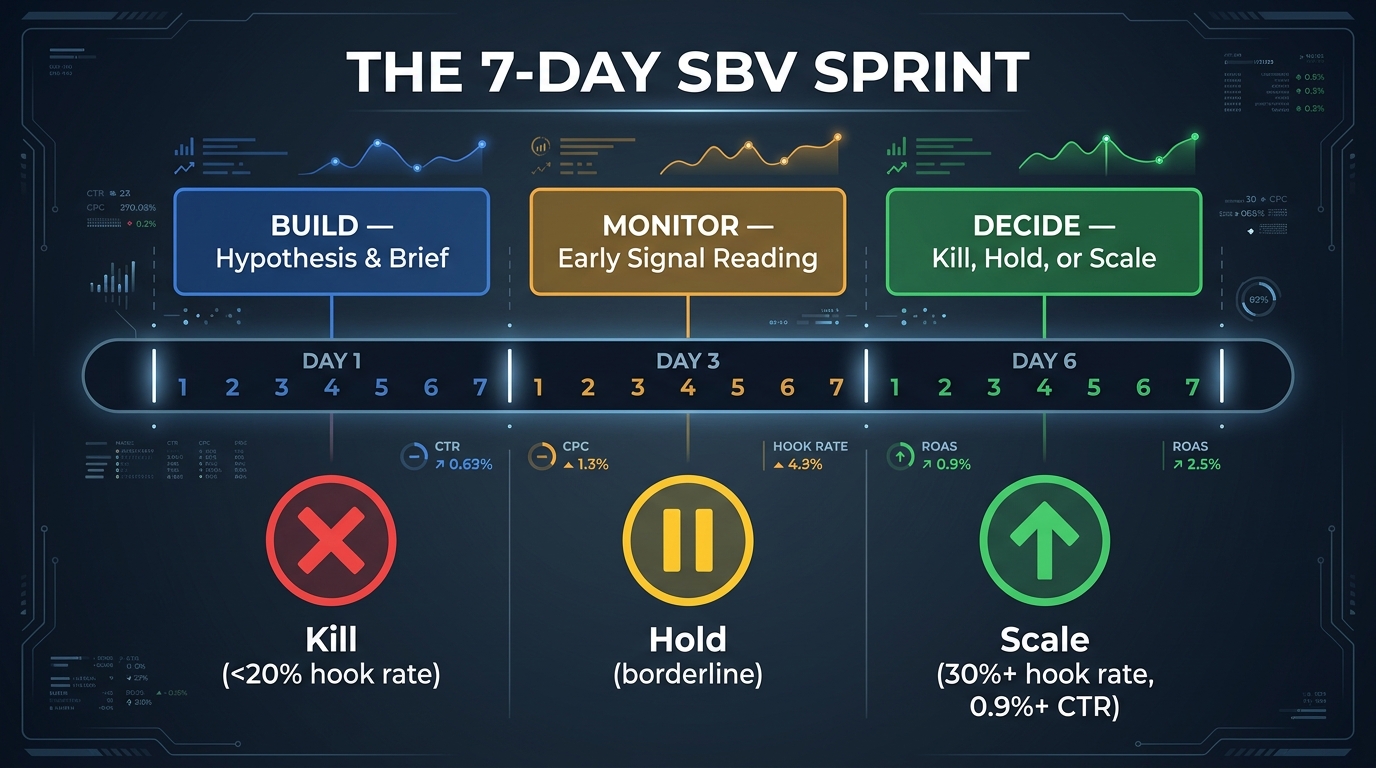
    Days 1–2: Hypothesis Building and Hook Brief

    7-day SBV sprint timeline showing Build phase Days 1-2, Monitor phase Days 3-5, and Decide phase Days 6-7 with kill, hold, and scale thresholds

    Days 1 and 2 are pre-launch. No ads are running yet (unless you’re in the second or later sprint, in which case your previous cycle’s winners are live in your main campaigns). These two days are for structured hypothesis building and creative briefing.

    The Hypothesis Document

    Every hook variant in a sprint should have a written hypothesis — not a vague intent, but a testable prediction. A good hook hypothesis looks like this:

    “We believe a problem-agitation hook opening with a shot of [specific pain point] and the text overlay ‘[specific customer frustration statement]’ will outperform our current result-first hook because our top-performing organic reviews consistently cite this pain point as the primary purchase trigger, and our current creative doesn’t address it until second 12.”

    The hypothesis should include: the hook type, the specific opening content, the rationale (drawn from customer data — reviews, search query reports, competitor analysis), and the predicted performance outcome. Writing the hypothesis forces clarity about what you’re actually testing and why — and it builds a learning database across sprints that tells you which rationales reliably predict wins.

    Sourcing Hypothesis Inputs

    The most reliable inputs for hook hypotheses come from four places. First, your top-performing product reviews — specifically the first sentence of your highest-voted reviews, which tends to be the most emotionally loaded and problem-specific language your customers use. Second, your search query report — the specific terms customers used to find your product tell you the intent frame they were in when they saw your ad. Third, competitor listing analysis — look at the bullet points, A+ content, and review language on your top three competitors to identify the angles and claims they’re leading with that you’re not. Fourth, previous sprint results — if you’ve run earlier sprints, which hook types outperformed? Are there patterns suggesting your audience responds to certain emotional registers or proof types more than others?

    The Hook Brief Format

    For each hook variant, provide the creative team or editor with a one-page brief that specifies: the opening visual (exact shot or stock asset, with timestamp reference if re-cutting existing footage), any text overlay (copy, font weight, position, timing), any voiceover or sound design for the first 3 seconds, and the specific frame where the hook transitions to the established body of the video. This brief-level specificity keeps hook variants genuinely distinct and prevents the creative team from making interpretive choices that blur your variables.

    Days 3–5: Live Monitoring and Early Signal Reading

    Ads launch at the start of day 3. The first 48 hours after launch are not decision-making time — they are observation time. Resist the urge to pause or adjust anything based on the first 24 hours of data. Amazon’s ad serving takes time to stabilise, and small sample sizes in day 1 produce wildly unstable metrics that will mislead you if you treat them as actionable. The platform learning phase needs room to work.

    What to Look At on Day 3

    Check that all variants are serving impressions at roughly equivalent rates. Large disparities in impression volume between variants — where one is getting 10x the impressions of another — often indicates a Quality Score difference, which itself is a useful signal: Amazon’s system may be predicting performance based on early engagement cues. Note the disparity but don’t intervene yet. If one variant is getting near-zero impressions by the end of day 3, investigate the creative for policy issues before assuming poor performance.

    Day 4: First Directional Read

    By day 4 with sufficient budget, you should have enough 3-second view data to see hook rates forming. This is your first genuine signal checkpoint. Look for the spread between variants — are hook rates clustered tightly (suggesting the hook type isn’t the differentiating variable) or spread across a wide range (suggesting strong hook-level performance differences)? A spread of 10+ percentage points between your best and worst hook rate after 48 hours of data is meaningful and directional.

    At this point, note but do not act. Log the current hook rates, hold rates, and any CTR data in your sprint tracking document. Tag your current hypothesis for each variant: “tracking as predicted,” “outperforming prediction,” or “underperforming prediction.” This annotation becomes the learning layer that improves Sprint 2’s hypotheses.

    Day 5: Operational Monitoring

    On day 5, run a more complete signal audit. You should now have enough data to see whether early hook rate leaders are maintaining their hold rates — or whether the relationship is inverting. Check all six signal metrics for each variant:

    • Hook rate: Is it above 20% (minimum viable), above 30% (healthy), or approaching 40%+ (strong)?
    • Hold rate: For any variant with a strong hook rate, is hold rate 45%+? A hook rate above 30% with a hold rate below 30% is a red flag — the opening is clickbait-adjacent.
    • Completion rate: Is the body of the video sustaining the attention the hook generated? Target 35%+.
    • CTR: Is it at or above the SBV benchmark of 0.9%? Below 0.5% after 5 days suggests a hook-to-body disconnect or a keyword-creative mismatch.
    • CVR: Too early for statistical significance, but note directional patterns — any variant showing 0 conversions after significant click volume deserves scrutiny.
    • Spend distribution: Is the campaign allocating spend relatively equally? Significant spend concentration toward one variant early may indicate Amazon’s algorithm has started optimising for a signal you can’t yet see.

    Days 6–7: Kill, Hold, or Scale — The Decision Framework

    The final two days of the sprint are decision time. Every active hook variant gets assigned one of three statuses: Kill, Hold, or Scale. These decisions should be rules-based, not intuition-based. Writing down your decision rules before the sprint starts prevents the cognitive bias of falling in love with a creative you spent time making.

    Kill Threshold

    Any variant meeting one or more of the following criteria gets paused immediately:

    • Hook rate below 20% with adequate impression volume (3,000+ impressions)
    • CTR below 0.5% with at least 500 clicks in flight or 5,000 impressions
    • Hold rate below 25% despite an adequate hook rate — meaning the opening is attracting the wrong audience or making a promise the body doesn’t fulfil
    • ACoS more than 2× your target ACoS with sufficient conversion data (minimum 10 purchases)

    Killing underperformers isn’t wasted effort — it’s the point of the sprint. Every kill generates a documented data point about what your audience doesn’t respond to, which is as valuable as knowing what they do respond to. Log the kill, the metric that triggered it, and your post-hoc hypothesis about why this hook underperformed.

    Hold Criteria

    Hold status applies to variants that show some promising signals but haven’t accumulated enough data for a confident call. Typical hold situations include: a variant launched late due to creative production delays (run it for one additional week), a variant with a hook rate between 22–29% that’s borderline on multiple metrics, or a variant that’s showing unusually strong CVR but weak CTR (which may indicate a highly specific audience self-selecting). Hold variants continue at current budget for an additional sprint cycle rather than being promoted or killed.

    Scale Criteria

    A variant earns Scale status when it meets all of the following:

    • Hook rate 30% or above
    • Hold rate 40% or above
    • CTR at or above 0.9%
    • CVR directionally in line with category benchmarks (10%+ for most ecommerce, though minimum 15 purchases needed for confidence)
    • ACoS at or below 1.5× your target ACoS

    Scale doesn’t mean dramatically increase budget overnight. The practitioner consensus in 2026 is to graduate winning SBV creatives into your main scaling campaign with an initial budget increase of 20–30%, then assess performance at 48–72 hour intervals before increasing further. Aggressive overnight budget multiplications typically trigger a new learning phase, which temporarily destabilises performance metrics and makes it difficult to distinguish scaling effects from learning-phase noise.

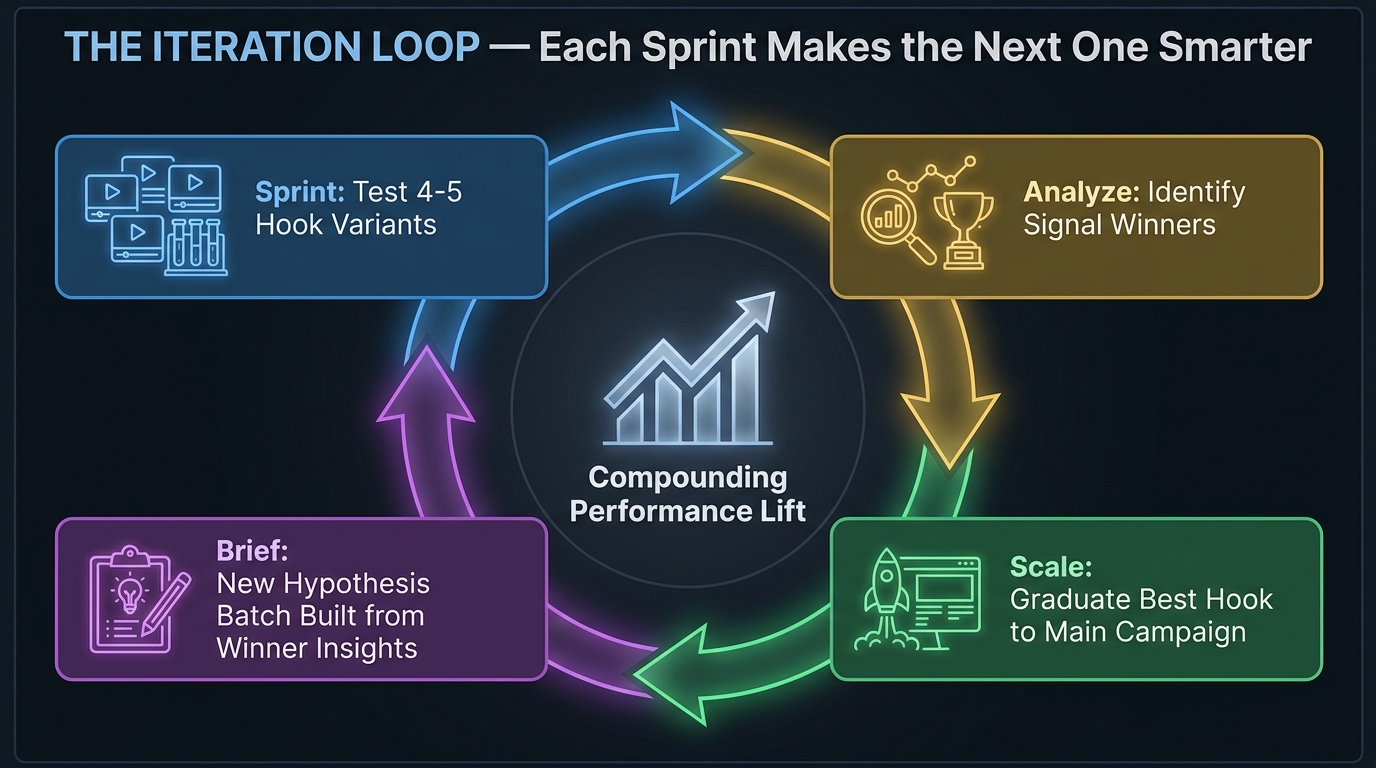
    The Iteration Loop: How Winners Feed the Next Sprint

    Creative sprint iteration loop diagram showing how sprint analysis feeds the next hypothesis batch for compounding performance lift

    The 7-day sprint is not a one-time event. Its value compounds when run as a continuous cycle where each sprint’s output directly informs the next sprint’s hypothesis set. This is what separates teams that genuinely improve creative performance over time from those that run tests without building institutional knowledge.

    The Sprint Retrospective (End of Day 7)

    Before closing the sprint, conduct a structured retrospective with your team. This takes 30–45 minutes and covers five questions:

    1. Which hypothesis predictions were accurate? Where the creative performed as predicted, what made the prediction correct — was it based on review language, keyword intent data, or pattern from a previous sprint? Reinforce that input method.
    2. Which predictions failed? Where performance diverged from prediction, what was the reasoning gap? Did the hook type not match the audience intent? Was the emotional register wrong for the category? Was the problem statement too generic?
    3. What did the data suggest about this audience that you didn’t know before? Look for surprising patterns — a hook type you expected to underperform that showed unusually high hold rate, or a hook type that drove strong CTR but weak CVR (suggesting it was attracting the wrong buyer intent).
    4. What’s the strongest creative hypothesis for Sprint 2? Based on the winner’s attributes, what is the next variation worth testing — a different execution of the same hook type, a bolder version of the winning claim, or a pivot to a new hook archetype informed by the hold rate patterns?
    5. Is the creative fatigue clock ticking on your main campaign? Check whether your current scaling campaign’s hero creative is approaching the 14–21 day fatigue window. If so, sprint 2 needs to move fast enough to have a replacement ready before performance starts degrading.

    Briefing Sprint 2

    Sprint 2’s hook brief should be meaningfully different from Sprint 1’s, not simply Sprint 1 with minor copy tweaks. Use the retrospective outputs to write hypotheses that are more specific and more informed than the first round. If your Sprint 1 winner was a problem-agitation hook using a specific pain point, Sprint 2 might test: a deeper version of that same pain point with more specific language, a result-first hook that uses the exact outcome language from your best-performing reviews, and two entirely new hook archetypes you haven’t tested yet (to ensure you’re not anchoring entirely on the Sprint 1 winner type).

    This deliberate broadening — testing new archetypes even when you have a winner — is important for long-term creative health. Over-indexing on a single hook type because it won Sprint 1 leads to a library of similar creatives that fatigue simultaneously, leaving you without a replacement bench when performance drops.

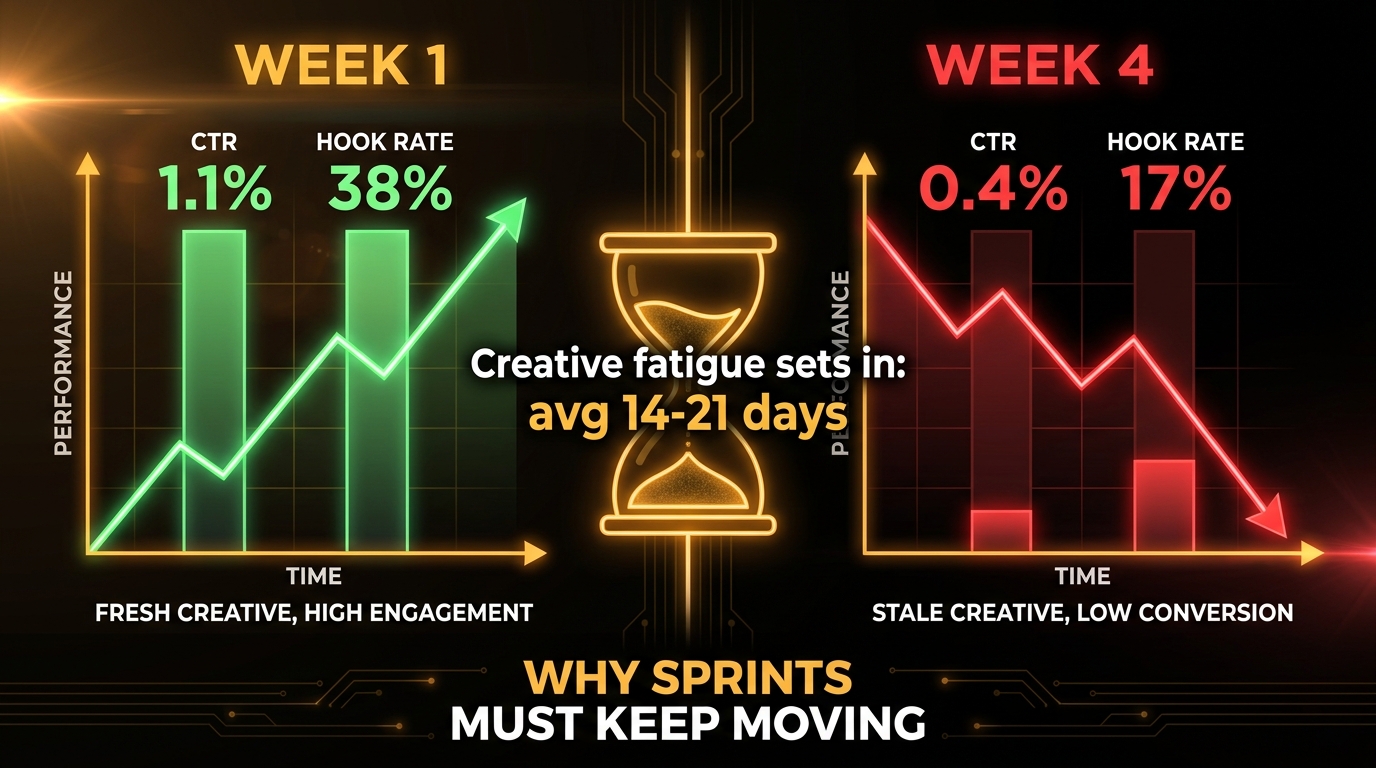
    Creative Fatigue: Why the Sprint Has to Keep Moving

    Creative fatigue comparison showing SBV ad performance declining from Week 1 to Week 4 with CTR dropping from 1.1% to 0.4%

    One of the most consistent findings from SBV advertisers in 2026 is that creative fatigue is arriving faster than it used to, and the consequences of missing the fatigue signal are more expensive than they were two or three years ago. Understanding why this is happening — and how the 7-day sprint system is specifically designed to outrun it — is important context for any team building a testing program.

    The Fatigue Timeline

    At modest Amazon ad spend levels, SBV creatives typically begin showing measurable performance degradation at roughly the 21–30 day mark, with hook rates and CTR starting to slide noticeably. At higher spend levels — where the same creative is generating significantly more impressions per day — fatigue can appear within 10–14 days. The mechanism is straightforward: viewers who have seen the same video two or three times in their search results start scrolling past it automatically. The pattern interrupt no longer interrupts. The curiosity gap has already been closed. The proof claim has been processed and discounted.

    The result is that hook rate starts dropping first — the leading indicator — and CTR and CVR follow within a few days. If you’re checking performance weekly rather than monitoring hook rate daily, you may not catch the fatigue signal until CTR has already dropped significantly and you’ve spent seven to ten days driving expensive, low-engagement impressions.

    The 7-Day Sprint as a Fatigue Prevention System

    The sprint methodology addresses fatigue structurally rather than reactively. Because you’re running a new sprint every week, you’re continuously building a bench of tested hook variants that can be rotated into your main campaigns before performance degrades. The goal is to never be in the position of scrambling to produce new creative because your current video is fatiguing — instead, you have the next winner ready and tested before it’s urgently needed.

    Practically, this means that after three to four sprints, you should have a portfolio of validated hooks — some actively scaling, some in reserve, and one sprint always in flight generating the next batch of candidates. This creative pipeline model, rather than the reactive “our video is failing, what do we do?” approach, is the operational advantage that consistent sprint practitioners build over time.

    Rotation Strategy

    Rather than running a single winning creative until it fatigues, experienced SBV advertisers run a rotation of two to three validated hooks simultaneously in their main campaigns, refreshing one hook variant every two to three weeks even when performance hasn’t visibly degraded yet. This proactive rotation prevents the sharp performance cliff that comes from replacing a fatigued creative with an untested one. Instead of: strong performance → rapid decline → scramble → uncertain replacement → slow ramp, the pattern becomes: consistent strong performance → controlled rotation of tested variants → no cliff.

    Common Sprint Failures and How to Avoid Them

    Teams new to sprint-based creative testing consistently hit a small number of predictable failure modes. Knowing them in advance significantly reduces the number of sprints you waste before the system starts delivering reliable results.

    Testing Too Many Variables at Once

    The most common mistake: running hook variants that differ in more than one element. If Hook A and Hook B differ in both the opening visual and the voiceover copy in the first three seconds, and Hook A wins, you don’t know whether it was the visual or the copy that drove the win. That means you can’t brief Sprint 2 with meaningful specificity. Every hook variant in a sprint should differ from the others in exactly one element. Everything else is held constant.

    Killing Too Early on Insufficient Data

    The 7-day minimum window exists for a reason. Hook rate can look extremely weak on day 1 and normalise by day 4 as the algorithm finds its footing. Pulling a creative after 18 hours because the CTR looks low wastes the creative production investment and guarantees you never accumulate enough data to make the kill/hold/scale decision confidently. Write your kill thresholds before the sprint starts, apply them only after the minimum data threshold is met, and do not deviate based on early snapshots.

    Conflating Hook Rate with CTR

    These are related but different signals measuring different things. A hook that drives a 42% hook rate but a 0.6% CTR is telling you something important: you’re capturing attention but failing to convert that attention into a click. The disconnect is happening somewhere in the body of the video, the CTA, or the product’s alignment with the searcher’s intent. Don’t kill the hook — investigate the body. Don’t scale the creative either, but use this data to brief a hybrid test: strong hook with a revised body and CTA.

    Running Tests Against Non-Comparable Audiences

    If your hook variants are served against different keyword sets — for example, Hook A against branded keywords and Hook B against category keywords — your results are unreadable. Branded and category audiences have different intent, different product familiarity, and different conversion propensity. Always keep the keyword set identical across all hook variants in a sprint.

    No Sprint Documentation

    Sprints without written hypothesis documents, signal logs, and retrospective notes produce data without learning. Teams that don’t document their sprint process find themselves running the same tests six months later because they don’t have a record of what was already tested and what those tests revealed. The 30-minute investment in documentation per sprint compounds into a genuinely differentiated creative intelligence asset within four to six sprint cycles.

    Measuring Sprint ROI: What Good Looks Like After 4 Rounds

    The question every team asks before committing to a sprint system: what does success look like, and how long does it take to get there? The honest answer is that Sprint 1 is unlikely to produce dramatic performance improvements — it’s primarily a calibration round that establishes your baseline signal stack, validates your testing infrastructure, and produces your first documented creative hypotheses. The compounding returns arrive from Sprint 3 onward.

    Four-Sprint Performance Trajectory

    Based on the patterns observed across mature SBV testing programs in 2026, here’s what a typical four-sprint progression looks like in performance metrics:

    • Sprint 1: Baseline establishment. Hook rates across variants typically spread across a 12–18 percentage point range. One or two hooks emerge as directional winners. CTR performance usually falls within 10–15% of pre-sprint baseline. Primary output: first set of validated hypotheses and a confirmed testing infrastructure.
    • Sprint 2: First meaningful performance gain. With better hypotheses built from Sprint 1 data, hook rate for the winning variant typically improves 5–8 percentage points above Sprint 1’s winner. CTR improvement of 15–25% over baseline is common. Primary output: first scalable creative and beginning of a rotation bench.
    • Sprint 3: Compounding intelligence. Hypothesis accuracy improves noticeably because you’re drawing on two rounds of actual audience response data. Hook type preferences are becoming clear, allowing more targeted creative briefs. CTR 30–40% above pre-sprint baseline is achievable for teams with strong creative execution. Primary output: second scalable creative, rotation strategy operational, fatigue prevention system working as intended.
    • Sprint 4: System maturity. The team is fluent in the sprint process, documentation is becoming a genuine creative intelligence database, and performance has stabilised at a materially higher level than the pre-sprint baseline. ACoS improvements of 15–25% are typical for teams that have successfully scaled two or more sprint winners. New-to-brand rate often improves as the optimised hook messaging aligns better with discovery-intent searchers. Primary output: a repeatable, self-improving creative engine that reduces dependence on any single creative asset.

    Tracking Sprint-Level ROI

    Calculate sprint ROI by comparing: the cost of running the sprint (creative production for 4–5 hook variants, plus the testing campaign ad spend) against the performance improvement in your main campaign attributable to the winning creative. If a sprint winner drives a 20% CTR improvement and a 12% CVR improvement in your main campaign over 30 days post-graduation, and your main campaign spend is $10,000/month, the attributable performance improvement should be quantifiable in ACoS and revenue terms. Most teams running this calculation consistently find that sprint 3 and beyond show a clear positive ROI on creative testing investment, with the creative production cost of a hook variant ($150–$500 for a well-structured sprint using existing footage re-cut with new hooks) representing a small fraction of the performance delta at meaningful ad spend levels.

    Conclusion: The Structural Advantage of Testing Before You Scale

    Sponsored Brands Video is one of the highest-leverage formats in the Amazon advertising ecosystem. But leverage is only realised when the creative doing the lifting is actually working. The hook-first 7-day iteration sprint is the operational system that ensures you’re not scaling a mediocre creative — you’re scaling a tested, signal-validated one that has earned its promotion.

    The core ideas to carry forward:

    • The hook is the first test because it’s the highest-leverage and lowest-cost variable to change. Never spend budget optimising body copy, CTA, or format when the hook hasn’t been validated.
    • Use the full signal stack, not just CTR. Hook rate tells you about attention. Hold rate tells you about creative integrity. Completion rate tells you about narrative strength. CTR and CVR tell you about commercial performance. You need all of them to make good decisions.
    • Decision rules belong on paper before the sprint starts, not improvised during it. Kill thresholds and scale criteria written in advance prevent confirmation bias from distorting your reads.
    • Creative fatigue is an inevitable physics problem. The only way to stay ahead of it is to have validated replacement creatives ready before degradation sets in — which requires a continuous sprint cycle, not a reactive production scramble.
    • Documentation compounds. Every sprint that’s properly documented makes the next sprint’s hypotheses more accurate. After four rounds, your creative intelligence is a real competitive asset. After eight, it’s defensible.

    The 7-day sprint won’t feel efficient in the first round. The infrastructure setup takes time. The hypothesis writing feels theoretical. The signal reads are ambiguous with small data sets. Run it anyway. The teams consistently generating the strongest SBV performance in 2026 aren’t the ones with the biggest production budgets or the most sophisticated creative. They’re the ones that test methodically, document honestly, and let the signal stack tell them what to scale — rather than guessing.

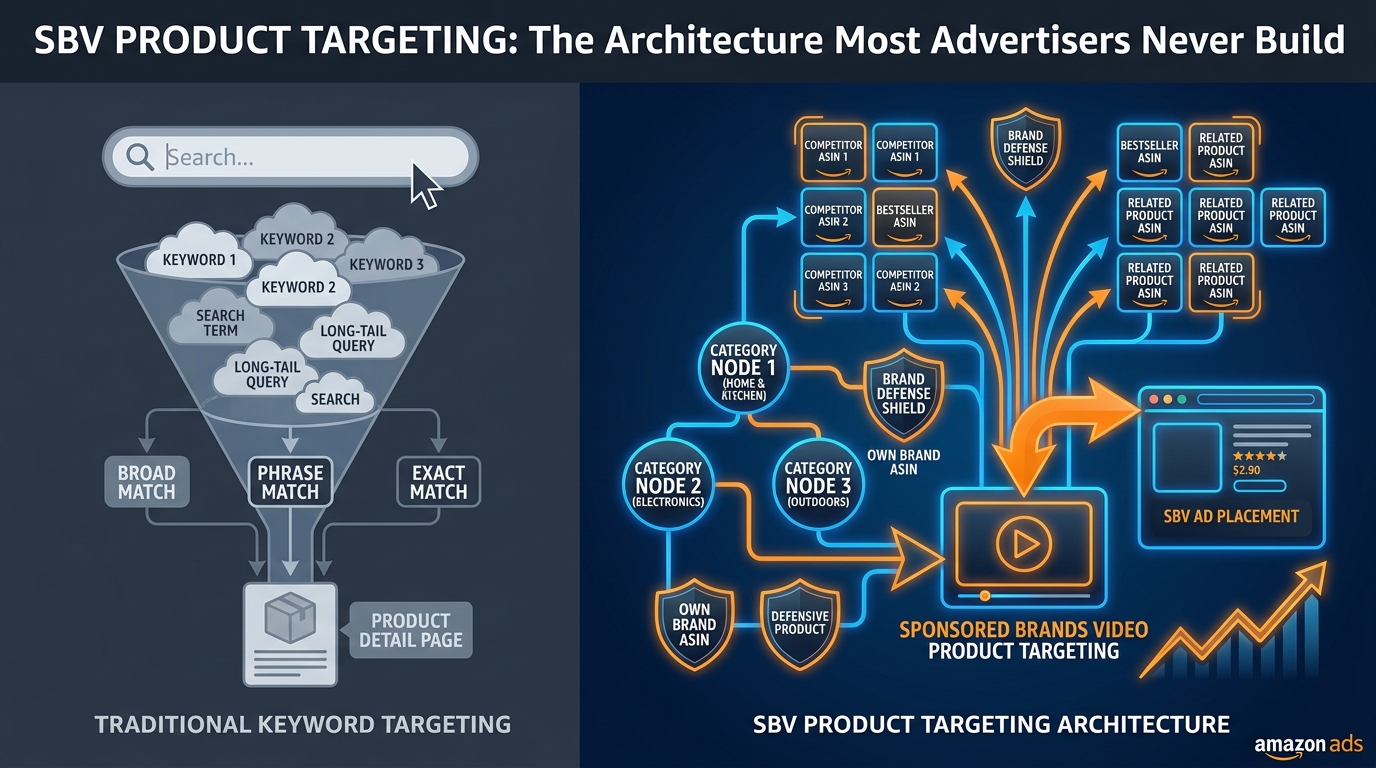
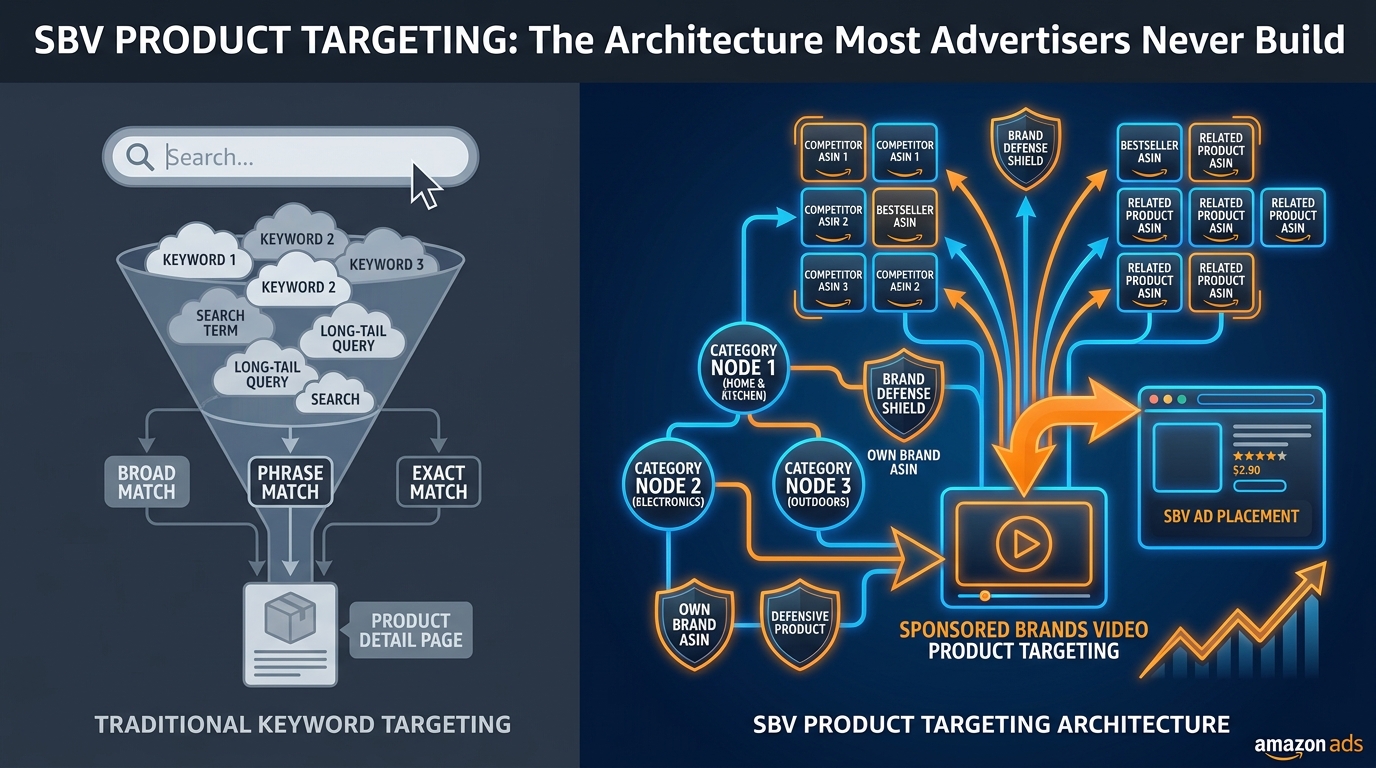
  • SBV Product Targeting: The Structural Playbook Most Amazon Advertisers Skip

    SBV Product Targeting: The Structural Playbook Most Amazon Advertisers Skip

    SBV Product Targeting Architecture vs Keyword Targeting — split infographic showing the two approaches side by side

    Most Amazon advertisers who run Sponsored Brands Video are only operating at half capacity. They set up their SBV campaigns against a keyword list, point the creative at a product detail page or Brand Store, check the ACOS weekly, and call it a strategy. The video format gets the credit — or the blame — while the targeting layer goes almost completely unexamined.

    That’s a significant structural gap, and it’s one that’s widening in 2026. As more brands pile into SBV with keyword-centric campaigns, the product targeting side of the format is becoming one of the least-contested, highest-potential spaces in Amazon advertising. The inventory is different, the intent signals are different, the creative requirements are different, and — critically — the measurement framework needs to be completely different too.

    This isn’t a post about why SBV is good or how to make a video. It’s a deep dive into the product targeting architecture specifically: how it works mechanically, how to structure campaigns around objective-based segments rather than ad group dumps, how to set bids that actually reflect placement behavior, and how to measure what matters when your audience isn’t searching for you — they’re actively looking at a competitor.

    If you’ve already moved some SBV budget into product targeting and seen mixed results, this is for you. If you haven’t started, this will show you exactly why you’re leaving measurable efficiency gains on the table.

    Why SBV Product Targeting Is a Fundamentally Different Channel

    The default mental model for Sponsored Brands Video is a search channel. A shopper types a query, a video unit appears at the top or inline within results, and the shopper either clicks or doesn’t. That model works — SBV consistently outperforms static Sponsored Brands on CTR in search environments, with multi-account analyses showing video CTR running roughly 2–3× higher than image-based formats on equivalent keywords.

    Product targeting breaks this model entirely. When you run SBV with product or category targeting, your ad is no longer appearing to someone in search mode. It’s appearing to someone in evaluation mode — someone who has already clicked through to a product detail page and is actively deciding whether to buy that specific item. The psychology, the buying stage, and the competitive dynamic are all different.

    The Intent Gap Between Search and PDP

    Consider what a shopper is doing when they land on a competitor’s ASIN page. They’ve already navigated past the search results. They’ve chosen to invest time in evaluating a specific product. They’re reading reviews, examining images, comparing prices, and deciding. This is not a passive audience — it’s arguably the highest-intent audience on the entire platform, and they’re sitting on someone else’s listing.

    That’s what product-targeted SBV is actually reaching: a shopper who is milliseconds from making a purchase decision, but hasn’t committed yet. The creative job is completely different from search. You’re not trying to get attention. You’re trying to interrupt an evaluation and create a better alternative in the moment.

    Where Product-Targeted SBV Actually Appears

    Amazon’s placement inventory for product-targeted SBV has expanded meaningfully. The primary placement is below A+ content on the product detail page itself, where a video carousel surfaces to shoppers who are deep into their product review. But product-targeted SBV also feeds into inline search placements, meaning the same campaign targeting competitor ASINs can also appear in search results for the queries those ASINs rank for.

    This dual-placement behavior is one of the more underappreciated mechanics of the format. You’re not just buying PDP inventory when you product-target — you’re also getting adjacent search exposure without fighting in the top-of-search keyword auction. That’s a meaningful cost advantage in high-competition categories.

    The CPC Difference — And Why It’s Structural

    Product-targeted SBV CPCs consistently run lower than top-of-search keyword CPCs in competitive categories. This is partly a supply-demand story — fewer advertisers are using this targeting method — but it’s also structural. PDP placements don’t trigger the same aggressive bidding behavior as keyword auctions because fewer brands have set up dedicated product-targeting campaigns with serious budget allocation. The floor is lower, and the ceiling is higher for efficiency-minded buyers who get there first.

    Diagram showing where Amazon SBV ads appear across placements — top of search, inline, below fold, and product detail page

    The Three Campaign Archetypes: Defensive, Conquesting, and Cross-Sell

    The single biggest structural mistake in SBV product targeting is treating it as one undifferentiated campaign type. Advertisers who are seeing inconsistent results typically have one campaign mixing competitor ASINs, their own ASINs, and vague category targets — all measured against the same ACOS target. That’s a recipe for budget waste and misleading performance data.

    Advanced practitioners in 2026 are building SBV product targeting around three distinct campaign archetypes, each with different ASIN lists, different bid levels, different creative, and different success metrics. Here’s how each one works.

    Three campaign archetypes for SBV product targeting — Defensive, Conquesting, and Cross-Sell infographic

    Archetype 1: Defensive Product Targeting

    Defensive campaigns target your own ASINs. The goal is to prevent competitor video ads from appearing on your product detail pages while reinforcing the purchase decision for shoppers who are already on your listing. This is often the first type of SBV product targeting an account should set up, because it protects existing conversion paths before you go on offense elsewhere.

    Defensive campaign setup involves targeting your own top-selling ASINs (and their variations) with your SBV creative. Since these shoppers are already on your page, the creative can be softer — focused on reassurance, key differentiators, and social proof. The conversion rate in defensive campaigns tends to be higher than in any other product targeting type because the audience is already warm and already intent-matched to your product.

    Key metrics to watch in defensive campaigns: conversion rate, spend efficiency (ACOS), and — if you have Brand Analytics access — the ratio of shoppers who view your ad on your own PDP but then proceed to a competitor. A defensive campaign doing its job keeps that exit rate low.

    Bidding philosophy for defensive campaigns: you can often sustain higher bids here than in conquesting campaigns because the audience is higher quality and you’re protecting existing revenue rather than acquiring new. Think of it like defending territory you already own — the cost of losing it is higher than the cost of holding it.

    Archetype 2: Conquesting Product Targeting

    Conquesting campaigns target competitor ASINs. This is the most talked-about use case for SBV product targeting, but also the most frequently misexecuted. The common mistake is targeting every competitor ASIN in the category without any filtering logic, which produces bloated impression counts, low conversion rates, and a misleading ACOS story.

    Effective conquesting requires ASIN selection criteria, not just ASIN lists. The strongest-performing conquesting targets share specific characteristics:

    • Price parity or slight premium: Targeting ASINs priced significantly higher than your product creates natural comparison advantage. Targeting ASINs priced lower usually backfires — you’re interrupting shoppers who are looking for a cheaper option and won’t convert on your higher-priced alternative.
    • Review vulnerability: ASINs with ratings below 4.1, or those with a significant volume of recent 1- and 2-star reviews mentioning specific issues you don’t have, are high-value conquesting targets. Shoppers in doubt are shoppers who can be redirected.
    • Adjacent feature gaps: Competitor ASINs that lack features your product has — and where those features are prominent in customer reviews — are ideal targets for video creative that leads with that specific differentiator.
    • Stockout or inventory risk signals: Competitors experiencing frequent stockouts or long shipping delays are among the best short-term conquesting opportunities.

    Conquesting campaign metrics must be held to different standards than defensive. The conversion rate will be lower — you’re reaching shoppers who had already chosen a different product. The success metric is not ACOS in isolation; it’s new-to-brand order rate and customer acquisition cost relative to other awareness channels. More on this in the measurement section below.

    Archetype 3: Cross-Sell Product Targeting

    Cross-sell campaigns target your own ASINs or complementary products with creative that promotes a different ASIN — typically a bundle item, an accessory, or the next tier up. If you sell coffee equipment and someone is on your grinder listing, a well-placed video for your pour-over kettle is a natural extension of their purchase journey.

    Cross-sell campaigns are the most overlooked of the three archetypes, but they often deliver the strongest ROAS because the audience is already proven — they’re buying in your category, often from your brand. The creative brief is different: the hook is the connection between what they’re looking at and what you’re showing, not a head-to-head comparison.

    Cross-sell SBV also creates a valuable data feedback loop. When you see which ASIN pairings drive the strongest cross-sell conversion, that data informs your listing content, bundle strategy, and even your A+ content cross-links. The campaign becomes both a revenue driver and a product development signal.

    ASIN Targeting vs. Category Targeting — The Strategic Decision Matrix

    Within SBV product targeting, Amazon gives you two main levers: target specific ASINs, or target product categories (with optional refinements by price range, brand, rating, and Prime eligibility). These are not interchangeable, and mixing them without a clear logic creates campaigns that are impossible to read and optimize.

    ASIN targeting vs category targeting comparison chart showing efficiency vs scale tradeoff in SBV campaigns

    When ASIN Targeting Is the Right Tool

    ASIN targeting is the precision instrument. Use it when you have specific, data-identified targets that meet your conquesting criteria — competitor ASINs with the characteristics described above, your own defensive ASIN list, or specific cross-sell pairings. ASIN targeting gives you exact placement control, exact impression attribution, and clean performance data at the target level.

    The primary downside of ASIN targeting is scale. A list of 20–50 carefully selected competitor ASINs will only serve so many impressions. As those ASINs receive your ads and their shoppers either convert or don’t, you exhaust the inventory relatively quickly. This is why ASIN targeting campaigns require active curation — you need to continuously add new targets as market conditions shift and remove targets that are either converting too poorly or showing budget exhaustion.

    Best practice: keep ASIN-targeted campaigns at a size you can actually review weekly. For most accounts, that means segmented lists of 30–100 ASINs per campaign, broken out by product line or competitive cluster. Larger lists become unmanageable and obscure performance signals.

    When Category Targeting Makes More Sense

    Category targeting is the volume lever. Use it when you want to reach the broadest possible in-category audience — particularly in new-to-brand customer acquisition scenarios — without the curation overhead of maintaining ASIN lists. Category targeting with refinements (price range, minimum rating, Prime eligible only) can produce surprisingly tight audiences while maintaining much higher impression volume than ASIN lists.

    The tradeoff is relevance noise. A category target by definition includes ASINs that may be only tangentially related to your product, or that serve audiences with different intent profiles. Your creative has to work harder because the match between audience and message is less precise. CTR will typically run higher in category campaigns (more inventory = more impressions from browsing shoppers), but conversion rates will lag ASIN-targeted campaigns.

    The Hybrid Structure Most Advanced Accounts Use

    The most effective SBV product targeting architecture combines both within a single objective, run as separate campaigns with shared learnings:

    1. Phase 1 — Category Discovery: Run a category-targeted SBV campaign with broad refinements. Let it gather impression and click data across the category for 3–4 weeks.
    2. Phase 2 — ASIN Mining: Pull the Search Term Report (which, in product targeting mode, shows you which specific ASINs served your ad and at what efficiency). Identify the top-performing individual ASINs from the category campaign.
    3. Phase 3 — Graduated to ASIN Targeting: Migrate your best category performers into a dedicated ASIN-targeted campaign with more aggressive bids, where you can control placement and budget with surgical precision.

    This phased approach uses category targeting as a discovery engine and ASIN targeting as the scaled, optimized execution layer. It avoids the guesswork of building ASIN lists from scratch and prevents you from allocating serious budget to targets you haven’t validated yet.

    Bid Architecture: Why Flat Bids in Product Targeting Campaigns Are Leaving Money on the Table

    The majority of Amazon advertisers running SBV product targeting are using flat bids — one CPC applied uniformly across all targets in a campaign, with maybe a coarse placement modifier on top. This approach ignores the dramatic differences in conversion value across different placement types and different target segments.

    Understanding Placement Behavior in Product Targeting

    SBV product targeting campaigns serve across multiple placements, each with different user intent profiles and conversion rates:

    • Product Detail Page (PDP) placements: Below A+ content in the video carousel. These are typically mid-to-high intent — the shopper is deep in evaluation. Conversion rates here are among the highest for product-targeted campaigns.
    • Top of Search placements: Even with product targeting enabled, SBV can surface at the top of search results for relevant queries. These impressions have high visibility but lower specificity — the intent is search-driven, not evaluation-driven.
    • Rest of Search / Below Fold: Impressions lower in the search results page. These tend to deliver more volume at lower CPCs, with moderate conversion rates.

    Amazon’s placement bid modifiers — which let you increase or decrease bids for top-of-search and product detail page placements specifically — are the levers to use here. But most advertisers apply modifiers based on habit or best guesses rather than actual performance data.

    How to Build a Data-Driven Bid Tier Structure

    The correct approach is to run a placement analysis first. After 3–4 weeks of campaign data, pull the Placement Report and segment performance by placement type. This will show you cost-per-click, conversion rate, and ACOS or ROAS for each placement independently. From this data, you can calculate an implied justified bid per placement based on your target ACOS.

    If your PDP placement is converting at twice the rate of your top-of-search placement, your base bid + PDP modifier should reflect that — not be set at an arbitrary 50% uplift because that “feels right.” The math should drive the modifier.

    Practically, advanced practitioners are segmenting bids across three tiers:

    • Tier 1 — Defensive PDP (own ASINs): Highest bid, because conversion rate is strongest and cost of losing the placement to a competitor is highest.
    • Tier 2 — Conquesting PDP (competitor ASINs): Mid-range bid, with tighter ACOS targets and emphasis on NTB metrics rather than immediate ROAS.
    • Tier 3 — Category/Search hybrid placements: Lower base bid, placement modifiers suppressed or neutral, volume-focused with discovery intent.

    This tier structure makes it possible to hold each campaign to an appropriate, objective-specific standard rather than blending everything into an account-average ACOS that masks which segments are actually performing.

    The Negative ASIN Layer: The Single Most Overlooked Optimization in SBV

    Ask most advertisers running SBV product targeting how their negative ASIN strategy works, and you’ll get a blank stare. The majority of product targeting campaigns have no negative ASIN list whatsoever. This is a significant missed optimization, and in 2026 it’s one of the clearest differentiators between accounts running SBV at intermediate versus advanced levels.

    Why Negative ASINs Matter More in Product Targeting Than Keyword Campaigns

    In keyword campaigns, negative keywords filter out irrelevant search queries. In product targeting campaigns, negative ASINs filter out specific product pages where your ad should not appear — competitor listings that are too far outside your price range, categories that generate clicks but never convert, your own product variants that would create internal cannibalization, or ASINs associated with audiences who have fundamentally different needs than your ideal buyer.

    Without negative ASINs, your campaign is effectively serving on every page in the category or ASIN list with equal weight. This means a portion of your budget consistently flows to placements that have never converted and never will — but because the data is blended, it’s invisible in aggregate performance numbers.

    Building Your Negative ASIN List: Four Categories to Address

    1. Price-Mismatched ASINs
    If your product is priced at $45, targeting ASINs priced at $12–18 creates an audience mismatch. Shoppers on budget product pages are budget-motivated; your video ad appearing with a $45 product will rarely convert them. Pull the ASIN targeting report, filter by ASINs with high impressions and zero conversions, cross-reference with pricing data, and negative-match the price outliers.

    2. Own-Brand Cannibalization ASINs
    If your conquesting campaign is accidentally appearing on your own product pages (which can happen in broad category campaigns), you’re paying to reach your own customers. Negative-match your entire brand ASIN catalog from any conquesting or category campaigns.

    3. High-Click, Zero-Convert Chronic Underperformers
    After 30+ days of data, identify ASINs in your targeting that have accumulated 15+ clicks with zero conversions. Some of these will eventually convert; many won’t. Apply a spending threshold (e.g., 2× your target CPA with no order) and systematically negative-match chronic underperformers. Review and update this list monthly.

    4. Category Bleed ASINs
    When using category targeting with broad category nodes, Amazon sometimes serves your ad on loosely related sub-categories that aren’t actually your competitive set. Identify sub-category ASINs that are generating spend but are clearly off-target (wrong product type, wrong audience) and negative-match those ASIN prefixes or specific products.

    Negative ASIN Review Cadence

    Best practice is to audit your negative ASIN lists on a 30-day cycle, not as a one-time setup. Market conditions change, competitor ASINs change (new products, pricing shifts, review changes), and what was a valid target six weeks ago may now be a chronic money drain. Build negative ASIN review into your monthly PPC workflow as a standing agenda item alongside bid reviews.

    Creative That Actually Works in Product Targeting Environments

    SBV creative best practices — video timeline breakdown showing the first-3-seconds rule and key production requirements

    SBV product targeting introduces creative requirements that don’t apply in keyword environments — and getting the creative wrong is the fastest way to waste a well-built targeting structure. The mechanics of how your video appears on a product detail page versus in search results create distinct behavioral contexts that most advertisers don’t account for in production.

    The Autoplay-Muted Problem

    All SBV ads autoplay on mute. This is a known format behavior, but its creative implications are frequently underweighted. When your video appears on a competitor’s product detail page, the shopper is reading — they’re scanning reviews, looking at images, checking Q&A sections. Your video starts playing silently in the lower portion of the page.

    This means your video must communicate its core message visually within the first 3 seconds — not just audio-visually. On-screen text, bold product close-ups, and motion that signals the product category are non-negotiables. A video that opens with a lifestyle scene, ambient music, and no text overlay is a video that disappears into the background noise of the page. A video that opens with a clear product shot and a one-line text hook earns a tap to unmute and a click.

    The First-3-Seconds Rule in Product Targeting Context

    Amazon’s own research and practitioner data consistently affirm that the first three seconds of an SBV creative determine whether a viewer engages further. In a PDP placement, this is even more stark: the shopper is already mentally engaged with a different product. Your video is an interruption. That interruption needs to be worth their attention immediately — not after a slow intro or a logo reveal.

    High-performing product-targeted SBV creatives typically follow this structure:

    • 0–3 seconds: Product clearly visible, bold text overlay with a problem statement or differentiator, no slow zoom or fade-in. The product is the first frame, not the third.
    • 3–8 seconds: Key benefit articulated visually and in text — show the product doing the thing, not a person looking satisfied in an abstract setting.
    • 8–13 seconds: Proof layer — star rating callout, specific feature demonstration, before/after, or a testimonial-style text overlay.
    • 13–15 seconds: Clear call to action. “Shop Now.” “Compare.” “See the difference.” Short, direct, matching the competitive context.

    Why Product Targeting Creative Should Differ From Search Creative

    This is the creative strategy gap most brands don’t close. Advertisers who build one SBV video and run it across both keyword campaigns and product targeting campaigns are treating fundamentally different placement contexts with the same message. Search creative can afford a slightly softer hook because the shopper typed a query that signals intent — you already have some relevance. Product targeting creative has to earn relevance in the first moment because the shopper didn’t ask to see you.

    The most effective approach is to build separate creative variants for each campaign archetype:

    • Defensive creative: Reinforcement-focused. Lead with social proof, key features, reassurance. The shopper is already on your page — the creative job is confirmation, not conquest.
    • Conquesting creative: Comparison-friendly but not aggressive. Lead with your differentiator relative to the type of product you’re appearing on. If you’re conquesting a competitor with poor reviews for durability, open with a product demonstration that speaks directly to that gap.
    • Cross-sell creative: Context-connector. The hook is the pairing, not the product itself. Connect what the shopper is looking at to what you’re showing them, and the relevance does the heavy lifting.

    Amazon’s video production specs allow 6–45 seconds for SBV, with 15–30 seconds consistently recommended as the sweet spot. In product targeting placements, 15 seconds is often sufficient — the creative job is more surgical than in brand awareness contexts.

    Measuring What Actually Matters: NTB Metrics, AMC, and Incrementality

    New-to-Brand NTB measurement framework for Amazon SBV — funnel diagram showing NTB order rate, NTB percentage of sales, and AMC measurement

    The measurement failure in most SBV product targeting accounts is applying keyword campaign metrics to product targeting campaigns. ACOS as a primary success metric is meaningful in search — where the shopper had purchasing intent baked in from the query. In product targeting, where you’re reaching shoppers who were going to buy a competitor’s product moments ago, ACOS as a standalone metric is actively misleading.

    New-to-Brand Metrics: The Right Primary KPI for Conquesting Campaigns

    Amazon makes new-to-brand (NTB) metrics natively available for Sponsored Brands campaigns, including SBV. These metrics report the number of orders from customers who haven’t purchased from your brand in the past 12 months, as well as NTB sales volume and NTB percentage of total orders.

    For conquesting campaigns, NTB rate should be the first metric you look at — not ACOS. A conquesting campaign with a 45% ACOS and a 78% NTB order rate is doing something fundamentally valuable: it’s finding new customers who wouldn’t have discovered your brand otherwise. Evaluated purely on ACOS, that campaign looks inefficient. Evaluated on customer acquisition cost relative to your average customer lifetime value, it may be one of the most profitable campaigns in the account.

    NTB metrics also help you separate genuine acquisition performance from cross-sell noise. If your “conquesting” campaign is actually driving repeat buyers (low NTB rate), it’s not conquesting at all — it’s retargeting existing customers, which means your ASIN selection is off and you’re showing up on listings your own customers are also browsing.

    Amazon Marketing Cloud: The Attribution Intelligence Layer

    Amazon Marketing Cloud (AMC) is the SQL-based data clean room that allows advertisers to run cross-channel attribution queries against impression, click, and conversion data that isn’t available in standard Campaign Manager reports. For SBV product targeting, AMC enables two analysis types that are not possible with native reporting:

    Overlap analysis: AMC can show you what percentage of shoppers who were exposed to your SBV product targeting campaign were also exposed to Sponsored Products or Sponsored Display campaigns targeting the same audiences. If there’s significant overlap, you may be over-spending by reaching the same shoppers multiple times across formats — AMC makes this visible so you can deconflict campaigns or adjust frequency caps.

    Path-to-purchase analysis: AMC can show how SBV product targeting fits into the full customer journey. For many brands, the data reveals that SBV product targeting functions as a mid-funnel touchpoint — shoppers who see a SBV ad on a competitor’s page don’t always convert immediately, but they’re more likely to convert when later exposed to a keyword ad or when they return to the product directly. This path-level view makes SBV’s contribution legible in a way that last-click attribution models completely miss.

    The Incrementality Question

    The hardest question in SBV product targeting measurement is: would these sales have happened anyway? For defensive campaigns targeting your own ASINs, a version of this question is always lurking — if you weren’t running the defensive campaign, how many of those purchases would your competitor have captured?

    Incrementality testing for SBV is possible through geographic holdout structures or Amazon’s own lift study options (available to larger-budget advertisers through managed accounts). But for accounts that don’t have access to formal lift studies, the practical proxy is to monitor your conversion rate on defended ASINs relative to ASINs where you’ve deliberately paused defensive coverage. The delta provides a directional estimate of what the campaign is actually protecting.

    Mining Existing Campaign Data to Build Your Product Target Lists

    One of the most common questions practitioners ask is: where do I get the ASINs to target? The answer is almost always in data you already have — you’re just not looking in the right reports.

    The Sponsored Products Search Term Report

    If you’re running Sponsored Products with product targeting already, your Search Term Report contains a goldmine of ASIN-level data. In product targeting mode, the report shows you which specific ASINs triggered your Sponsored Products ads — including competitor ASINs where your ads appeared, and critically, which ones converted. Start your SBV product target list with the top-converting ASINs from your SP product targeting report. These are validated targets with proven purchase intent correlation.

    Brand Analytics Competitor Data

    Amazon Brand Analytics provides the Market Basket analysis (what items customers buy together) and the search frequency report (which ASINs rank for the same queries your products rank for). The Market Basket data identifies natural cross-sell targets for your cross-sell archetype campaigns. The query-based overlap data identifies which competitor ASINs are fighting for the same search traffic you are — prime conquesting targets.

    Sponsored Display Report Mining

    If you’re running Sponsored Display with product targeting, those campaigns have been collecting conversion data on ASIN-level targets for potentially months. Pull the Targeting Report from your Sponsored Display campaigns and sort by conversion rate and orders. The top performers are high-confidence SBV product targets. You already know they convert — now put a video creative in front of those placements and give the format’s higher CTR a chance to amplify the results.

    Reverse-Engineering Competitors’ Targeting

    One underutilized signal is your own listing’s traffic data. In Seller Central’s traffic reports and Brand Analytics, you can see which search terms are driving shoppers to your PDP. Many of those shoppers are also browsing competitor ASINs that rank for the same terms. Use the overlap between your top traffic-driving terms and the ASINs that rank in the top 5 for those terms to build a conquesting ASIN list anchored to validated, high-intent search queries.

    The Five Most Common SBV Product Targeting Mistakes

    Even well-intentioned advertisers consistently make the same structural errors in SBV product targeting. Recognizing these patterns is often faster than building a new strategy from scratch.

    Mistake 1: One Campaign for All Three Archetypes

    Combining defensive, conquesting, and cross-sell targets in a single campaign makes it impossible to set appropriate bids, measure against the right success metrics, or optimize creative relevance. The campaign performance looks mediocre in aggregate because you’re blending three fundamentally different audience types. The fix: segment into three separate campaigns from the start, even if the initial budgets are small.

    Mistake 2: Applying ACOS Targets That Were Built for Keywords

    Your keyword SBV campaigns are measured against an ACOS target calibrated to search intent conversion rates. Applying that same target to conquesting product targeting campaigns will cause you to pause campaigns that are actually acquiring valuable new customers at a healthy long-term cost. Build separate ACOS benchmarks for each archetype, or shift primary measurement to NTB metrics for conquesting specifically.

    Mistake 3: Static ASIN Lists That Never Get Updated

    Amazon’s competitive landscape shifts continuously. Products get stocked out, prices change, review profiles evolve, new competitors enter the category. A conquesting ASIN list built once and left untouched for six months is likely targeting some ASINs that no longer exist, some that have materially changed, and missing new vulnerabilities that opened up since the list was built. Monthly ASIN list maintenance is not optional — it’s core to making product targeting work at scale.

    Mistake 4: No Segmentation Within Category Targets

    Running a top-level category target with no refinements is essentially broadcasting your ad to every ASIN in the category, regardless of price, rating, or relevance. Amazon’s category targeting refinements — minimum/maximum price, minimum star rating, Prime eligibility — are meaningful filters that should always be applied to narrow category campaigns toward your actual competitive set. An unrefined category target can inflate impression counts while delivering poor efficiency.

    Mistake 5: Using Search-Optimized Creative for PDP Placements

    As covered in the creative section, the video that works in keyword search environments is not the same video that works on a competitor’s product detail page. Running a single creative across both environments means both are underoptimized. Even a simple adjustment — adding product-name text overlay in the first frame and swapping the hook from an awareness message to a comparison message — can meaningfully lift CTR in PDP placements without rebuilding the creative from scratch.

    Building the SBV Product Targeting Engine: A Structural Checklist

    The most effective SBV product targeting programs share a common structural foundation. Here’s the checklist that advanced practitioners use as a baseline before scaling spend:

    Campaign Architecture

    • Separate campaigns for defensive, conquesting, and cross-sell objectives — never mixed
    • ASIN targeting and category targeting in separate campaigns, not mixed in the same ad group
    • Budget allocation weighted toward the archetype with strongest validated performance, not based on assumption
    • Negative ASIN list active from launch, not added as an afterthought

    Targeting Hygiene

    • Conquesting ASIN list sourced from SP Search Term Report, Brand Analytics competitor data, and category ranking overlap
    • Conquesting ASIN list filtered by price parity, rating vulnerability, and category relevance
    • Category refinements applied: minimum rating 4.0+, price band aligned to your competitive tier, Prime eligible
    • Monthly ASIN list review cadence scheduled in advance
    • Negative ASIN list reviewed monthly and updated based on 30-day performance data

    Bid Structure

    • Placement report reviewed after 3–4 weeks of data to understand PDP vs. search performance split
    • Placement modifiers set based on actual conversion rate data, not default assumptions
    • Separate bid tiers for defensive (higher), conquesting (mid-range), and category discovery (lower)

    Measurement Framework

    • NTB order rate tracked as primary KPI for all conquesting campaigns
    • ACOS used as a secondary efficiency guardrail, not the primary go/no-go metric
    • AMC overlap analysis run quarterly to identify cross-format audience duplication
    • Defensive campaigns evaluated by conversion rate protection and observable PDP exit rate signals

    Creative

    • Separate creative variants for PDP placements and search placements where budget allows
    • First 3 seconds: product visible, text overlay present, no silent ambient opener
    • Captions or text overlays that communicate the message fully without audio
    • Creative reviewed and refreshed every 60–90 days to prevent engagement fatigue in high-frequency placements

    Conclusion: Product Targeting Is Where SBV Actually Gets Interesting

    Sponsored Brands Video is frequently discussed as a creative format — a way to stand out in search with motion and sound. That framing is accurate but incomplete. The format’s highest structural potential isn’t in keyword targeting at all. It’s in the product targeting layer, where intent signals are sharper, competitive displacement is direct, and the measurement story can actually reflect the full value of customer acquisition rather than just click-through efficiency.

    The brands that will pull ahead in SBV product targeting over the next 12–18 months aren’t the ones with the biggest video production budgets. They’re the ones that build the architectural discipline first: three campaign archetypes with distinct objectives, ASIN lists that are actively curated, bids calibrated to placement behavior, and measurement frameworks that look at NTB rate and long-term customer value rather than last-click ACOS.

    Most of your competitors are running SBV on keywords. Fewer are running it on products. Almost none have built the full architecture described here. That gap is opportunity — but it’s narrowing as more sophisticated advertisers migrate their budgets toward product targeting inventory in 2026.

    The structural playbook exists. The data infrastructure to execute it is available to most Seller Central accounts. What’s missing, for most, is the deliberate decision to treat product targeting as a first-class citizen of the SBV strategy rather than a secondary checkbox on the campaign setup screen.

    Start with one archetype — defensive is usually the lowest-risk entry point — build the measurement framework before you scale, and let data drive your ASIN list evolution from there. The architecture described above scales cleanly from a few hundred dollars a month to six-figure monthly budgets. The structural decisions made early determine how cleanly it scales later.