Every Amazon advertiser running Sponsored Brands Video eventually hits the same moment: performance is softening, something feels off, but nobody can say with confidence whether the creative is tired, the keywords have shifted, or the bids need adjusting. So nothing changes. The same video keeps running. And the numbers keep drifting.
This is the creative refresh problem — and it is far more costly than most sellers realize. The issue is not that teams don’t know how to refresh an SBV. It’s that they don’t have a reliable system for knowing when to do it, what to change, or how many variants to keep in rotation at once. Most guidance on the subject either offers a vague “refresh every few months” rule or a blanket “always be testing” platitude that doesn’t translate into actual production schedules or campaign structures.
Q3 makes this harder. It is the most operationally fragmented quarter of the Amazon advertising calendar — split between Prime Day pressure, a mid-summer lull, and a back-to-school surge that arrives before most brands have recovered their Q2 budgets. Each of those phases has a different audience mindset, a different competitive landscape, and a different job for your video creative to do. Running the same SBV across all three is not a neutral decision. It is an active performance drag.
This post is about building a repeatable creative refresh system specifically tuned for Q3 2026 conditions. It covers the performance signals that tell you a creative has peaked, the production model that makes refreshing affordable, the seasonal calendar that tells you which kind of creative each phase requires, and the hook-testing architecture that turns every refresh into a learning cycle rather than a one-off replacement.
The goal is a system you can run on repeat — not just a Q3 tactic, but a quarterly operating rhythm that compound-improves over time.
Why Q3 Accelerates Creative Decay Faster Than Any Other Quarter
Creative fatigue is a year-round problem, but Q3 compresses it in ways that other quarters do not. Three structural forces converge between July and September that make the decay curve significantly steeper than what you see in Q1 or Q4.
Auction Pressure and CPM Spikes Change the Exposure Equation
When CPMs spike around Prime Day — and they do, sharply — your SBV impression volume often contracts even if your budget holds steady. That means the same creative is being served to a narrower, more saturated slice of your audience. The effective frequency per user goes up even when total impressions go down. Fatigue sets in faster, and the CTR decay signals arrive earlier than your calendar would suggest.
This is counterintuitive. Most teams treat Prime Day as a period of high reach. In practice, for mid-tier and smaller budgets, it is a period of high repetition — because the most cost-efficient impression pockets fill up quickly, and your creative ends up cycling through the same high-intent audience segments repeatedly. A creative that might normally last 75 days on a stable CPM environment can show meaningful decay in 45 days during a high-competition event window.
Audience Mindset Shifts Three Times in One Quarter
Q3 is not one season — it is three. In June and early July, shoppers are in deal-hunting mode, actively evaluating products with intent to buy at a discount. By late July and August, that urgency evaporates. Browsing becomes more casual, comparison shopping stretches out, and conversion rates across most categories soften. Then, from mid-August into September, back-to-school purchasing kicks in with a different kind of intent: category-led, often gift or household driven, and much more use-case specific.
A video creative written for a deal-hunting mindset performs differently when that audience is in casual browsing mode. The urgency cues that worked in July feel false in August. The problem-solution hook that resonated during the lull may feel too soft once back-to-school urgency picks up again. Creative that isn’t refreshed to match these shifting mindsets does not just underperform — it actively creates dissonance between what the shopper expects and what the ad delivers.
Competitive Creative Volume Is at Its Peak
Q3 is when most mid-to-large brands run their biggest creative investments ahead of Q4. That means the competitive SBV landscape in your category is at its densest between July and September. Your shopper is seeing more video ads, more polished creative, and more variation from competitors — which raises the effective “freshness bar” that your own creative has to clear to generate a click.
In categories with multiple strong SBV competitors, a creative that launched in early July can feel genuinely stale by mid-August, not because of absolute time elapsed, but because the category’s creative environment has moved around it. Refresh cadence in Q3 has to account for competitive context, not just your own campaign performance data in isolation.
The Performance Signal Stack: Knowing Exactly When Creative Has Fatigued
The single biggest mistake in SBV creative management is waiting for a dramatic performance collapse before acting. By the time CTR has fallen 30% below baseline and CVR has softened alongside it, the creative has already burned through weeks of deteriorating performance. The goal is to catch the signal early — at the first consistent deviation from baseline — and respond before the full decay curve plays out.
There are four metrics worth monitoring as a stack, in this order of priority:
1. CTR Versus Your Own Campaign Baseline
Generic CTR benchmarks for SBV cluster around 0.89%–1.0% across categories, but your baseline is what matters. If your campaign launched at 1.1% CTR and is now running at 0.91%, that is an 18% decline from your own starting point — a meaningful signal regardless of where it sits relative to category averages.
The trigger threshold practitioners consistently cite is a sustained 10–15% week-over-week decline relative to your own campaign’s recent average (not a single-week dip, which could be noise). A 15% or greater consistent decline is broadly treated as a high-confidence fatigue signal that warrants a creative review, if not an immediate refresh.
2. Impression-to-Click Divergence
When impressions stay flat or grow while clicks fall, you are almost certainly looking at creative fatigue rather than a targeting or bid problem. If impressions were falling alongside clicks, the culprit could be auction dynamics, budget changes, or keyword relevance shifts. But stable or rising impressions with declining clicks is the clearest possible signal that people are seeing your ad and scrolling past it — which is a creative problem, not a campaign structure problem.
Set up a simple weekly export in your Amazon Ads console that tracks impressions and clicks as a ratio. Watch the trend line, not just individual data points.
3. CVR Holding While CTR Falls
This is a nuanced but important signal. If CTR is declining but conversion rate on the clicks that do happen is holding steady or even improving, the creative may not be fatigued in the traditional sense. It may be self-selecting for a more qualified subset of clickers. That is a different problem — typically a relevance mismatch where your video is attracting slightly fewer but more intent-rich viewers.
In that scenario, an aggressive creative refresh may not be the right first move. Instead, review keyword targeting to see whether the audience pool has drifted, or test a broader hook before replacing the entire creative. Full replacement is warranted when both CTR and CVR are declining together — that combination signals that the creative is failing to attract qualified attention, not just broad attention.
4. New-to-Brand (NTB) Rate Trend
Sponsored Brands Video is fundamentally a top-funnel and mid-funnel tool. Its primary job is to bring new customers into a brand’s ecosystem, and NTB rate is the metric that shows whether it’s doing that work. If NTB purchase rate is declining over your campaign’s lifetime, the creative is likely reaching the same repeat buyers it was reaching last month — which suggests audience saturation and is a refresh signal, even if CTR and CVR look acceptable on the surface.
NTB rate declining by more than 10 percentage points from campaign launch is worth flagging for review. It is a leading indicator that the creative’s reach is narrowing even if other numbers haven’t moved dramatically yet.
The 45-75-90 Framework: Three Decay Thresholds That Actually Matter
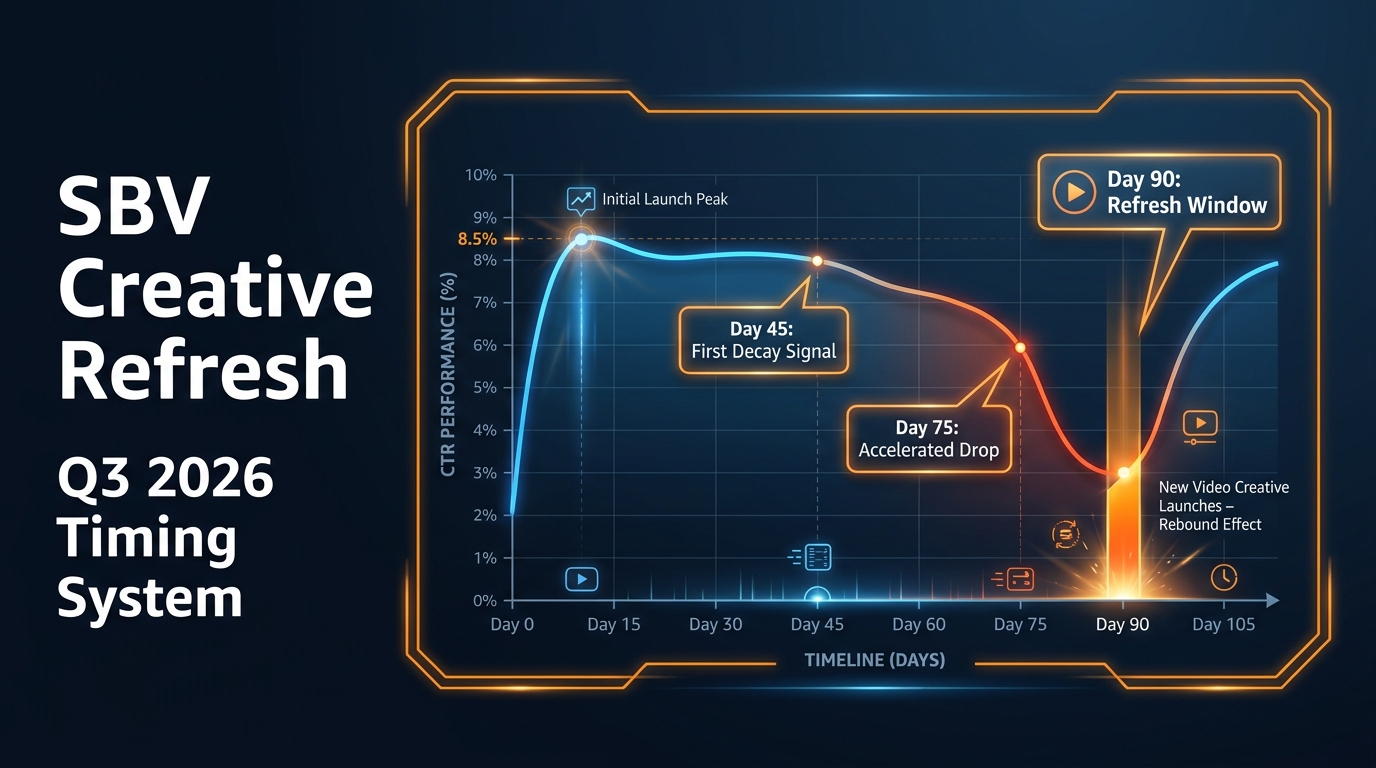
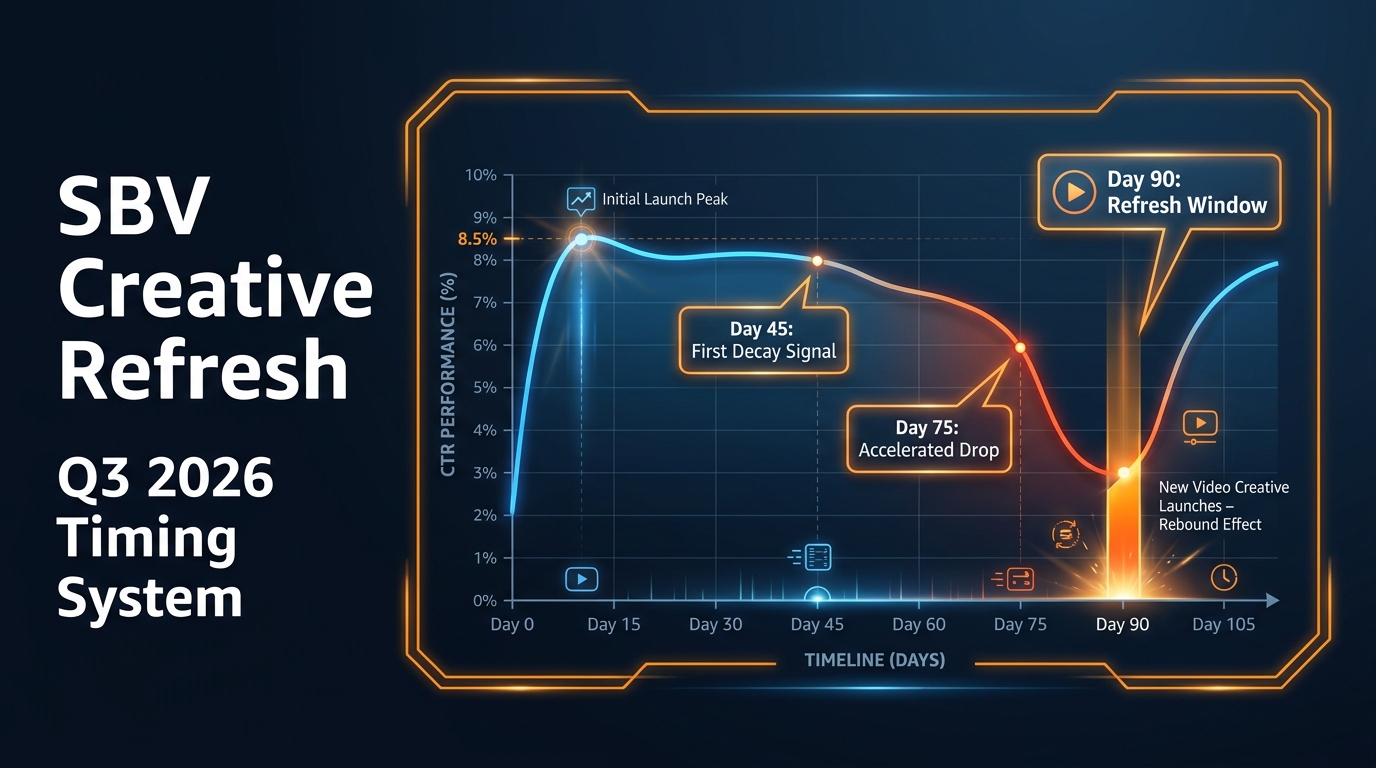
The practitioner consensus on SBV creative lifespan has converged on a set of three specific thresholds that function as decision points, not just calendar milestones. Understanding what happens at each threshold — and what action it calls for — is more useful than picking any single cadence rule and applying it uniformly.
Day 45: The First Review Gate
At 45 days of continuous serving, most SBV campaigns have accumulated enough impression volume to produce statistically meaningful performance data. This is not typically when creative is fatigued — it is when you should conduct your first structured review and ask whether early signals of decay are present.
At this point, compare your week-1 through week-3 average CTR against your most recent week. If the trend is flat or positive, the creative is holding. If there’s a consistent downward slope — even if the absolute numbers look acceptable — document it as a signal to watch. The Day 45 review is a check-in, not a replacement decision. For most hero-SKU campaigns, creative is still productive at Day 45. But this is when you should already have your next creative variant in production, so that you are not scrambling to replace a fatigued asset after it has already deteriorated.
Day 75: The Action Threshold
By Day 75, performance data shows a consistent pattern: CTR decay that started around Day 45 has had time to compound. If you saw a 10% CTR decline between days 30 and 45, you will typically see that same decline rate continue or accelerate through Day 60–75. The creative that launched strong is now reliably underperforming its own baseline.
Day 75 is when most practitioners trigger an active refresh. Not necessarily a complete creative overhaul — often a hook swap (the first 3 seconds) while keeping the remainder of the video intact is enough to reset performance without requiring a full re-shoot. The key action at this threshold is to pause the fatigued creative, launch the new variant in the same campaign structure (keeping bids, targets, and match types constant), and run the comparison over a 14-day validation window.
For high-traffic campaigns or competitive categories where impression velocity is high, Day 75 should be treated as a hard deadline rather than a guideline. The more impressions you are serving per day, the faster frequency builds and the more compressed the decay curve becomes.
Day 90: The Hard Reset Deadline
At 90 days, any SBV creative that has not already been refreshed should be considered overdue. Data shows that performance decay past Day 75 does not typically stabilize — it accelerates. The curve steepens between Day 75 and Day 90 because audience saturation compounds: the people most likely to click have already clicked (or decided not to), and the remaining impression pool is less qualified.
Waiting past 90 days without a refresh is a measurable cost. The performance drag during an extended fatigue period is not just lower CTR — it tends to pull bids down (because relevance score factors are affected by engagement signals), which means you may also lose placement competitiveness that you will need to rebuild when the new creative launches.
There is one legitimate exception to the 90-day deadline: broad evergreen campaigns targeting top-of-funnel awareness keywords with very low frequency per user. In those campaigns — typically category-level keyword targeting in low-CPM environments — creative refresh cycles of 120 days are defensible because individual audience members see the ad far less often. But for any campaign running on branded, competitor, or high-intent transactional keywords, 90 days is the outer limit.
The Q3 Creative Calendar: Mapping Refresh Windows to the Season’s Three Acts
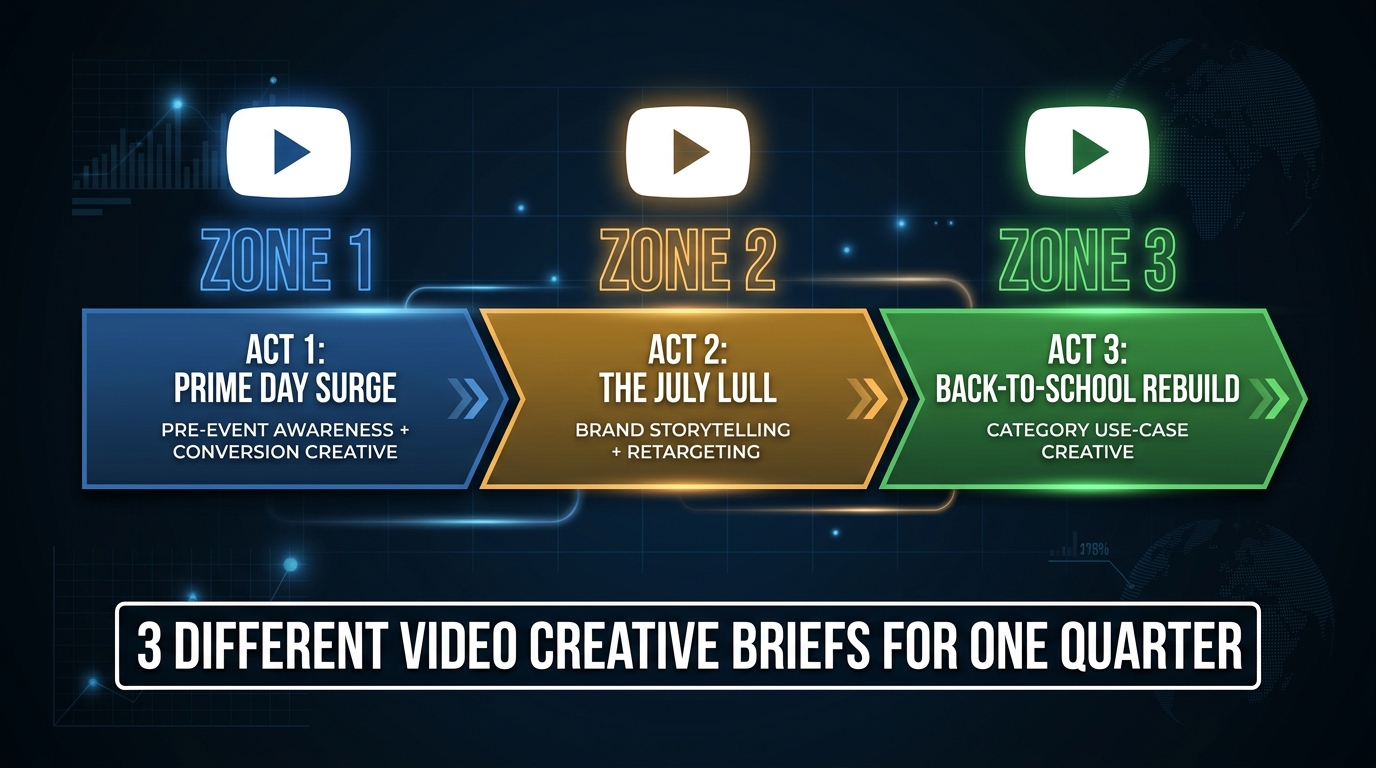
Applying the 45-75-90 framework mechanically across Q3 misses the seasonal dimension. Q3 2026 is not a uniform block of time — it has three distinct phases, each requiring a different creative job-to-be-done. A well-structured Q3 creative calendar aligns refresh timing with these phase transitions rather than treating them as independent events.
Act 1: The Prime Day Window (Late June Through Early July)
With Amazon moving Prime Day into late June in 2026, the traditional “Q3 starts with Prime Day” logic has shifted slightly — the event pulls peak demand pressure into Q2’s final weeks, but its reverberations carry through early July. For SBV creative, the Prime Day window calls for conversion-focused video: short (15 seconds or less), product-dominant, deal-led where applicable, and structured around urgency-compatible messaging.
This creative should already be live two to three weeks before the event, warming the audience before auction pressure peaks. Plan for this creative to enter its Day 45 review window in mid-to-late July — meaning if it launched in early-to-mid June, you should be assessing it for decay signals by late July, exactly when Act 2 begins. That timing alignment is not accidental: it creates a natural handoff between your Prime Day creative and your lull-period variant.
Act 2: The July Lull (Mid-July Through Mid-August)
After Prime Day excitement fades, Amazon advertising enters one of the year’s softer demand windows. CPMs often ease, competition thins slightly, and shoppers shift from transactional intent toward more exploratory browsing. This phase is genuinely underused by most advertisers, and it presents one of Q3’s best opportunities.
The right SBV for Act 2 is not a conversion-first spot — it is a brand narrative or product education creative. Show the product in use. Demonstrate the problem it solves with more context than a quick cut. Build consideration rather than driving immediate purchase. This creative can be slightly longer (up to 20–25 seconds, though Amazon’s recommended maximum remains 20 seconds), because the shopping session in this window is more patient and browsing-oriented.
This is also the phase to use SBV for retargeting-adjacent messaging — creative that speaks to people who have already seen your brand but haven’t converted, using social proof angles, comparison framing, or use-case specificity that wasn’t possible in a tight 12-second Prime Day spot.
Act 3: The Back-to-School Build (Mid-August Through September)
As back-to-school demand ramps up, the creative brief changes again. This phase is category-specific and use-case driven. Shoppers are buying with a purpose — equipping a student, setting up a dorm, restocking household essentials. Your SBV needs to speak to that context explicitly.
The Act 3 creative should be ready to launch by the second week of August at the latest, because by then you will be approaching the Day 45 review window on your Act 2 creative (assuming it launched in mid-July). The transition between Act 2 and Act 3 creative is one of the highest-leverage creative refresh decisions of the quarter — if you miss it, you are running consideration-stage creative into a conversion-stage audience.
Modular Production: How to Make One Shoot Pay for Four Creatives
The most common reason brands don’t refresh SBV creative on a 60–90 day cycle is production cost. Traditional video production — agency briefing, shoot day, post-production, approval cycles — can run $5,000 to $25,000 per finished asset. At that cost structure, refreshing creative three or four times in a single quarter is not economically feasible for most sellers.
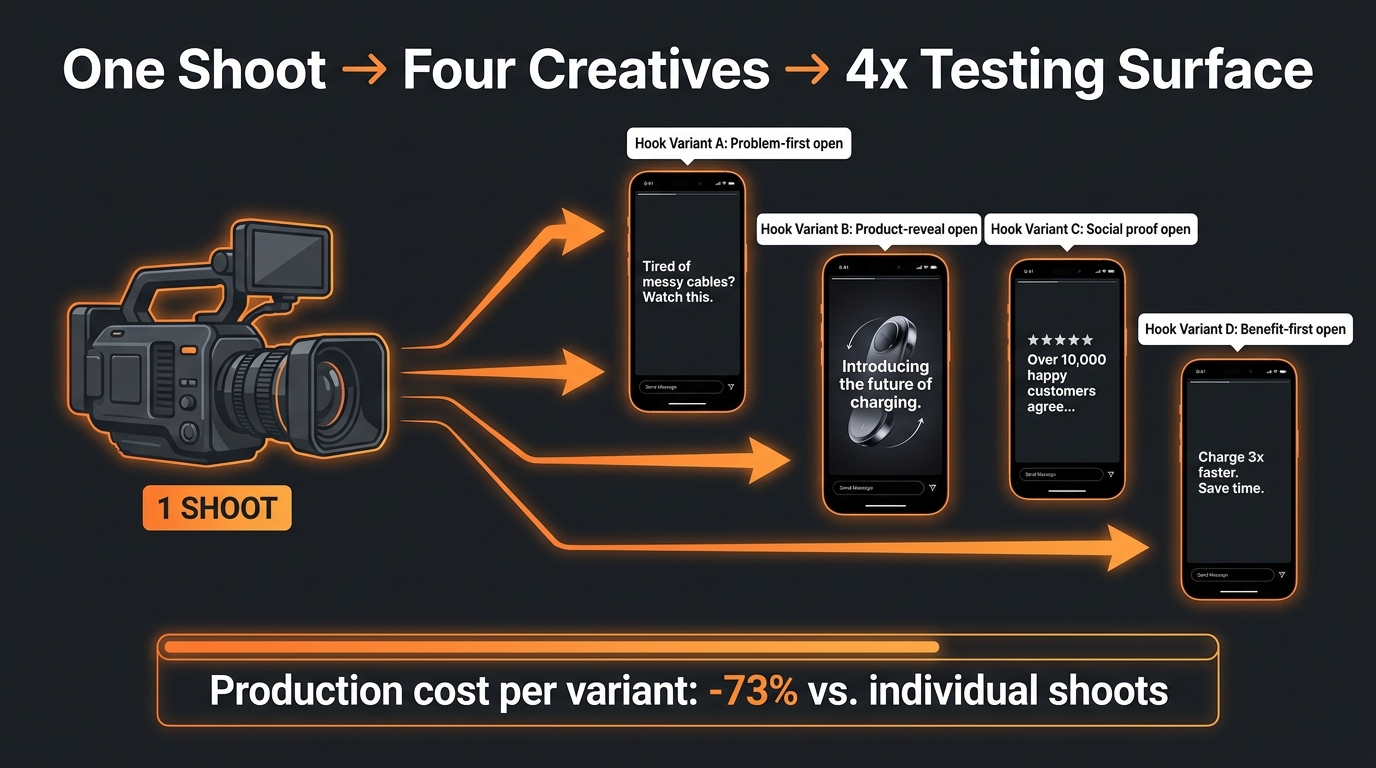
Modular production solves this problem by disaggregating the production investment from the number of creative outputs. The core principle: shoot once for a master asset library, then edit multiple variants at minimal incremental cost.
The Master Shoot Philosophy
A well-planned SBV shoot should capture three to four times more raw footage than you need for any single creative. That means shooting multiple hook sequences (different openers using the same product), multiple demonstration angles, multiple use-case scenarios, and multiple end-card treatments — all in one production day.
The incremental cost of capturing three additional 5-second hook variants on the same shoot day is close to zero — some additional setup time, a slightly longer call sheet, and a bit more post-production editing. But those three extra hook sequences become the raw material for four distinct SBV creatives rather than one. The per-creative production cost drops dramatically, and you have a refresh-ready asset library before your first creative even launches.
The Four-Variant Architecture
A practical modular system produces four variants from one shoot:
- Variant A — Problem-first hook: Opens with a visual representation of the problem your product solves. The product appears as the solution in seconds 3–5. Works especially well for awareness-stage targeting on broad keywords.
- Variant B — Product-reveal hook: Product is on screen immediately, with a bold benefit text overlay in the first two seconds. Designed for high-intent keywords where the shopper already knows the category and needs to be quickly shown why your product is the right choice.
- Variant C — Social proof hook: Opens with a proof signal — a number (rating count, units sold, years in market), a customer outcome, or a comparative claim — before the product appears. Effective when your product has genuine credibility signals that competitors lack.
- Variant D — Benefit-first hook: Leads with the outcome or use case (“Finally, a [product] that [specific benefit]”) before showing the product in action. Useful for mid-funnel retargeting and for categories where benefit differentiation is the primary purchase driver.
These four variants share the same body content (demonstration, key features, end card) and differ only in their first 3–5 seconds. That shared body content means the edit time for variants B, C, and D after variant A is complete is a fraction of the original production cost — typically one to two hours of editor time per variant, not a full production cycle.
Evergreen Body Content
The section of your SBV between the hook and the end card — typically seconds 5 through 15 — should be designed as evergreen content that stays valid across seasonal phases. Product demonstration, key feature callouts, quality signals, and use-case visuals that don’t have a seasonal shelf life. This is the content that lets you refresh hooks while holding the body constant — you are not re-making the ad, you are re-opening it with different context.
End cards are the other swappable element: the final 2–3 seconds showing brand name, logo, and a CTA. Seasonal end cards (“Shop Prime Day Deals,” “Back to School Ready,” “Explore the Collection”) can be dropped in at the editing stage without touching the rest of the creative. This gives you seasonal relevance with minimal marginal cost.
What Actually Works in the First Three Seconds (And Why It Drives Everything Else)
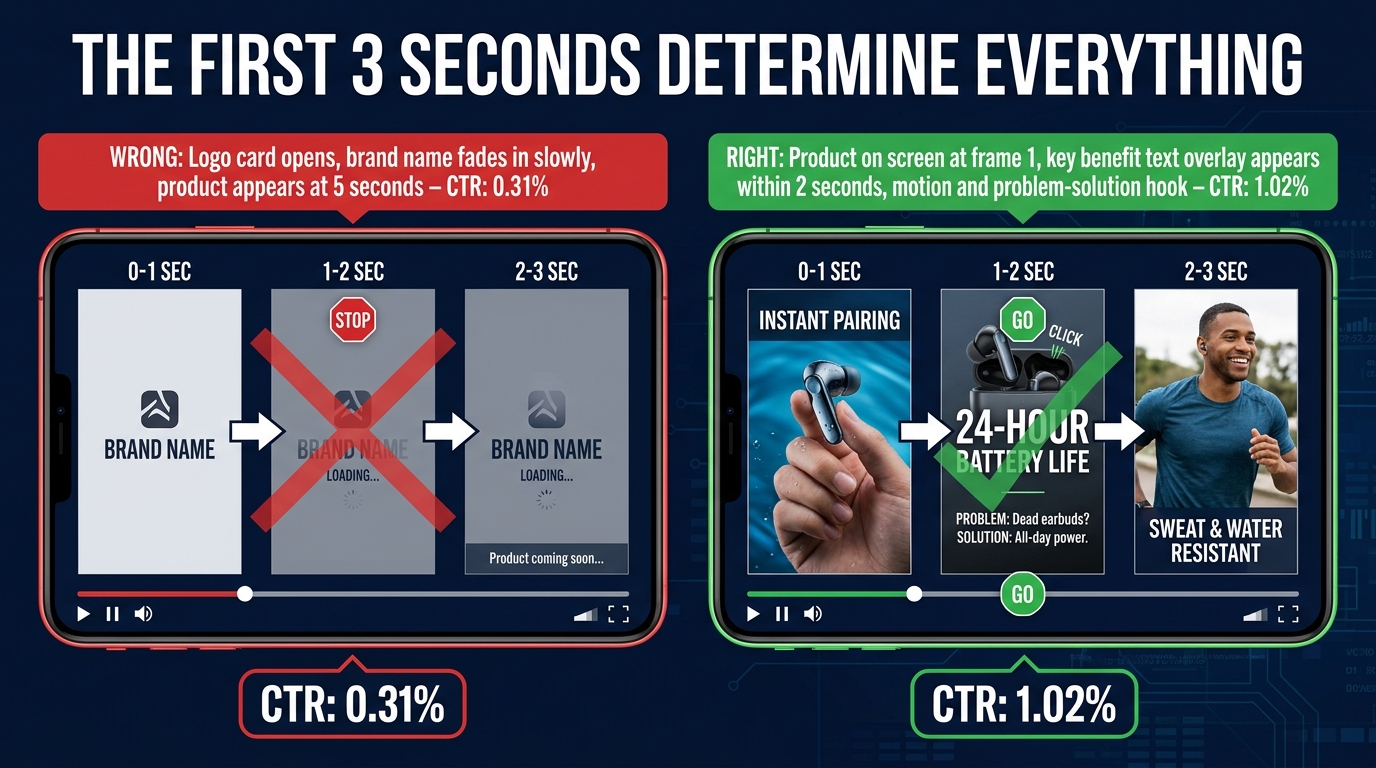
Amazon’s own creative guidance for Sponsored Brands Video is explicit on one point above all others: show the product in the first two seconds. Show its key benefit within the first five seconds. This is not a stylistic preference — it is a behavioral reality driven by how shoppers interact with autoplay video in a shopping environment.
SBV plays automatically in search results pages, without sound, while the shopper is actively scanning for products. They did not come to Amazon to watch a video. They came to find something to buy. Any creative opening that prioritizes brand identity, mood setting, or cinematic framing over product clarity is competing against the shopper’s attention rather than working with it.
The High-Cost Mistake: Logo-First Openings
The most common, most expensive first-three-seconds mistake in SBV is opening with a logo card — typically two to three seconds of the brand name fading in over a colored background or lifestyle shot, with the product appearing afterward. This structure is intuitive from a brand-marketing perspective (establish identity, then present the product) but it is behaviorally counterproductive in a shopping context.
The shopper is looking at the product, the price, the title, and the images in the search results around your ad. The moment your video starts playing, they have a fraction of a second to decide whether to look at it or keep scrolling. A logo card gives them no reason to look. There is nothing in those two seconds that connects to their purchase intent. The product — the thing they are actively searching for — is absent when their attention is highest.
Opening with the product, moving, in context, is the structural correction. It does not need to be dramatic. A clean overhead shot of the product being used, a quick cut from problem to solution, a close-up that reveals a specific feature — any of these work better than a logo fade because they immediately answer the question the shopper is implicitly asking: “Is this relevant to what I’m looking for?”
Motion Is the Attention Trigger
Because SBV is surrounded by static content — product images, titles, star ratings — motion itself is a differentiating signal. The eye naturally tracks movement in a field of still images. This means the quality of motion in your first frame matters: a slow, subtle pan is less effective than a deliberate, purposeful movement that communicates action or result.
High-performing SBV openers typically use one of three motion strategies: a pour or application (product being used in its primary function), a before-and-after transition (problem state to solved state in a fast cut), or a product reveal (movement that exposes the product from a hidden or partial starting position). All three create the expectation of something happening — which is exactly the cognitive hook needed to pause a scroll.
The Text Overlay Rule
Since most SBV plays without sound, the text overlay in the first three seconds carries the burden of delivering your verbal message. Best practice, validated by Amazon’s own guidance and practitioner testing, is to overlay a short benefit statement (five to eight words maximum) that reinforces what the visual is showing — not duplicates it, and not provides entirely different information.
If the visual shows a product being poured into a glass, the text might read “No flavor additives. Just pure hydration.” That reinforces the health benefit implied by the visual rather than saying “Our water bottle is great” or providing product specs that make the viewer read rather than watch. The text-visual alignment in the first three seconds is what makes the message land for a sound-off viewer in the same way it would with audio.
Sound-Off Architecture: Designing for How Shoppers Actually Watch
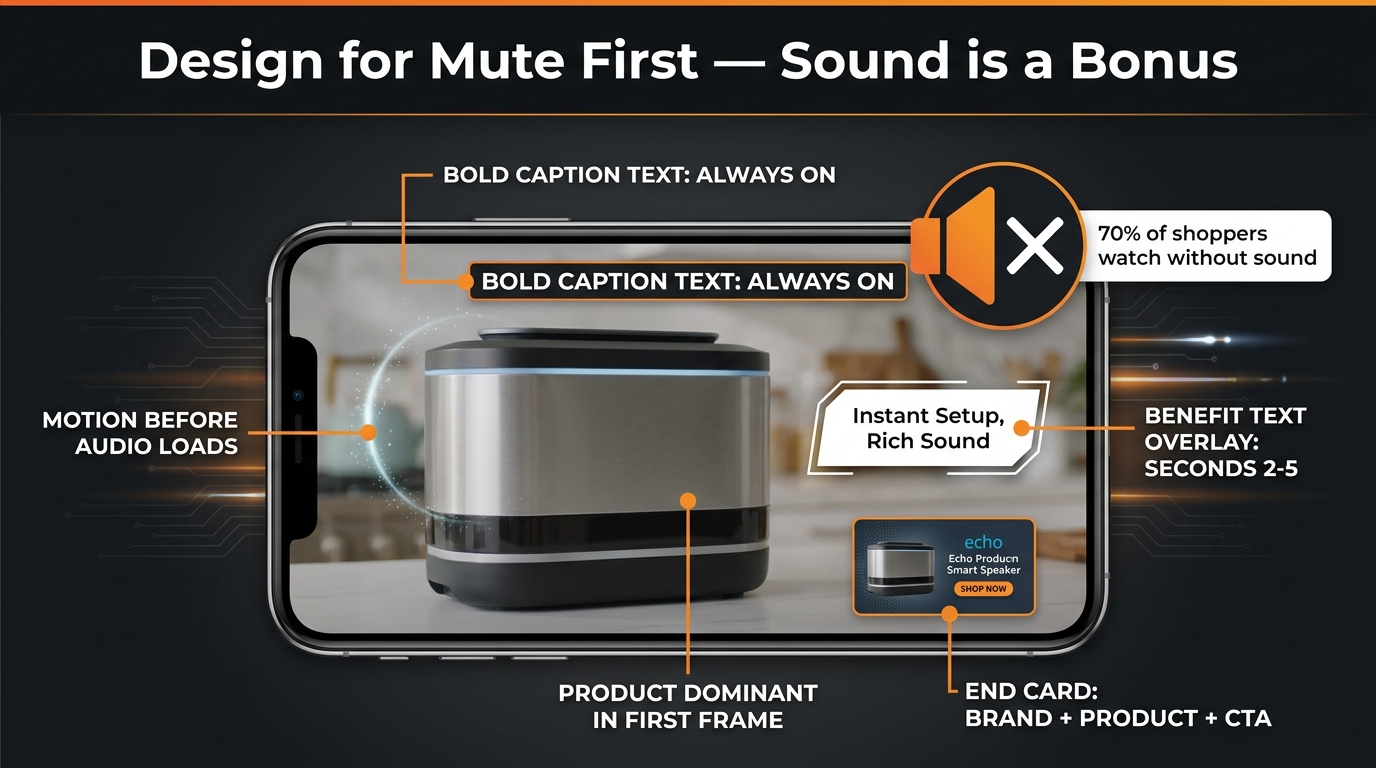
SBV autoplays on mute. This is not a limitation to work around — it is the fundamental design constraint that should govern every creative decision, from shot selection to pacing to text placement. A creative that works only with sound is not a sound creative strategy. It is a partial creative that delivers a fraction of its potential message to the majority of its audience.
The practical implication is that your SBV needs to tell its complete story visually, with text support, before audio ever enters the equation. Sound is an enhancement for the minority of viewers who tap to unmute — it is not the primary channel of communication.
Caption Placement and Duration
Captions should appear throughout the video, not just at the beginning. Every spoken claim that appears in the audio track should have a corresponding text element on screen at the same time. This is not traditional captioning (small text at the bottom of frame) — it is bold, designed, on-brand text treatment that integrates with the visual composition rather than sitting below it.
Common sizing mistakes: too small to read on mobile at a glance, or placed in the lower third where it competes with Amazon’s own interface text below the video player. Text should be large enough to read without the viewer moving their phone closer, and positioned in the upper two-thirds of the frame where it’s clear of platform UI elements.
Pacing for No-Sound Viewing
Audio pacing in video production is often used to set the emotional rhythm — music builds tension, a voiceover provides connective tissue between scenes, sound effects create emphasis. Without audio, pacing has to be carried entirely by visual rhythm: cut frequency, motion speed, and text timing.
High-performing muted SBV creative tends to have faster cut pacing than traditional brand video — approximately one cut every two to three seconds rather than the four-to-six-second holds common in awareness advertising. This keeps the viewing experience active even without music driving momentum. But faster cuts only work if each cut advances the narrative: a new angle on the same product at the same moment adds nothing, while a cut from product-in-use to product-result-shown advances the story meaningfully.
The End Card as a Silent CTA
The final two to three seconds of your SBV — the end card — are the most neglected real estate in most brand video creative. Most end cards default to a logo lockup on a solid color background, which is a dead moment in a sound-off environment. Nobody is moved to click by seeing a logo they already saw mentioned twice in the body of the ad.
A more effective end card for sound-off viewers includes three elements: the product prominently visible (not just the brand logo), a clear action prompt in text (“Shop Now” or the specific product category), and ideally a proof element (star rating, “Amazon’s Choice” badge, key differentiator in text). This turns the end card from a branding placeholder into a mini product card — a final moment that gives the viewer a clear reason to click before the video loops.
Hook Testing as a Refresh Strategy: Running SBV Like a CRO Program
The most operationally efficient way to manage creative refresh is to treat every new SBV launch as a structured test rather than a replacement. This reframe changes both the production plan (you are always creating variants, not single creatives) and the measurement framework (every creative transition produces a learning, not just a reset).
The Single-Variable Test Structure
The cardinal rule of SBV hook testing is to change only one variable per test. This is the same principle that makes conversion rate optimization disciplined rather than intuitive: if you change the hook, the body content, the pacing, and the end card simultaneously, you cannot attribute the performance difference to any specific element. The test produces a winner but not a learning.
In practice, the most productive single variable to test in SBV is the hook — the first three to five seconds. This is where the highest-leverage performance differential exists, and it is the element that is easiest to isolate in a modular production system (since the body and end card can stay constant). Changing only the hook across two variants, running them in the same campaign against the same keywords at the same bids and budgets, gives you a clean read on which opening framing drives stronger CTR — and that learning informs your next production cycle.
Minimum Test Duration and Traffic Thresholds
SBV creative tests need enough traffic to reach statistical validity before drawing conclusions. A practical minimum is 1,000 impressions per variant — with 2,000+ preferred — before making a call on which creative to pause. In high-traffic campaigns on competitive keywords, this threshold can be reached in five to seven days. In lower-volume campaigns, it may take two to three weeks.
The implication for refresh scheduling: if you are planning a Day 75 refresh, you should launch your test variant at Day 60 — giving yourself a 15-day overlap window in which both creatives run, you gather the impressions needed for a valid comparison, and you identify the winner before the original creative deteriorates further. This keeps you ahead of the decay curve rather than reacting to it.
Building a Hook Learning Log
Every SBV test produces a data point about which opening framing resonates with your specific audience. Over time, those data points add up to a body of knowledge about your buyers: do they respond better to problem framing or benefit framing? Do they click on social proof faster than product reveals? Does a before-and-after opener outperform a feature highlight for your category?
This knowledge does not live in any Amazon console dashboard — it has to be deliberately tracked in a log. A simple spreadsheet that records the hook type, the test period, the CTR difference, and the campaign context is enough. Over four to six test cycles, patterns emerge that genuinely compress future production time — because you are not guessing at hook strategy anymore, you are executing based on accumulated evidence from your own audience.
The Real Cost of NOT Refreshing: Benchmarks and What They Mean
Most discussions about SBV creative refresh focus on how to do the refresh. Fewer quantify the business impact of not doing it — and that gap in framing is partly why refresh decisions get deprioritized in busy quarters like Q3.
Let’s look at what the numbers actually say about the cost of creative fatigue.
The Baseline Performance Gap
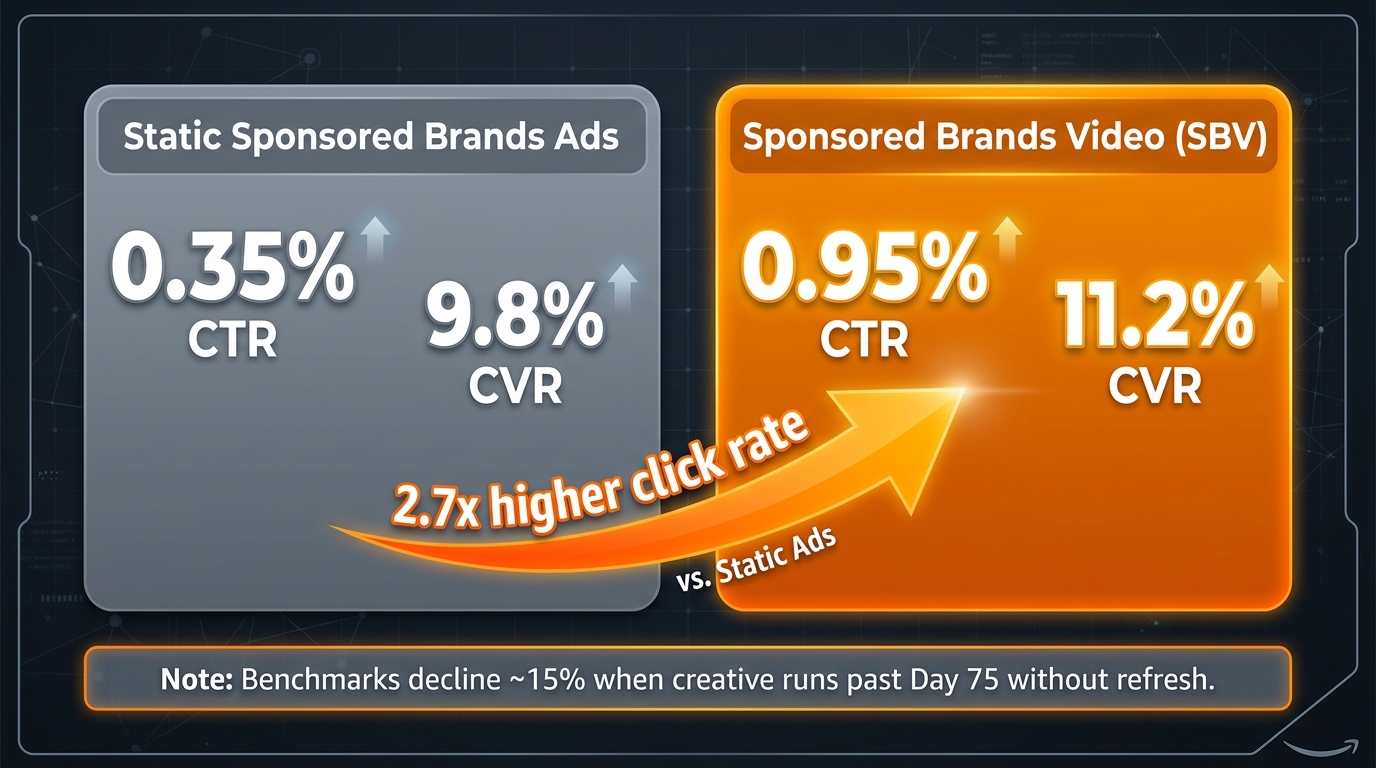
SBV outperforms static Sponsored Brands meaningfully. Current benchmark data puts SBV CTR at approximately 0.89%–1.0% versus roughly 0.35% for static Sponsored Brands image ads — a gap of approximately 2.6x to 2.9x. CVR benchmarks for SBV sit around 11.2%, compared to approximately 9.8% for static formats. These are not marginal differences; they represent a meaningful top-of-funnel and mid-funnel advantage that justifies SBV’s higher creative production cost.
But that advantage is contingent on creative freshness. A fatigued SBV that has been running for 90–120 days without refresh is not benchmarking at 0.95% CTR. It may be at 0.6% or lower — which narrows or eliminates the gap versus a fresh static Sponsored Brand. The premium format loses its premium performance, and the brand is spending on video production without capturing the corresponding benefit.
The Compound Cost Calculation
Consider a campaign spending $5,000 per month on SBV, launching at 1.0% CTR and 11% CVR. At Day 45, CTR begins declining. By Day 75, it is at 0.78% CTR — a 22% decline. By Day 90 (with no refresh), it is at 0.62% CTR — a 38% decline from launch.
On a $5,000 monthly budget, that 38% CTR decline translates to approximately 38% fewer clicks for the same spend — and if CVR has also softened by 10–15 percentage points (which is common when both CTR and CVR decay together), the combined impact on attributed purchases can be substantial. That is real revenue erosion that accrues silently while the campaign technically keeps running.
Against that cost, a modular hook swap — four to six hours of editor time, perhaps $500–$800 in production cost — represents a straightforward return. The math of a timely refresh almost always favors action over inaction.
The Placement Erosion Risk
Amazon’s ad auction factors in relevance signals, and sustained engagement decline can affect placement competitiveness over time. This is the least-discussed cost of creative fatigue: it is not just that your existing creative underperforms — it is that the performance drag may require higher bids to recover the same placement position once you do launch fresh creative. The refresh cost is not just production; it includes the recovery period needed to rebuild placement efficiency that deteriorated while the fatigued creative ran.
This reinforces the case for proactive refresh — ahead of the decay curve — over reactive replacement after performance has significantly declined. Catching fatigue at Day 45–60 and refreshing by Day 75 preserves placement momentum. Replacing at Day 105 after extended performance deterioration requires rebuilding it.
Building a Q3 SBV Operating Rhythm That Survives the Quarter
All of the frameworks above are only useful if they translate into an actual operational cadence — a schedule, with specific dates, tied to specific production milestones and campaign actions. Q3 is operationally busy, and without a locked schedule, creative refresh decisions get deferred until they’re urgent rather than executed while they’re strategic.
The Q3 Creative Production Schedule
A practical Q3 SBV operating rhythm looks like this:
- May / Early June: Shoot master asset library for the full quarter. Capture all hook variants, seasonal end cards, and body content in one production session. Brief should include Prime Day conversion hooks, lull-phase brand narrative hooks, and back-to-school use-case hooks.
- Early June: Edit and approve Act 1 (Prime Day) creative — product-first conversion variant. Launch two to three weeks before the Prime Day window. Set Day 45 review date in the calendar for mid-to-late July.
- Mid-July (Day 45 review): Conduct CTR baseline comparison. If decay is present, begin editing Act 2 (lull-phase) creative immediately. If performance is holding, extend review window but do not extend beyond Day 75.
- Late July (Day 60–75): Launch Act 2 creative (brand narrative / retargeting hook). Run overlapping test with Act 1 for 10–14 days to validate which variant wins. Pause underperformer.
- Early August: Set Day 45 review date for Act 2 creative (mid-September). Begin editing Act 3 (back-to-school) creative from existing asset library — swap in seasonal end card and use-case hook.
- Mid-August: Launch Act 3 creative. Run overlap test with Act 2 for validation. This creative carries you through September and into Q4 planning.
The One Rule That Holds the System Together
The refresh calendar only works if creative production is decoupled from campaign urgency. Brands that wait until a creative is visibly fatiguing before starting production will always be behind — because production takes time, and urgent production is expensive production. The modular system works because all the raw material is captured in advance, and “refreshing” becomes an editing task rather than a production task.
The operational rule is simple: when a new creative launches, the next creative variant should already be in editing. By the time the current creative reaches its Day 45 review, its replacement should be ready to deploy. This keeps the system running ahead of decay rather than reacting to it.
Conclusion: The Refresh Cadence Is the Strategy
Sponsored Brands Video is not just a format — it is a performance system. And like any performance system, it degrades without maintenance. The question is not whether your SBV creative will fatigue in Q3 2026. It will. The question is whether you have a structure in place to catch the decay early, replace creative efficiently, and use every refresh as a learning cycle rather than a reset.
The 45-75-90 framework gives you the decision thresholds. The Q3 seasonal calendar gives you the brief for each phase. Modular production gives you the economics that make quarterly refresh viable. Hook testing gives you the methodology that compounds your learnings over time. Sound-off architecture ensures your creative actually communicates with the audience you are paying to reach.
None of these elements are complicated in isolation. What makes them powerful is running them as a system — a repeatable operating rhythm that treats creative refresh as a scheduled operational event, not an emergency response.
Q3 2026 is a three-act season with three distinct audience mindsets, three different creative jobs to be done, and a compressed competitive environment that makes timely refresh more important than in any other quarter. The brands that build this system now — before the Prime Day window opens — will enter August with fresh creative, accumulated hook learnings, and a production library that carries them through September and into Q4 planning without scrambling.
The ones who don’t will be refreshing creatives in August under pressure, guessing at hooks, and spending Q4 budget recovering placements they could have held all along.
The refresh cadence is the strategy. Everything else is execution.
Key Takeaways for Q3 2026 SBV Creative Refresh
- Treat Day 45 as your review gate, Day 75 as your action threshold, and Day 90 as your hard deadline — never let a hero SBV run past 90 days without assessment.
- Monitor the impression-to-click divergence metric weekly: rising impressions with falling clicks is the clearest creative fatigue signal available.
- Plan three distinct creative briefs for Q3’s three phases — Prime Day conversion, lull-phase brand narrative, and back-to-school use-case — not one creative stretched across the quarter.
- Shoot all Q3 creative in one May/June production session using a modular master-library approach. Refreshing should be an editing task, not a production task.
- Always open with the product on screen in the first two seconds. Never lead with a logo card in a shopping context.
- Design every SBV for sound-off viewing first. Text overlays, purposeful motion, and an end card with visible product are non-negotiable for a muted autoplay environment.
- Test one hook variable at a time. Build a hook learning log that compounds your audience knowledge across every refresh cycle.