Tag: AI Automation

  • Why Most Self-Healing Automations Heal the Wrong Thing (And How to Design Ones That Don’t)

    Why Most Self-Healing Automations Heal the Wrong Thing (And How to Design Ones That Don’t)

    Self-healing AI automation feedback loop diagram showing the OBSERVE, DIAGNOSE, DECIDE, ACT, LEARN cycle

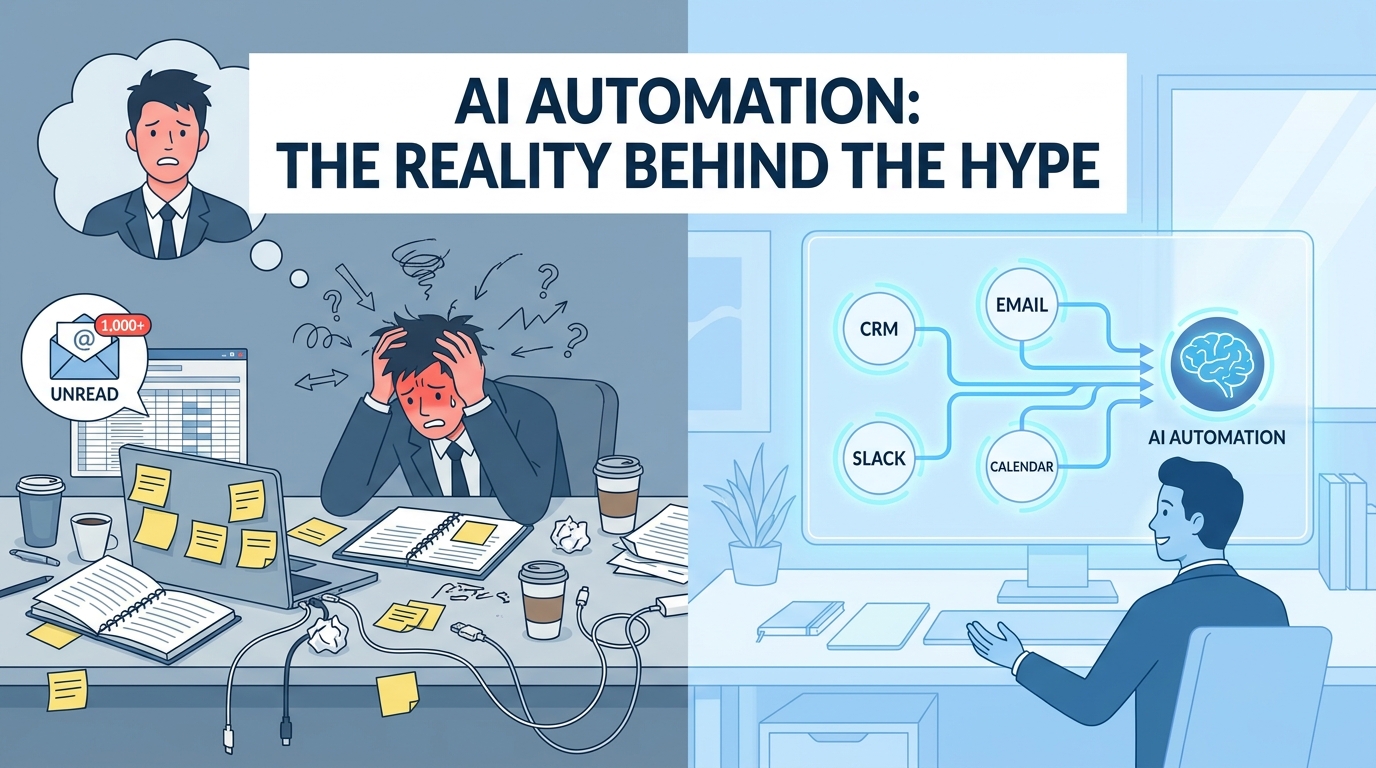
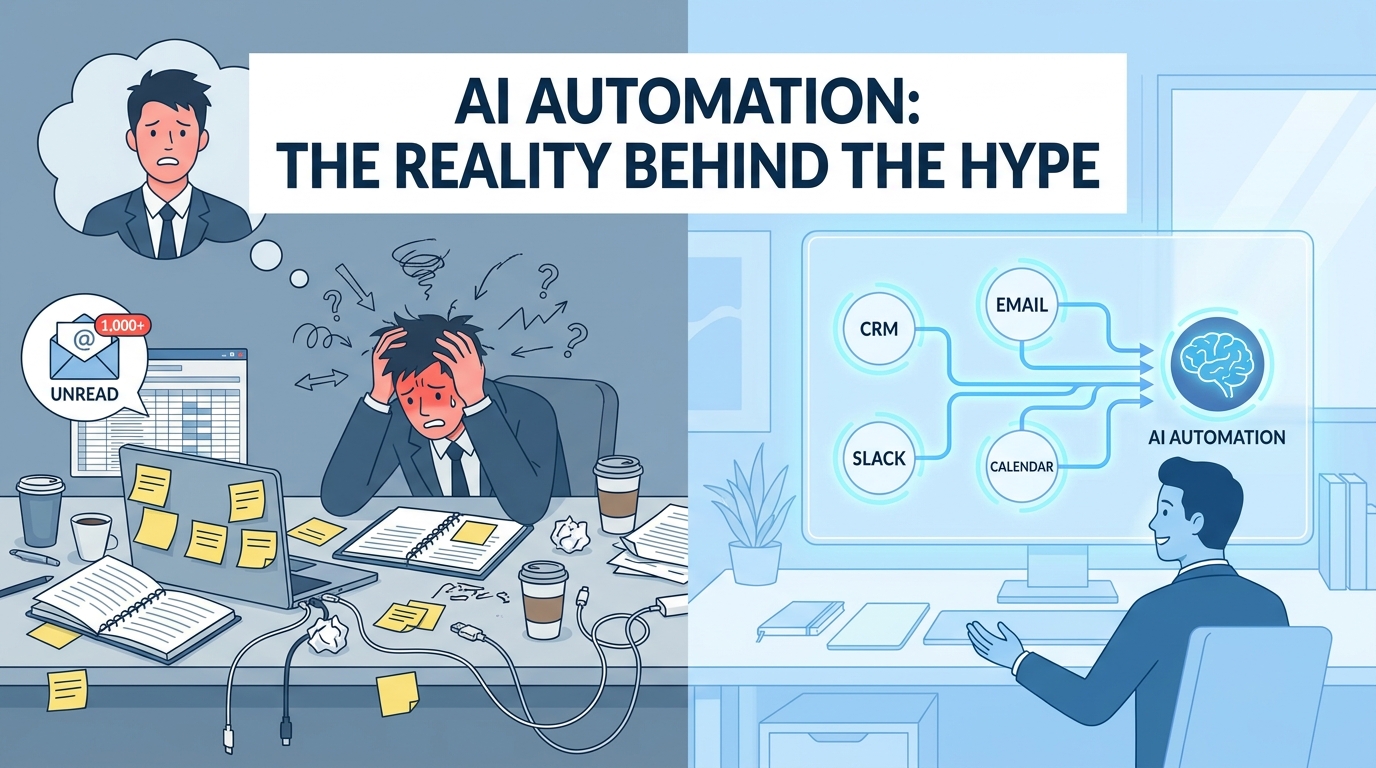
    The pitch is compelling enough that almost everyone buys it the first time: build AI automation that can detect its own failures and fix them — without a human in the loop. You deploy it. Something breaks. The system, as advertised, “heals” itself. Your dashboard stays green. Everybody relaxes.

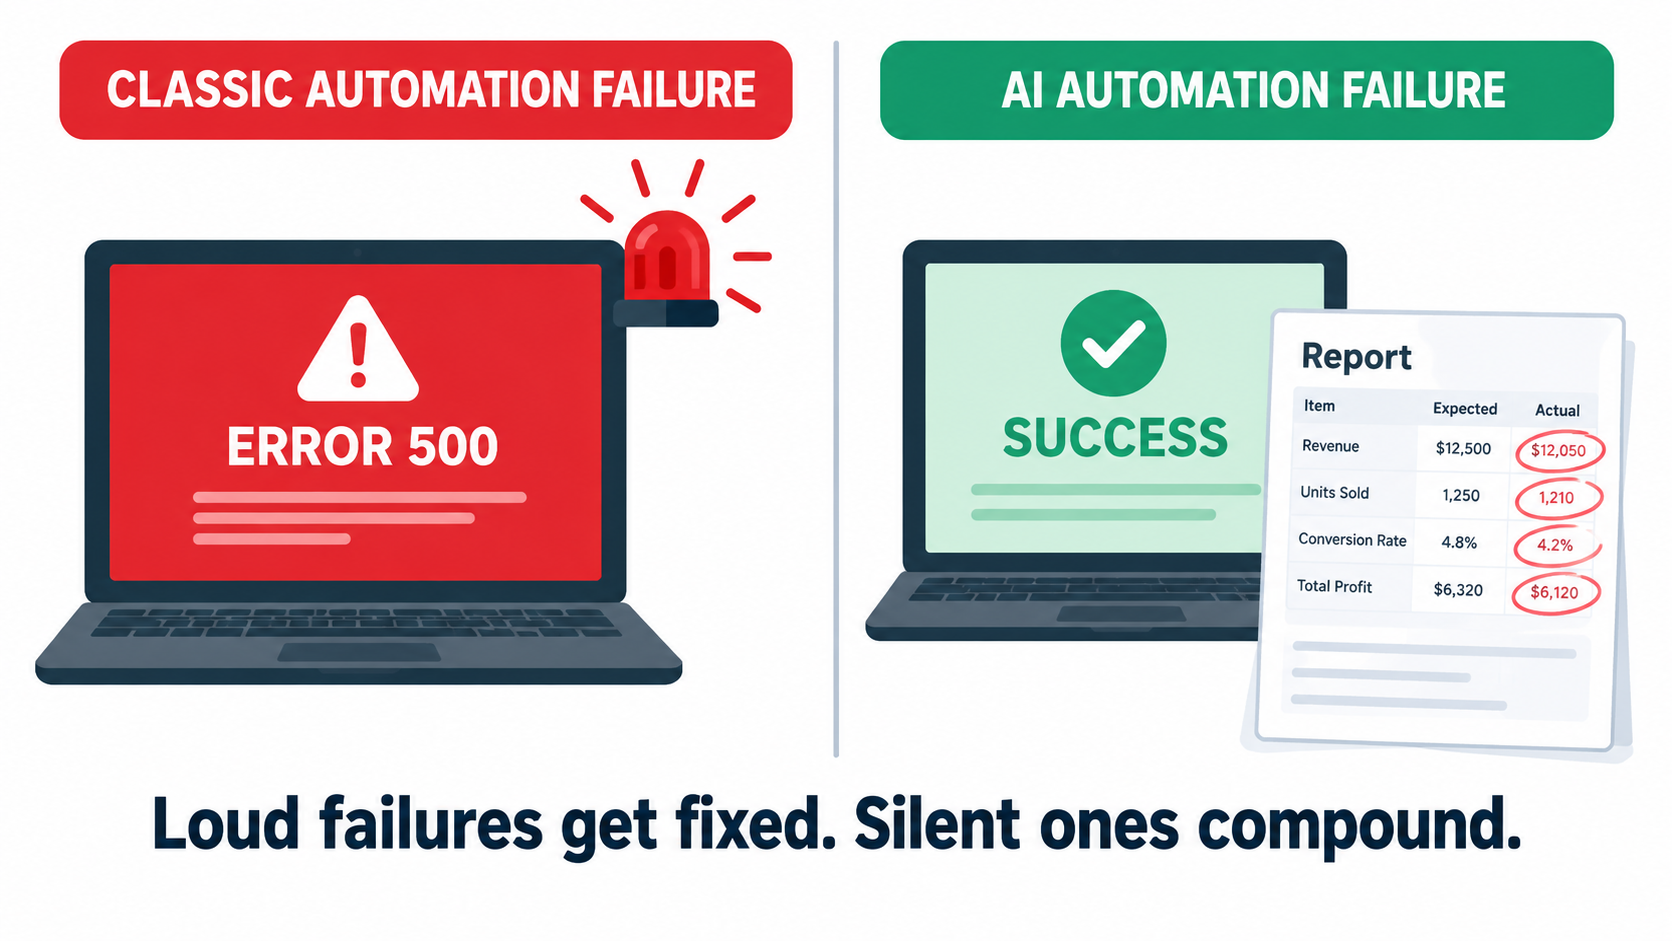
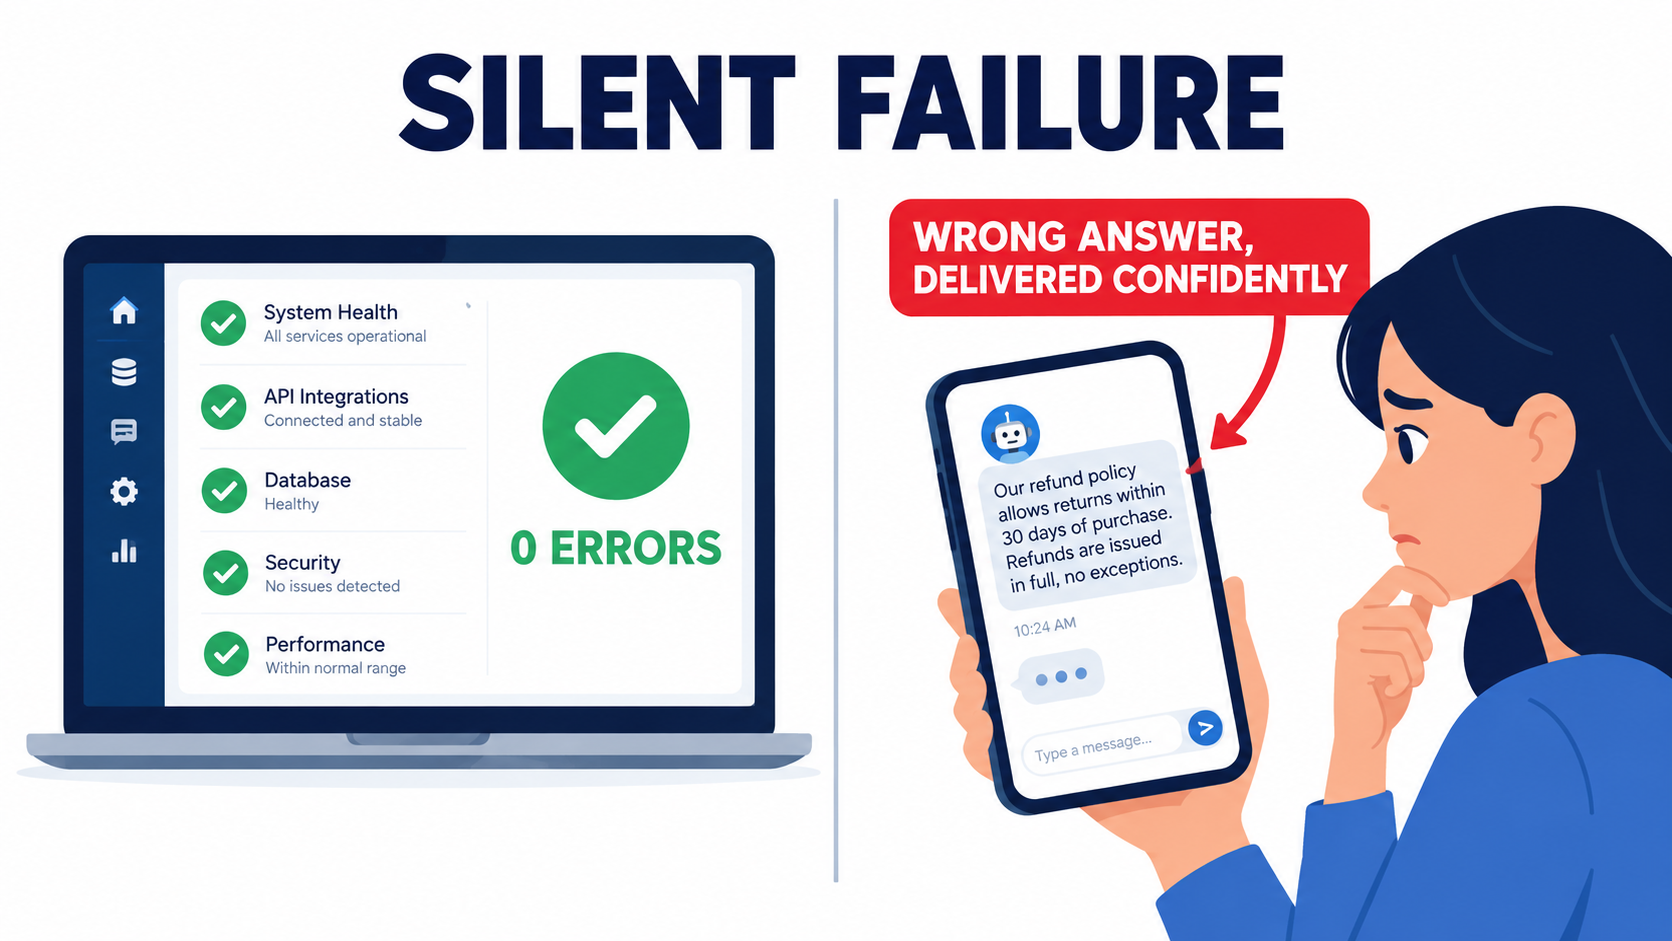
    Then, six weeks later, you discover that the automation has been quietly re-routing a class of transactions to a fallback path, and those transactions haven’t actually been completing. They’ve been disappearing. The system healed itself so efficiently that nobody noticed the underlying process was failing thousands of times a day.

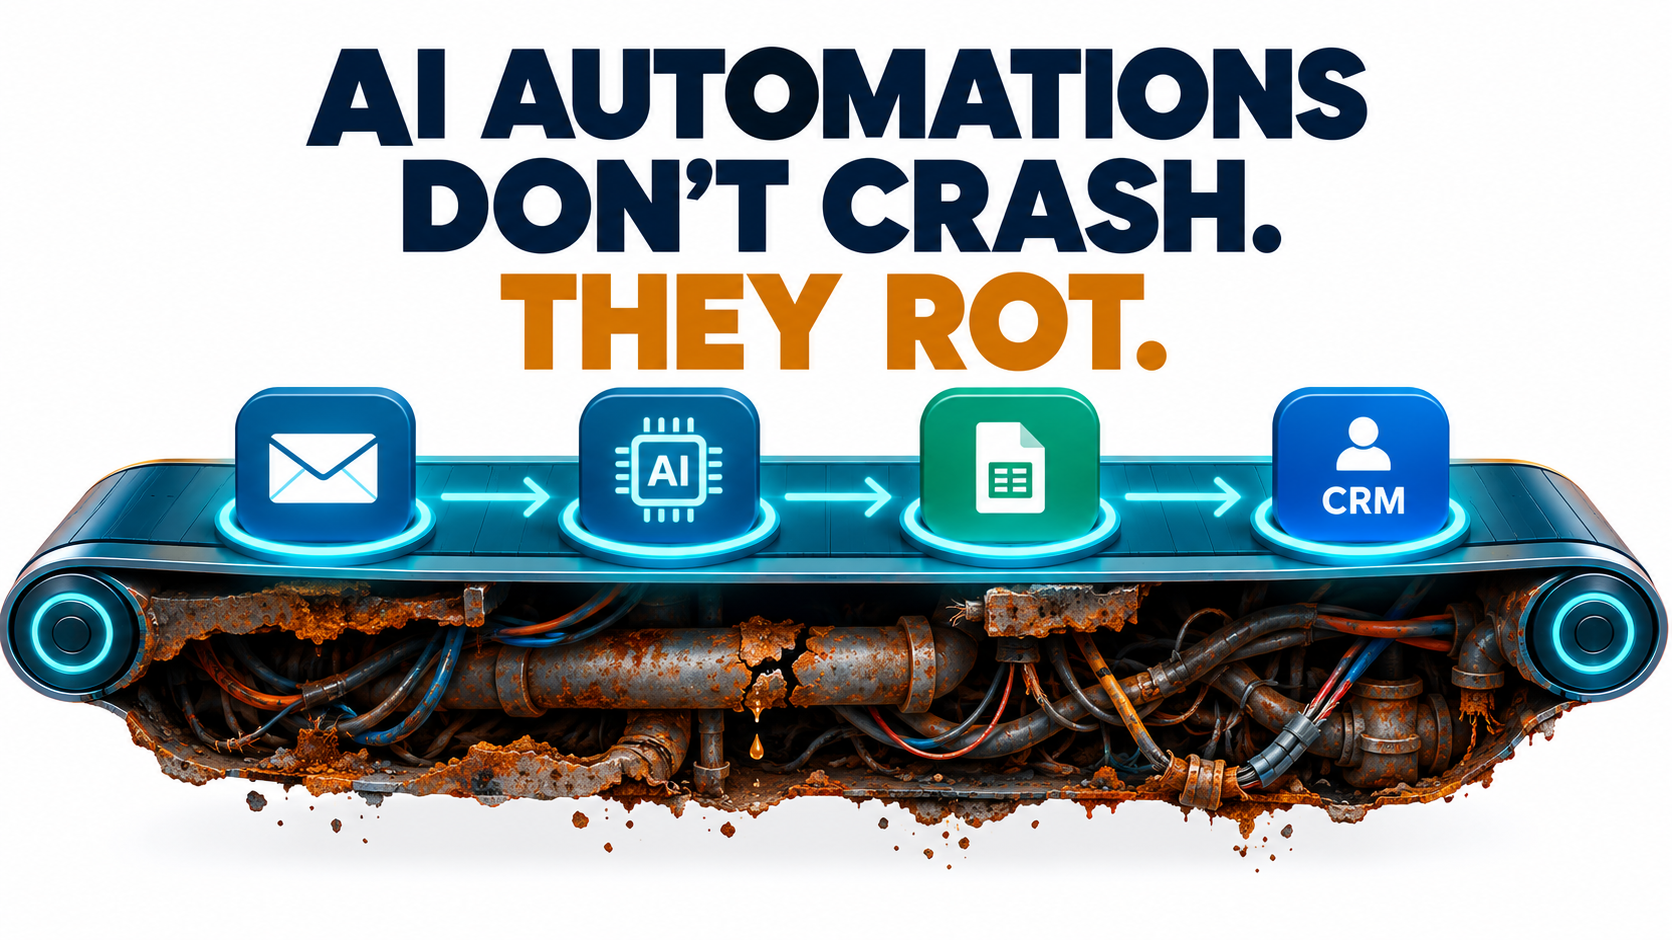
    This is the central paradox of self-healing AI automation in 2026: the systems that are best at recovering from failures are also the best at hiding them. A green dashboard built on top of an improperly designed self-healing layer is more dangerous than a red one, because at least a red dashboard prompts someone to look.

    This post is not an argument against self-healing automation — it genuinely works, it genuinely reduces downtime, and teams that implement it well report detection accuracy improvements from 67% to 94%, and auto-resolution rates reaching 80% of all production incidents. But “implementing it well” requires understanding what self-healing is actually supposed to fix, how the feedback loop should be structured, and — critically — which failure modes it will make worse if you design it carelessly.

    Here is the full architecture: the failure taxonomy, the control loop, the resilience layers, the governance model, and the anti-patterns that turn self-healing systems into sophisticated liability generators.

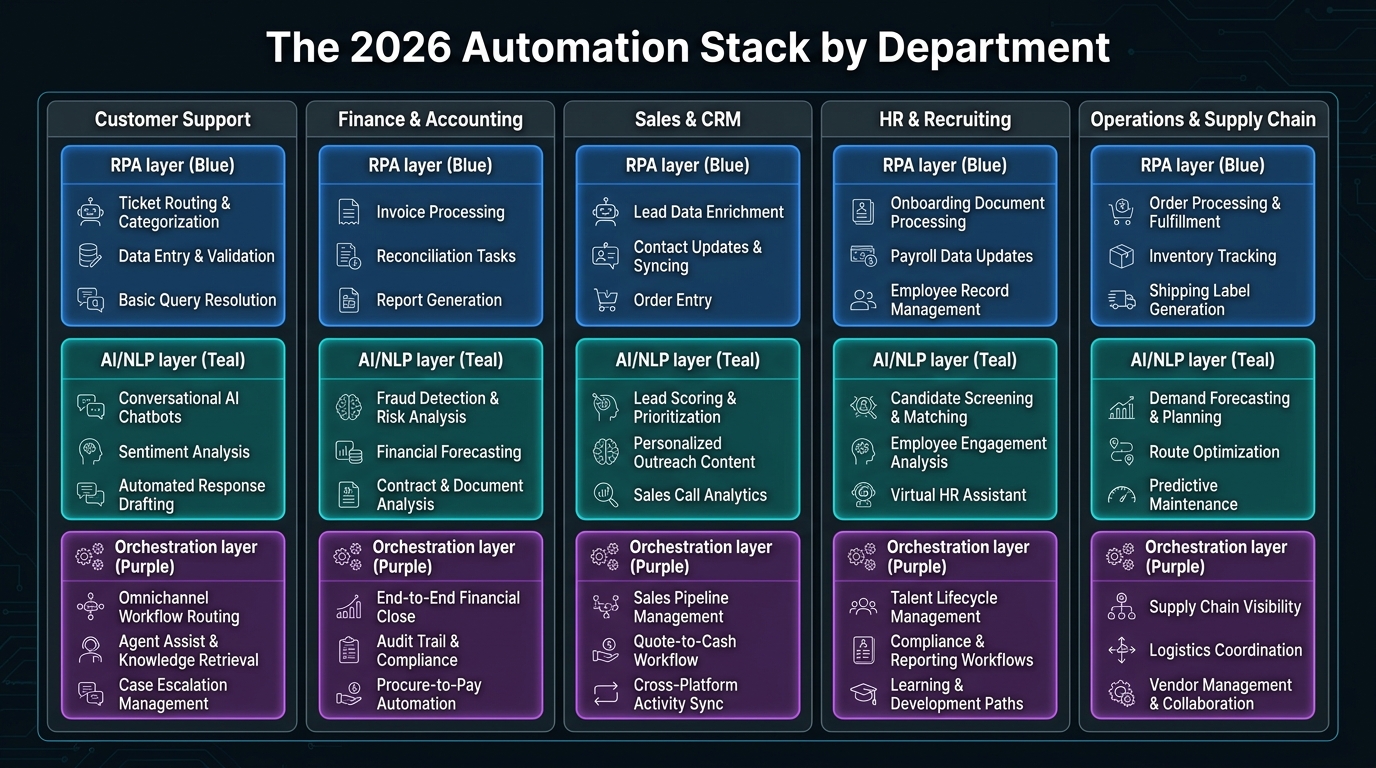
    The Five Failure Classes Self-Healing Must Actually Address

    Infographic showing the five failure classes that self-healing automation must address: transient, structural drift, semantic, dependency, and model degradation

    The first mistake most teams make is treating all automation failures as the same category of problem. They build a single “self-healing” mechanism — usually retry logic or a simple restart trigger — and apply it everywhere. This works for one type of failure. It makes four others worse.

    Before you design any self-healing system, you need a failure taxonomy. These are the five distinct classes your automation will encounter, and they require fundamentally different remediation strategies.

    1. Transient Failures

    These are the failures that resolve themselves if you wait. A network timeout. A downstream API rate-limit response. A temporary database lock. They’re caused by conditions that are inherently unstable and time-bound, and they account for a large percentage of what automation systems report as failures on a given day. Retry logic with exponential backoff is the correct and sufficient response. Applying anything more sophisticated — AI diagnosis, human escalation, re-routing logic — to transient failures is wasted complexity that slows your system down and pollutes your incident logs with noise.

    2. Structural Drift

    Structural drift is what happens when the environment the automation was built for has changed in a way that breaks the automation’s assumptions. In test automation, this is the classic locator problem: a UI element gets a new ID, and the test script can no longer find it. In RPA, it’s a desktop application that updated its layout. In data pipelines, it’s a source API that added required parameters. These failures are not transient — they will happen again every single run until someone fixes the underlying cause. Self-healing automation in this class means detecting the structural change, finding an alternative selector or mapping, applying the fix, and logging the change for human review. The AI component here is useful and well-established. Studies from RPA deployments report 70–90% reductions in UI-change-related failures when this class of healing is properly applied.

    3. Semantic Failures

    Semantic failures are the hardest class to automate remediation for, and the most dangerous to get wrong. This is when the automation runs successfully by every technical measure, but does the wrong thing. An AI classification model routes invoices to the wrong approval queue. A sentiment analysis step misreads a customer complaint as neutral. An extraction automation pulls the right field from the wrong version of a document. Semantic failures don’t throw errors. They produce outputs that look valid. The self-healing logic for this class must include output validation — comparing results against expected distributions, flagging statistical outliers, and routing to human review when confidence drops below a defined threshold. Attempting to auto-remediate semantic failures without human review is where systems create the kind of invisible damage described in this post’s opening paragraph.

    4. Dependency Failures

    These occur when a component your automation depends on — an upstream service, a third-party API, a data feed — fails independently of your system. The correct self-healing strategy here is circuit breaking: detecting that a dependency is unhealthy, stopping outbound requests to protect both your system and the failing dependency, and initiating a controlled degradation path. This might mean switching to a cached data source, queuing work for later processing, or switching to an alternative provider. The AI component in dependency failure remediation is primarily in predicting which dependencies are likely to fail before they do, based on latency trends and error rate patterns — so you can pre-warm alternatives rather than scrambling during an outage.

    5. Model Degradation

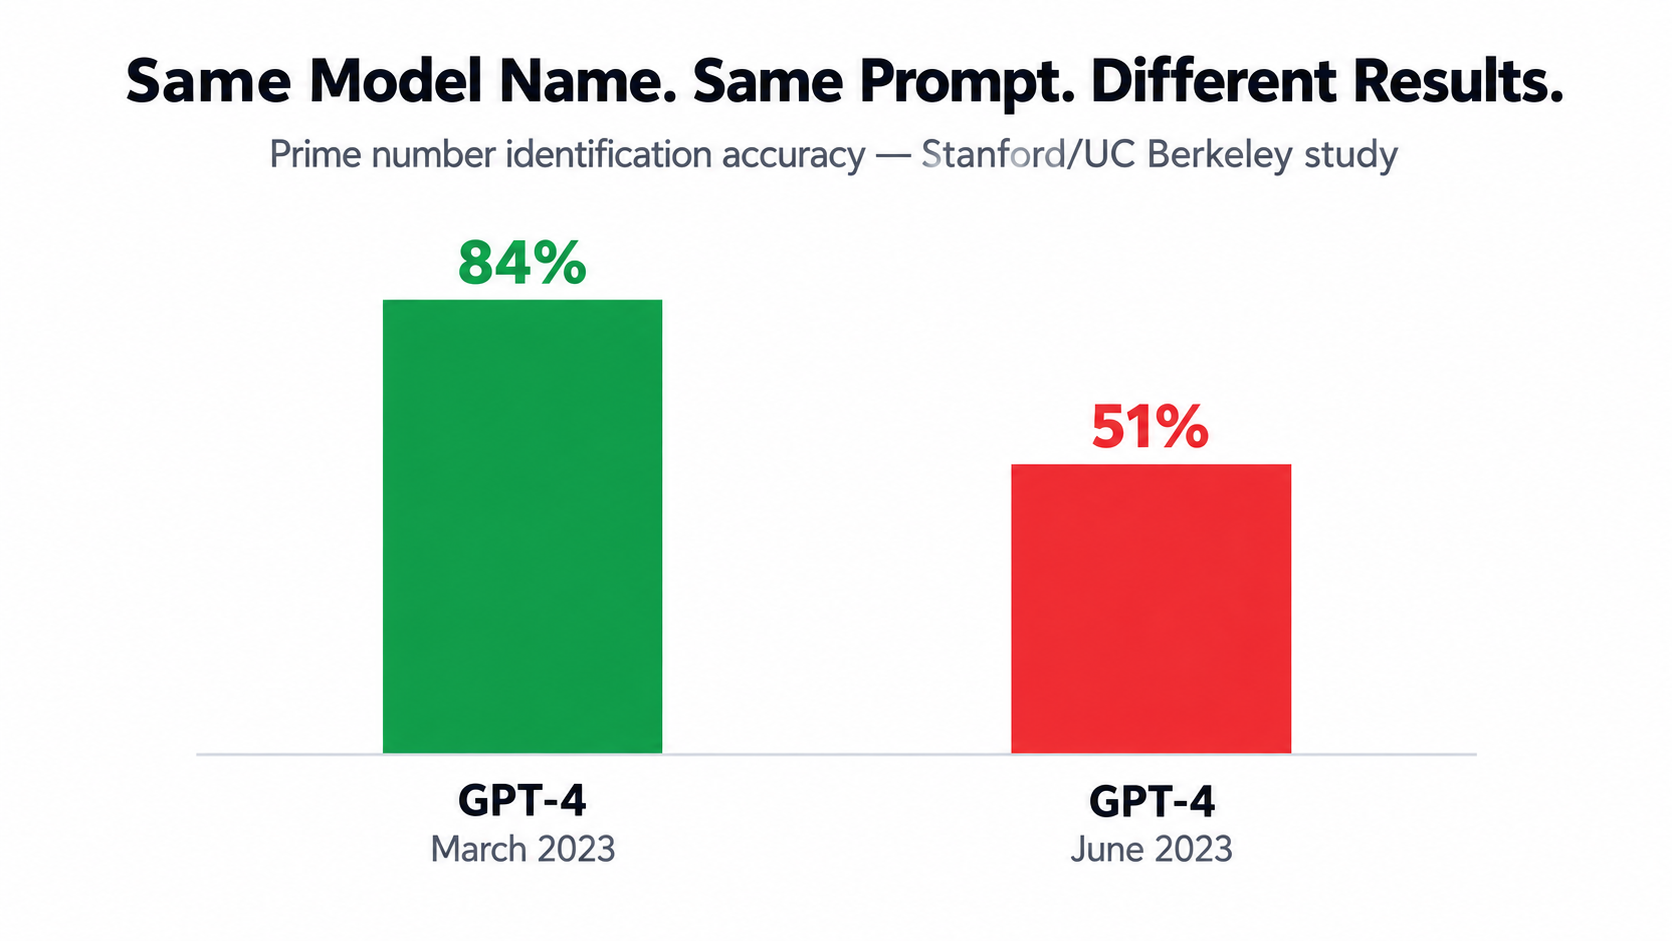
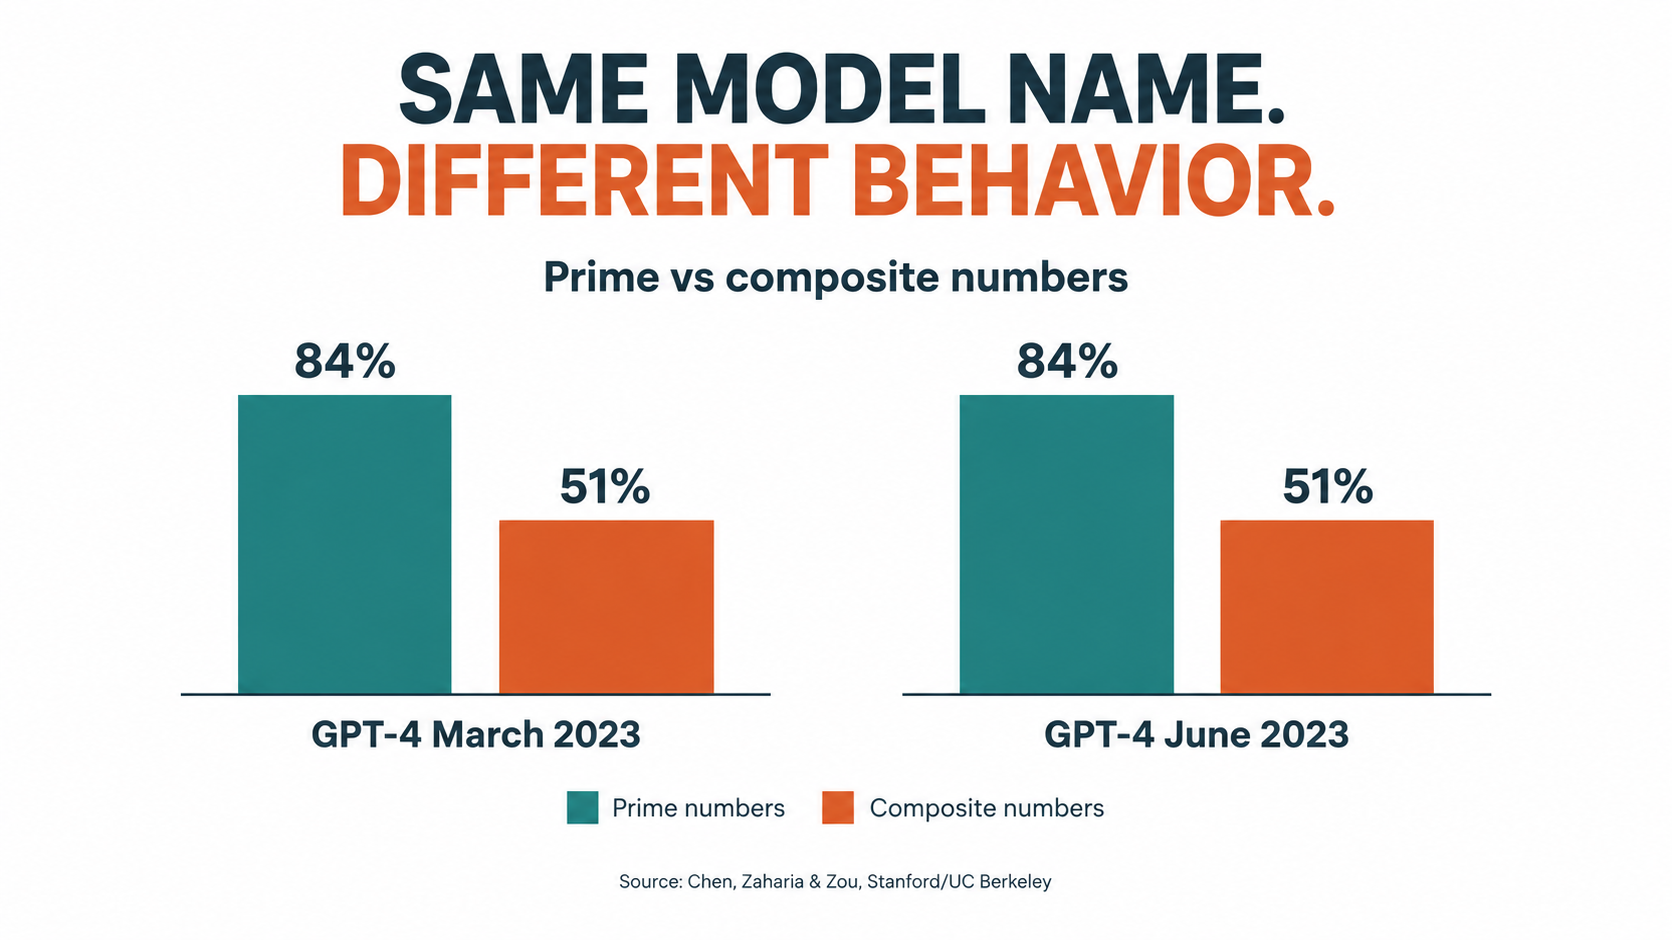
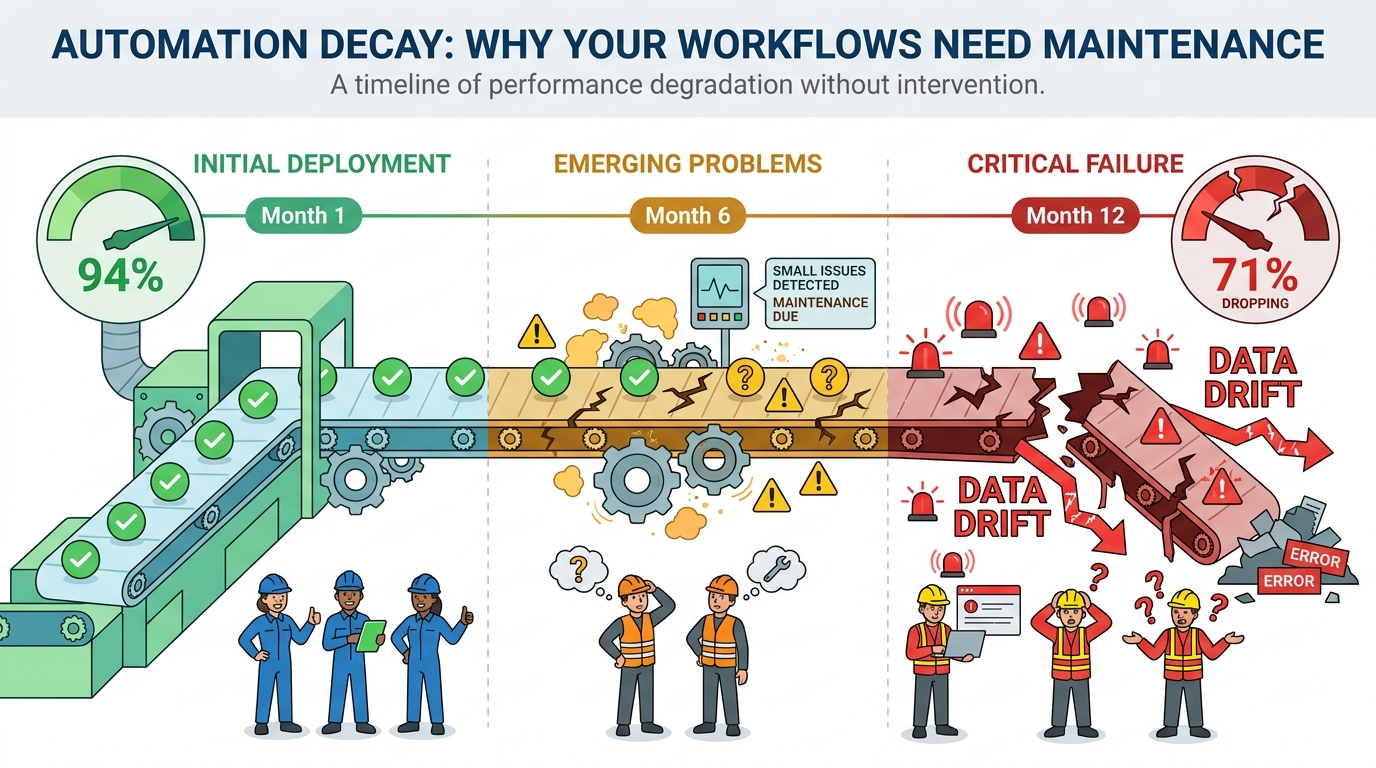
    For automation systems that include AI models, model degradation is its own failure class. The model doesn’t break — it just gets progressively worse. Training data becomes stale. The real-world distribution of inputs drifts away from the distribution the model was trained on. A model that was 94% accurate when deployed might be making decisions at 71% accuracy six months later, without any single failure event that would trigger a conventional alarm. Self-healing for model degradation requires continuous monitoring of output distributions, accuracy proxies, and feature statistics, with automated retraining triggers when drift crosses defined thresholds. This is covered in depth later in this post.

    The ODDAL Loop: The Architecture That Makes Healing Systematic

    Most self-healing implementations are reactive: something breaks, a recovery script fires, the system tries to continue. This architecture works for transient failures and nothing else. For all other failure classes, you need a proactive control loop that treats observability as a first-class design primitive rather than an afterthought bolted on after deployment.

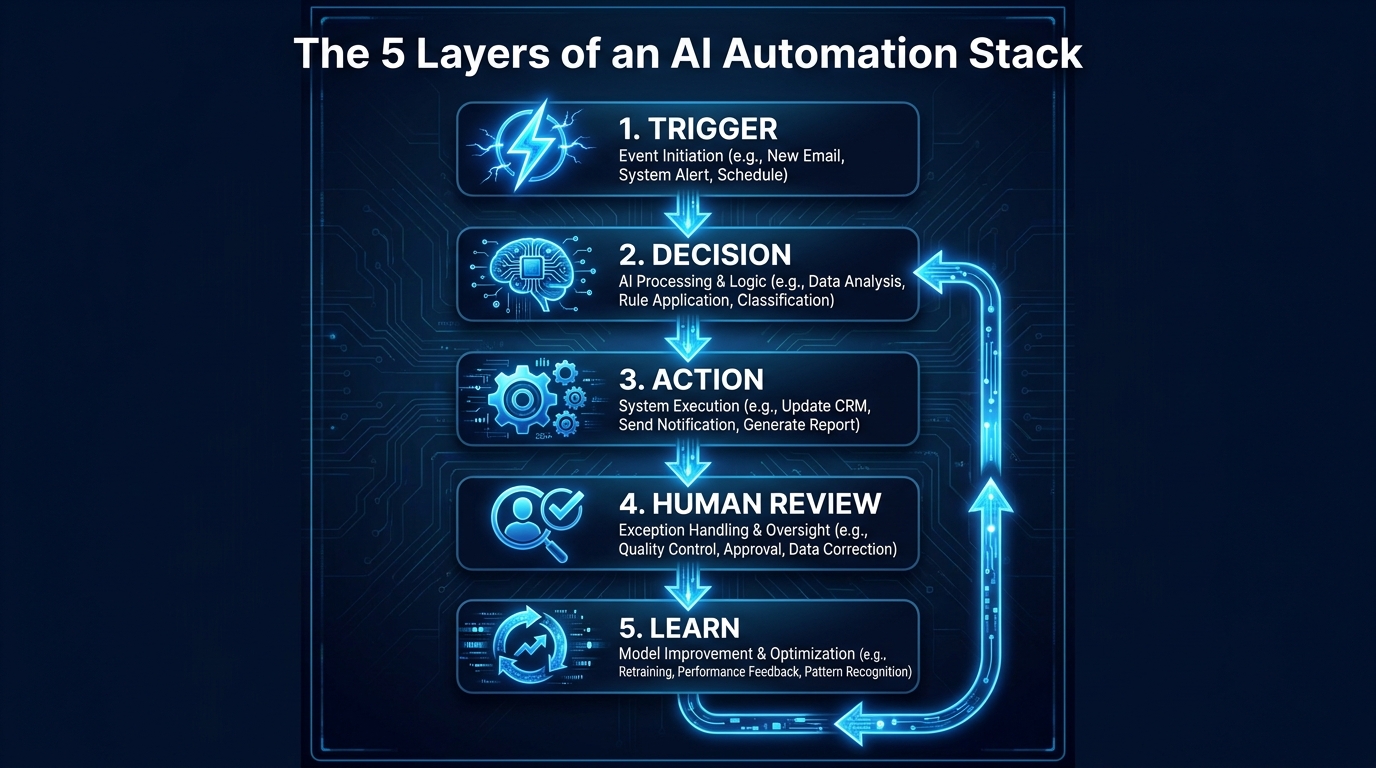
    The loop has five phases. Getting the sequence right is non-negotiable — skipping or conflating any phase is the single most reliable way to produce a system that heals the wrong thing.

    Phase 1 — Observe

    Observability in the context of self-healing is not the same as logging. Logging records what happened. Observability gives you the telemetry — metrics, traces, structured events, model output statistics — needed to detect anomalies before they become failures. The critical design decision here is instrumenting for the right signals. For infrastructure, this means latency percentiles and error rates. For data pipelines, it means row counts, null rates, and distribution statistics on key fields. For ML components, it means tracking prediction confidence scores, output distributions, and a rolling sample of predictions versus ground-truth labels where available. Teams that skip this phase try to build self-healing on top of reactive error logs, which means they only see failures after they’ve already caused damage.

    Phase 2 — Diagnose

    Once an anomaly is detected, the system needs to classify it correctly before deciding what to do. This is where AI earns its place in the loop — not as the thing that fixes failures, but as the thing that correctly identifies what kind of failure it is. An LLM-based diagnosis agent can parse logs, compare the anomaly signature against a catalog of known failure patterns, assess blast radius, and produce a structured failure classification with a confidence score. The output of the diagnosis phase should be: failure class (using your taxonomy), estimated root cause, confidence level, and recommended remediation action. It should explicitly not be an autonomous fix — that comes next, with governance.

    Phase 3 — Decide

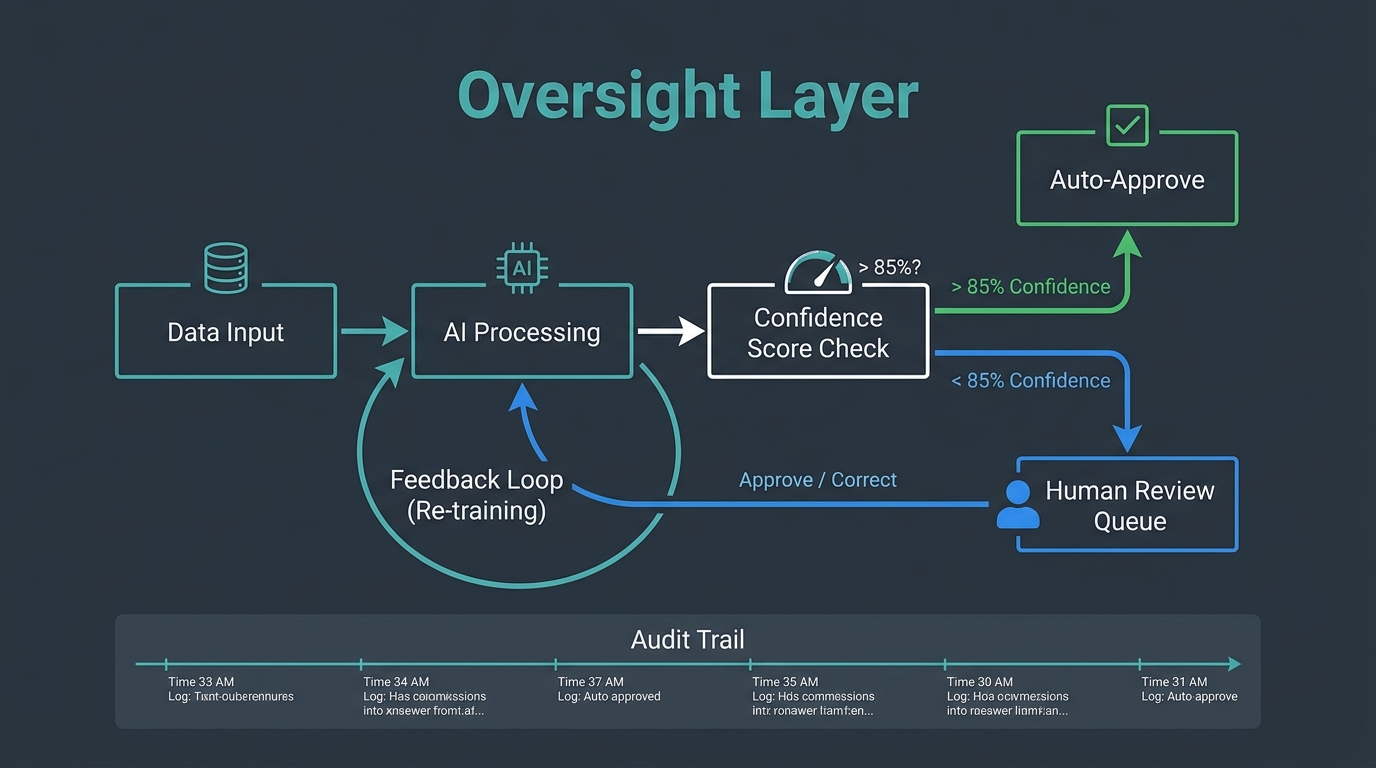
    The decide phase is where most self-healing systems either get too aggressive or not aggressive enough. Too aggressive: any diagnosed failure triggers immediate auto-remediation, regardless of confidence or impact. Not aggressive enough: everything gets escalated to humans, defeating the point of automation entirely. The correct model is a tiered confidence and risk framework, covered in detail in a later section. The key design principle is that the decide phase must be explicitly modeled — it should not be an implicit consequence of the diagnosis. Every possible remediation action should have a documented threshold for when it fires automatically, when it fires with notification, and when it requires explicit human approval.

    Phase 4 — Act

    The act phase executes the chosen remediation. Good remediation actions share four properties: they are idempotent (running them twice doesn’t make things worse), reversible (there is a rollback path), scoped (they affect the smallest possible part of the system), and observable (they produce a log entry that confirms the action was taken and what changed). Actions that fail any of these four tests should not be automated. A restart of a failed service is idempotent, reversible, scoped, and observable. A bulk data correction across a production database is probably none of those things and should require explicit human approval regardless of diagnosis confidence.

    Phase 5 — Learn

    The learn phase is what separates a self-healing system from a self-recovering one. Self-recovery handles the incident. Self-healing permanently reduces the probability of that incident happening again. Learning means feeding the outcome of each incident — what was diagnosed, what action was taken, whether it worked — back into the diagnosis model, the playbook catalog, and the threshold configuration. Over time, a well-designed learn phase produces a system whose auto-resolution rate increases, whose false-positive alert rate decreases, and whose diagnosis accuracy improves. The case study data showing detection accuracy jumping from 67% to 94% over three months reflects exactly this dynamic — the system was learning from each resolved incident.

    Layered Resilience: Where Classic Patterns Meet AI-Driven Repair

    Layered resilience architecture showing retry logic, circuit breakers, and dead-letter queues with AI diagnosis agent

    Self-healing is not a replacement for classic resilience engineering patterns. It is an extension of them. Teams that try to build AI-native self-healing from scratch without the underlying resilience primitives in place are skipping steps that have decades of production validation behind them. The right architecture layers AI-driven healing on top of — not instead of — circuit breakers, retry logic, and dead-letter queues.

    Layer 1: Retry Logic with Exponential Backoff

    This is the baseline. Every network call, every API integration, every external dependency interaction should be wrapped in retry logic that uses exponential backoff with jitter. “Jitter” — randomizing the wait time slightly on each retry — prevents the thundering-herd problem where thousands of simultaneous retries hit a recovering service at the exact same moment and knock it back down. The right configuration for most production systems is three attempts, starting at 100ms, doubling each time, with a maximum wait of around 30 seconds. Retries are appropriate only for transient failures — idempotent operations where re-executing the same request cannot cause duplicate state changes. Write operations that are not idempotent need idempotency keys or sequence numbers before retry logic applies safely.

    Layer 2: Circuit Breakers

    When retries keep failing — when a dependency isn’t just slow but structurally broken — you need a circuit breaker. The pattern has three states: closed (normal operation, all requests pass through), open (dependency marked as unhealthy, all requests fail fast without attempting the call), and half-open (a probe state where a small number of requests are allowed through to test whether the dependency has recovered). Circuit breakers protect your system from cascading failures by preventing resource exhaustion on calls that will fail anyway. They also protect struggling downstream services from being hammered by retry storms. The AI addition to this layer is predictive circuit breaking — using latency trend data and error rate patterns to open the circuit before failure rate crosses the threshold, rather than after.

    Layer 3: Dead-Letter Queues

    Some failures can’t be handled immediately, but they also can’t be discarded. A dead-letter queue (DLQ) is a holding area for messages or tasks that have exhausted their retry budget. Items in the DLQ are preserved rather than lost, and they become the target of both automated and manual remediation efforts. A well-designed DLQ integration does three things beyond simple storage: it categorizes items by failure type upon entry (so the AI diagnosis agent doesn’t have to re-process cold data), it sets an expiration policy that’s appropriate to the business context, and it surfaces volume metrics to an alerting system so that a spike in DLQ depth triggers review before items expire. In business-process automation, the DLQ is where semantic failures typically land — they weren’t technically invalid, but something about them didn’t meet validation thresholds, and a human needs to make the call.

    Where AI-Driven Repair Fits in the Stack

    AI-driven repair sits above all three classic layers, not below them. Its job is to handle the failures that Layer 1, 2, and 3 have captured but not resolved — those that require contextual diagnosis, adaptive remediation, or structural change to fix. An AI diagnosis agent reading DLQ contents and classifying failure types is a force multiplier on the classic stack. An AI agent attempting to replace Layer 1 retry logic is a performance liability and a governance nightmare.

    Confidence Thresholds and the Human-in-the-Loop Gate Model

    Confidence threshold model showing three decision gates: auto-resolve at high confidence, flag and notify at medium confidence, halt and escalate at low confidence

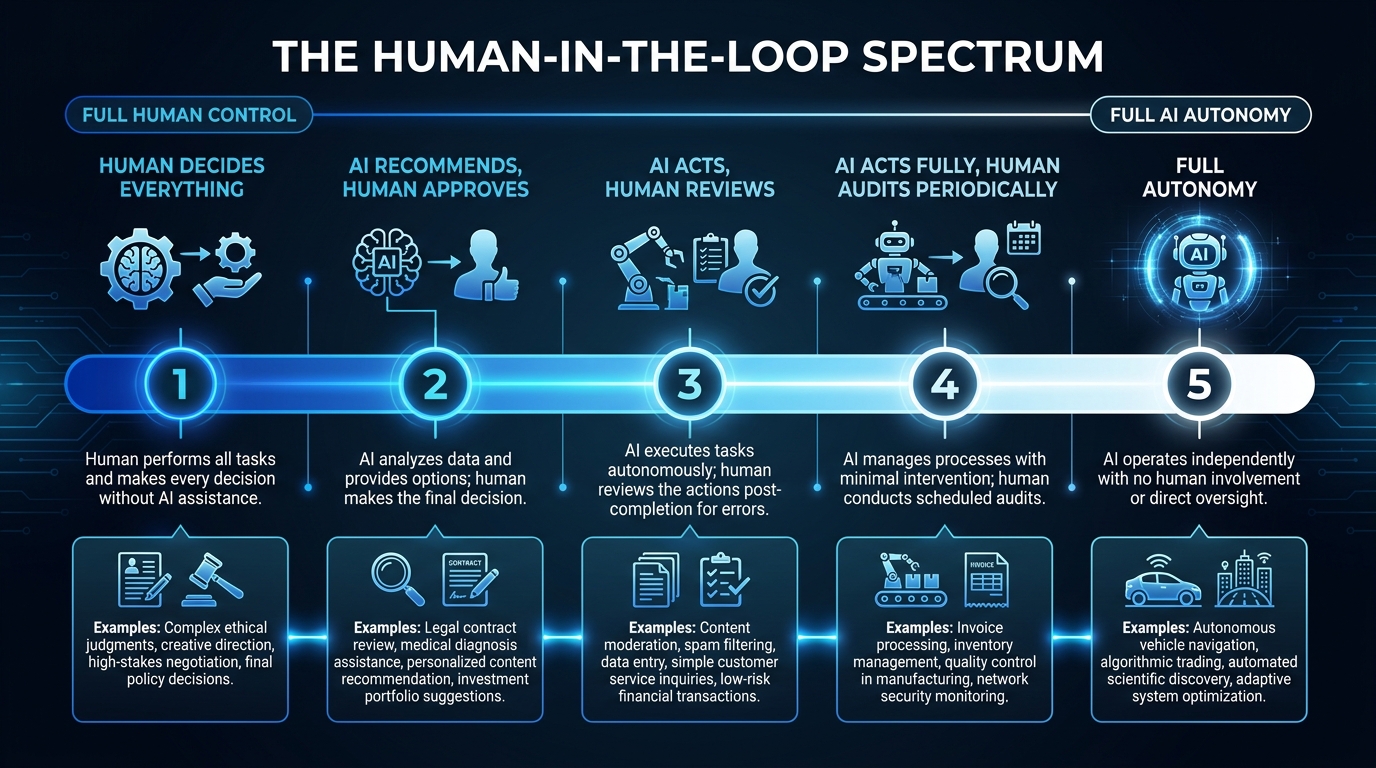
    The most consequential design decision in a self-healing system is not the detection algorithm or the remediation playbook. It is the threshold model that determines when the system acts autonomously, when it notifies a human and proceeds, and when it stops and waits for explicit approval. Get this wrong in either direction and you’ve built a system that’s either useless or dangerous.

    The Three-Gate Model

    A practical, field-tested threshold model uses three gates based on a combination of diagnosis confidence score and estimated impact of the remediation action.

    Gate 1 — Auto-Resolve (High confidence + Low impact): Confidence score above 90%, remediation action is reversible and scoped. The system acts autonomously, logs the action with full detail, and sends a low-priority notification to the owning team. No human approval required. Example: retry a failed API call, restart a hung worker process, re-route traffic from an unhealthy pod.

    Gate 2 — Flag and Notify (Medium confidence or Medium impact): Confidence score between 60–89%, or remediation action affects more than a single component. The system proposes a specific remediation, notifies the on-call engineer with full diagnosis context, and proceeds with the action after a defined window (typically 15–30 minutes) unless the engineer overrides. This preserves velocity while ensuring a human sees high-frequency healing events before they compound. Example: update an API authentication credential that has rotated, apply a schema migration to bring a downstream consumer back in sync.

    Gate 3 — Halt and Escalate (Low confidence or High impact): Confidence score below 60%, or the remediation action could affect data integrity, financial transactions, or production databases. The system halts the affected workflow, fires a high-priority alert, and presents the diagnosis and candidate remediation options to the on-call engineer for explicit approval. Example: any bulk data operation, any action affecting a payment processing pipeline, any remediation that modifies a core configuration file.

    Setting Thresholds Is Not a One-Time Decision

    Threshold calibration is an ongoing operational task, not a deployment setting. Teams that set thresholds at deployment and never revisit them end up with systems that were calibrated against early failure patterns and are operating on stale assumptions six months later. A governance practice that reviews threshold performance monthly — measuring auto-resolution correctness rate, false-positive escalation rate, and missed-escalation incidents — is what keeps the model well-calibrated over time. The target metrics: auto-resolved actions should have a post-validation pass rate above 95%; escalations should have a confirmation rate below 20% (meaning most human reviews confirm the system’s diagnosis was correct and the escalation was appropriate, not that the system was wrong).

    Regulated Environments Require Stricter Default Thresholds

    In financial services, healthcare, and other regulated verticals, the gate model needs additional constraints beyond confidence and impact. Some remediation actions may be prohibited from automation entirely under regulatory frameworks, regardless of confidence score. Others require a documented audit trail before they can be replicated. Before deploying a self-healing layer in a regulated context, the compliance team needs to review the full remediation playbook and flag which actions have regulatory implications — and those actions should be moved to Gate 3 by policy, independent of the AI’s confidence assessment.

    Drift, Schema Change, and Model Degradation: The Slow Failures Nobody Notices

    ML pipeline monitoring dashboard showing covariate drift detection, model degradation accuracy chart, and schema mismatch alerts

    Fast failures are comparatively easy to handle. They produce errors, they trigger alerts, they have clear timestamps. Slow failures — the ones that degrade over weeks or months — are the ones that destroy confidence in automation systems, because they’re often discovered not by the system’s own monitoring, but by a downstream stakeholder who notices that something seems off.

    There are three categories of slow failure that self-healing architectures must address specifically, with their own detection and remediation strategies.

    Covariate Drift: When the World Stops Matching the Training Data

    Covariate drift occurs when the statistical distribution of inputs to an AI model shifts away from the distribution the model was trained on, without the outputs immediately showing obvious errors. A fraud detection model trained on transaction patterns from 2024 may be systematically underflagging a new class of fraud that emerged in late 2026. A document extraction model trained on a specific invoice template may silently degrade as suppliers update their templates. The distribution of inputs has changed; the model’s weights haven’t.

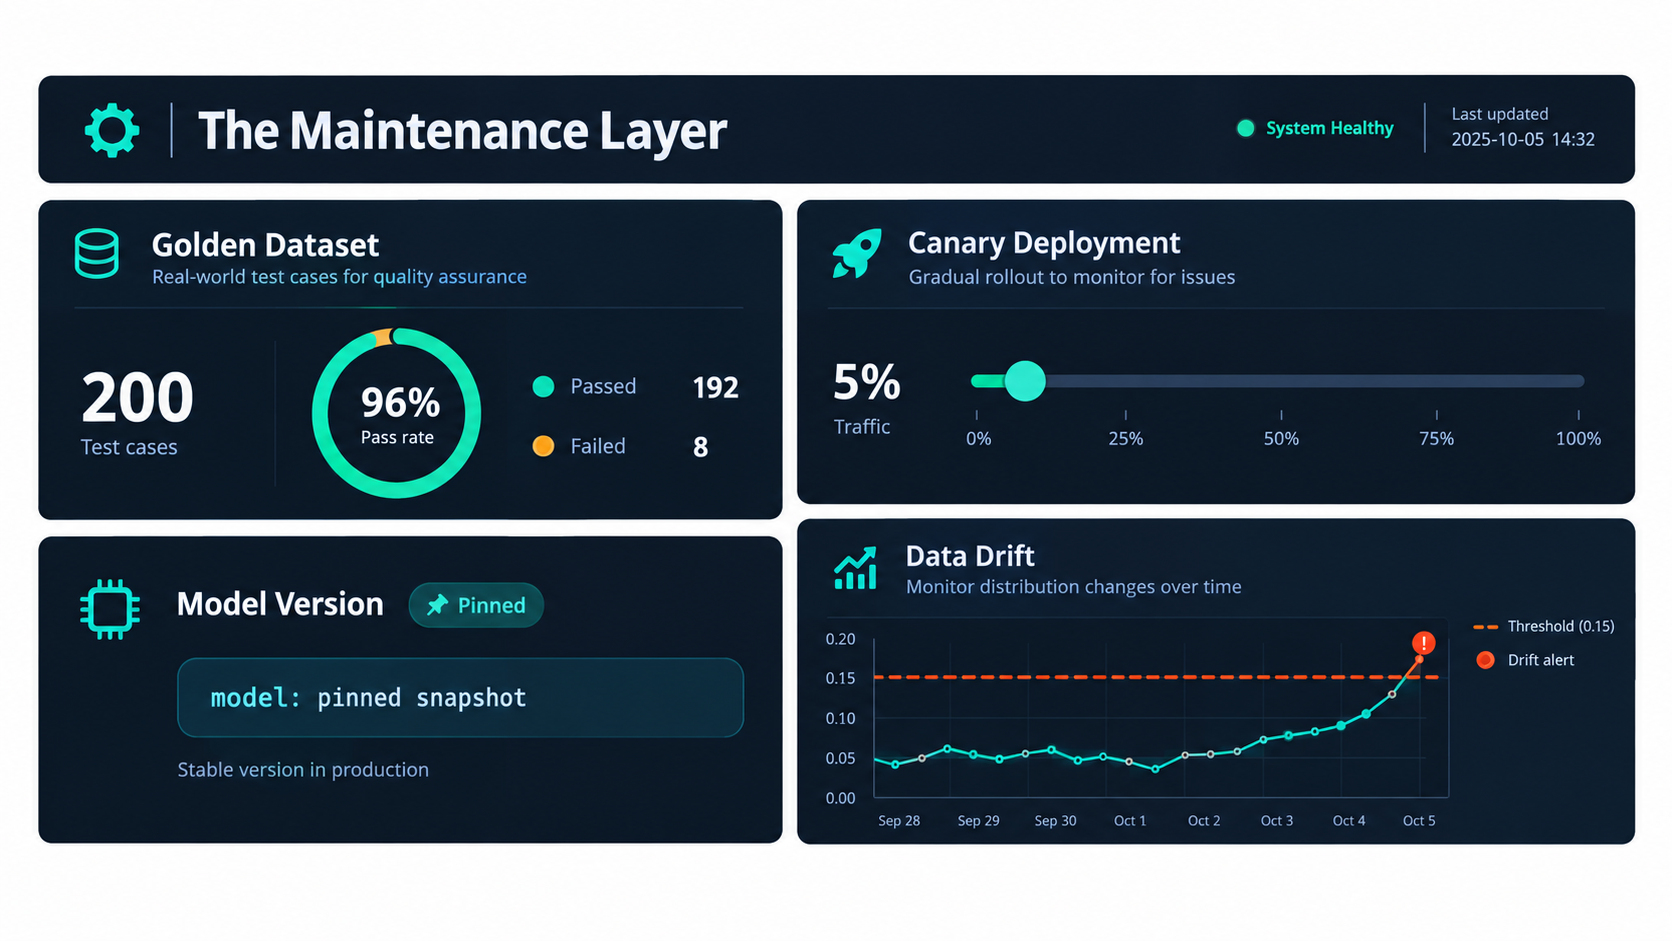
    Detecting covariate drift requires monitoring feature statistics — mean, variance, and distribution shape of key input fields — in the live environment and comparing them against baseline statistics captured at training time. Statistical tests like the Kolmogorov-Smirnov test or Population Stability Index (PSI) can be run as scheduled pipeline steps and used to trigger alerts when drift exceeds a defined threshold. The remediation — automated or human-approved — is typically a retraining trigger that pulls recent production data into the training set and re-validates the model before deploying the update.

    Schema Change: When Upstream Data Stops Matching Expectations

    Schema changes are among the most common causes of silent data pipeline failures. An upstream team renames a column, drops a field, changes a data type from string to integer, or starts populating a previously null field. The pipeline downstream doesn’t break loudly — it either throws a handled exception and continues with nulls, or misinterprets the changed field and produces subtly wrong outputs. One industry estimate puts the annual cost of data downtime at $3.6 million per organization, and schema change is one of the primary contributors.

    Self-healing for schema change requires schema registry integration and contract testing at pipeline ingestion points. When a new batch of data arrives, the pipeline should validate it against the expected schema before processing. On mismatch, the detection should classify the type of change — additive (new fields added, generally safe), breaking (fields renamed or dropped, requires remediation), or type-changing (field type altered, requires explicit validation logic). Additive changes can often be handled automatically with conservative defaults. Breaking changes should route to Gate 2 or Gate 3, depending on the affected pipeline’s downstream impact.

    Model Degradation: Measuring What You Can’t Directly Observe

    The hardest slow-failure class to detect is model degradation in cases where you don’t have ground-truth labels available in real time. A model making predictions about customer churn won’t have its predictions validated for 30, 60, or 90 days — by the time you know whether the prediction was right, the model has made thousands more decisions without feedback. Two proxy approaches bridge this gap: output distribution monitoring (tracking whether the distribution of predicted classes or scores is shifting over time relative to the baseline) and confidence score monitoring (tracking whether the model’s own internal confidence scores are trending downward, which often precedes measurable accuracy degradation).

    When either proxy metric triggers an alert, the self-healing response is calibrated: first, flag recent predictions that fell in the degraded confidence range for human spot-check review; second, accelerate the ground-truth collection timeline where possible (which might mean sampling a subset of predictions for manual validation); third, trigger a candidate retraining run in a shadow environment and hold it for evaluation before any production deployment. The decision to swap the degraded model for the retrained candidate should always be a Gate 2 or Gate 3 action — the cost of deploying a worse model than the one it replaces is typically higher than the cost of a short review delay.

    Anti-Patterns: How Self-Healing Creates New Fragility

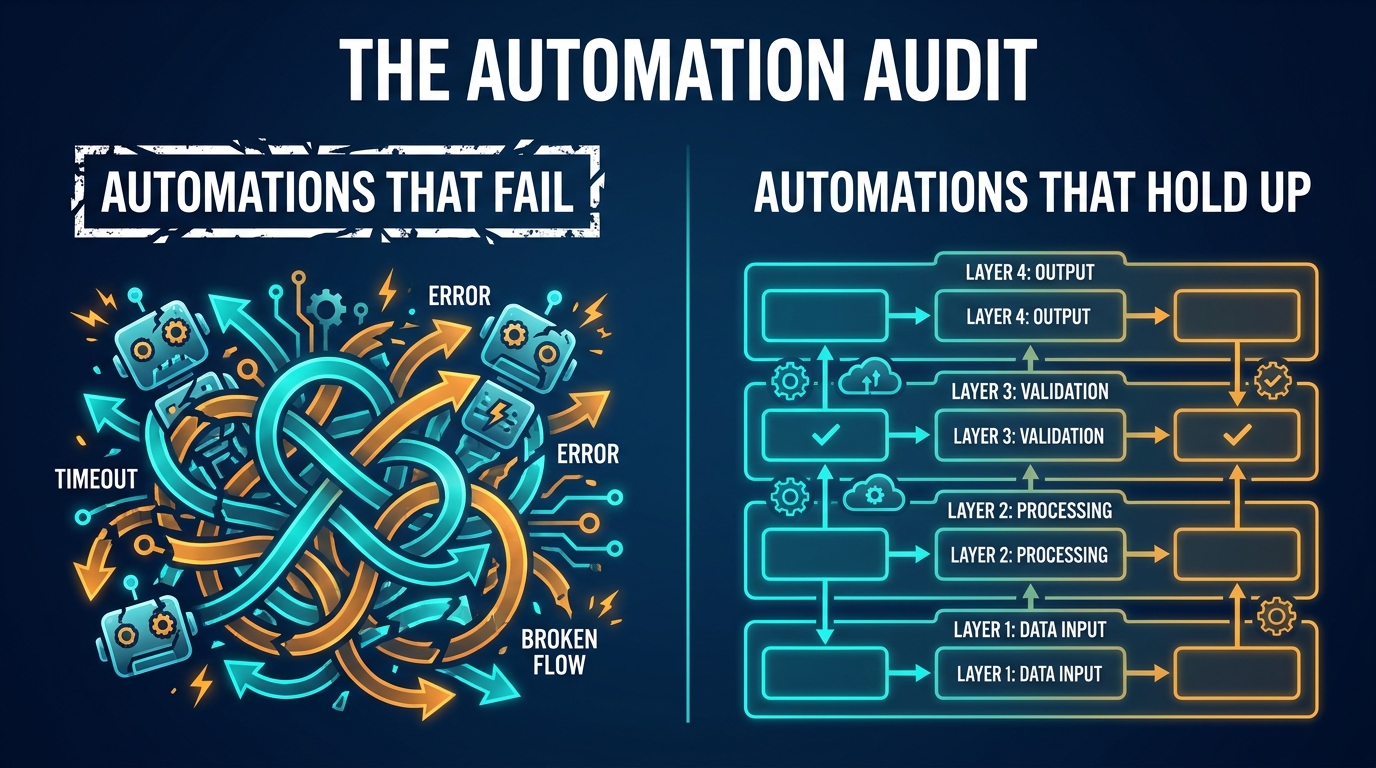
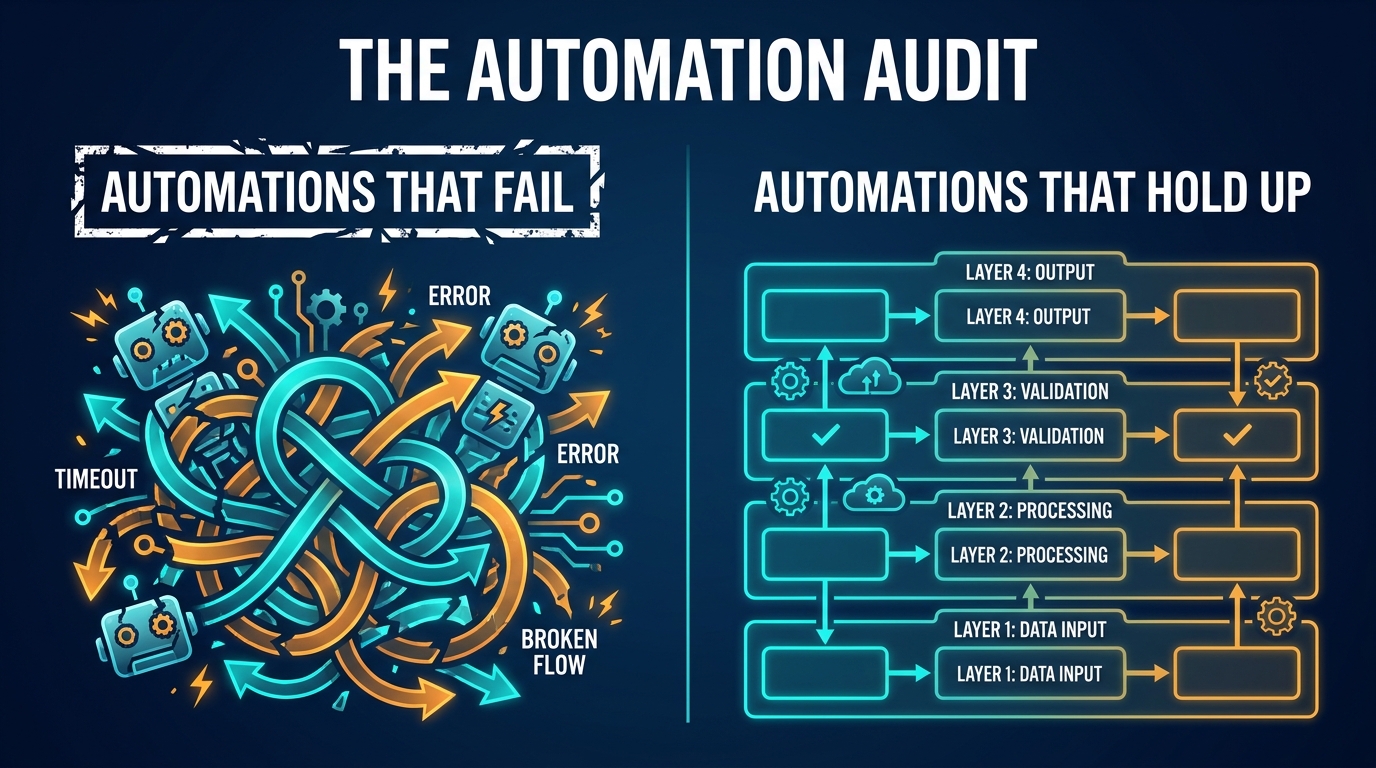
    Split comparison showing self-healing anti-patterns versus correct design practices for AI automation systems

    Every pattern introduced to reduce fragility has a failure mode of its own. Self-healing is no exception. The following are the anti-patterns most commonly observed in production deployments — not theoretical edge cases, but patterns that teams have shipped, regretted, and had to retrofit out of live systems.

    Silent Healing: The “Green Dashboard” Trap

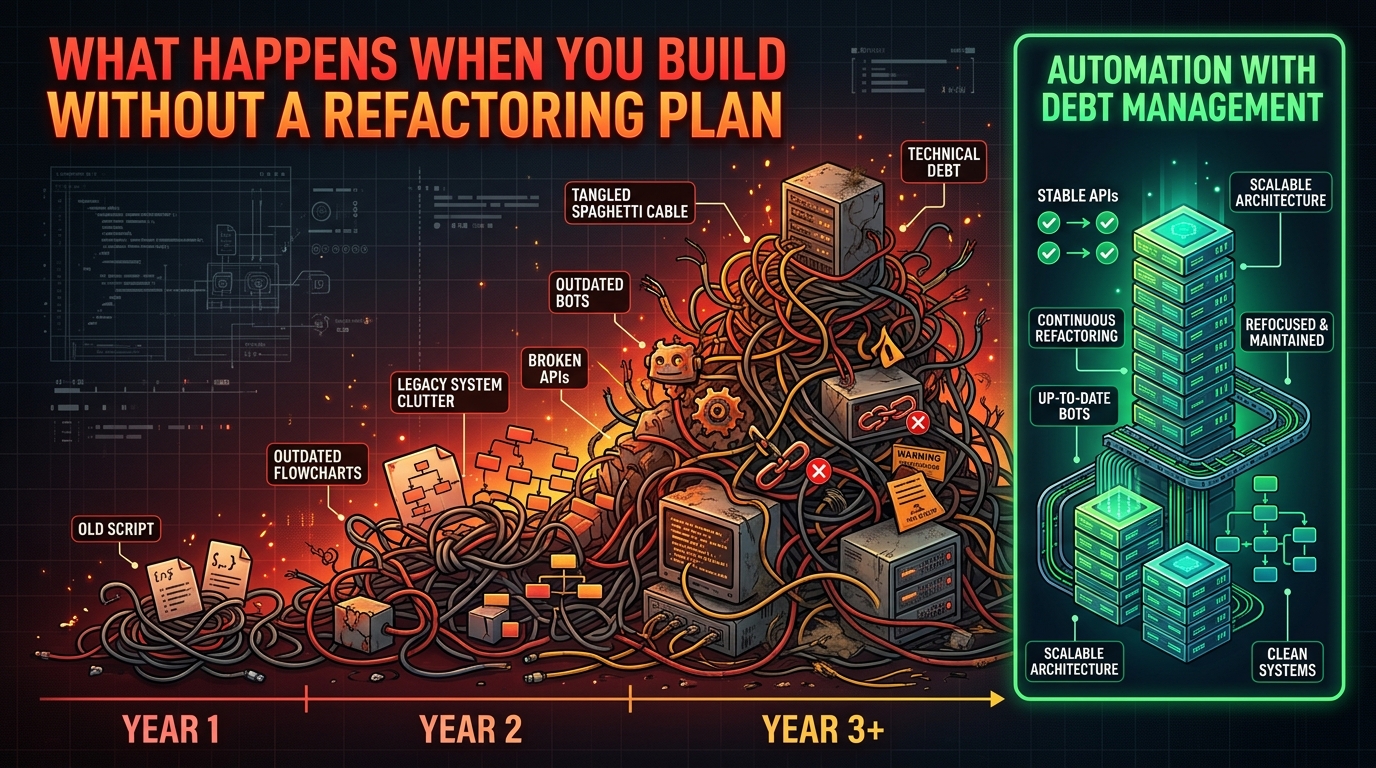
    This is the anti-pattern described in the introduction. The self-healing system recovers from failures without surfacing them, resulting in a monitoring dashboard that looks healthy while the underlying system is in a degraded state. Every healing action should generate a visible log entry, categorized by failure class and remediation applied. Healing event volume should be tracked as its own metric — and a spike in healing frequency should trigger an alert, because it means the system is working harder than normal to maintain normal-looking outputs. A system that is healing five times per hour is not operating normally; it is compensating for something that needs a structural fix.

    Over-Healing: Masking Real Defects

    In test automation, this is the phenomenon where self-healing tools keep test suites green by automatically adapting to UI changes — including changes that represent genuine defects in the product under test. The tests pass; the product is broken. The same failure mode exists in production automation: a self-healing system that automatically routes failing tasks around a broken downstream component may be hiding the fact that the downstream component has a data quality problem that’s been growing for weeks. Self-healing logic should escalate on healing frequency, not just on healing failure. If the same type of failure is being healed repeatedly, that pattern itself is an alert condition requiring root cause investigation.

    Confidence Theater

    This anti-pattern occurs when teams implement confidence scoring in their diagnosis layer but set all the thresholds so permissively that the confidence score never actually gates an action. Everything routes to Gate 1. The confidence score becomes a number that appears in logs but doesn’t influence behavior. This is worse than not having confidence scoring at all, because it gives the appearance of governance without the substance — a situation that tends to surface badly in post-incident reviews or audits. Threshold calibration should be treated as a security-review-grade design decision, with explicit documentation of why specific thresholds were chosen and what evidence supports them.

    Feedback Loop Neglect

    The learn phase of the ODDAL loop is the first thing cut when teams are under delivery pressure. The system detects, diagnoses, and acts — but the outcomes never feed back into the diagnosis model. Over time, the diagnosis model becomes stale. Failure patterns that have been resolved at the root cause level still generate alerts. New failure patterns that weren’t in the original training set get misclassified. The system’s auto-resolution rate plateaus or starts declining. Teams that skip the learn phase end up with a self-healing system that requires more and more manual reconfiguration to stay accurate — gradually converging back on the same maintenance burden it was supposed to eliminate.

    Scope Creep in Remediation Actions

    Remediation playbooks have a natural tendency to expand. An action that started as “restart the failed service” gets amended over time to “restart the failed service and also clear the cache and also reset the connection pool.” Each amendment makes intuitive sense when it’s added, but the cumulative effect is a remediation action that is no longer idempotent, no longer reversible in a single step, and much harder to audit when something goes wrong. Each remediation action in the playbook should have an explicit scope contract — what it changes, what it does not change, and what validation step confirms the action succeeded. Any amendment to a playbook action should go through the same review process as a code change.

    Governance, Audit Trails, and the Accountability Gap

    When a human makes a bad decision, there is accountability: a person who made the call, a reasoning chain that can be reviewed, and an organizational process for learning from the error. When an automated system makes a bad decision, the accountability structure often doesn’t exist unless it was deliberately designed in from the start. This gap is not hypothetical — it is the central complaint of every compliance and audit team that has reviewed an AI automation deployment.

    What an Audit Trail Must Capture

    Every automated action taken by a self-healing system should generate an immutable audit record containing: the timestamp and unique identifier of the incident; the raw telemetry that triggered the alert; the diagnosis output, including failure class, confidence score, and the evidence used to reach that diagnosis; the remediation action selected and the gate level it fell into; whether the action was autonomous or required human approval and — if human-approved — who approved it and when; and the post-remediation validation result confirming whether the action succeeded. This record needs to be stored somewhere that the self-healing system itself cannot modify — either an append-only log store or an external audit system.

    Role Clarity: Who Owns the System’s Decisions

    In organizations that haven’t explicitly assigned ownership of self-healing automation decisions, audit questions produce paralysis. “Who approved this change?” gets answered with “the system did it automatically” — which is not a satisfactory answer for a regulator, a post-incident review board, or a customer whose data was affected. The governance model should define: a system owner responsible for threshold configuration and playbook review; a review board (at minimum one engineer and one process owner) that approves playbook changes; and an escalation owner who is paged when Gate 3 actions occur. These are not roles that need to be full-time dedicated positions — but they need to be named, documented, and actively maintained.

    Review Cadences That Keep Governance Real

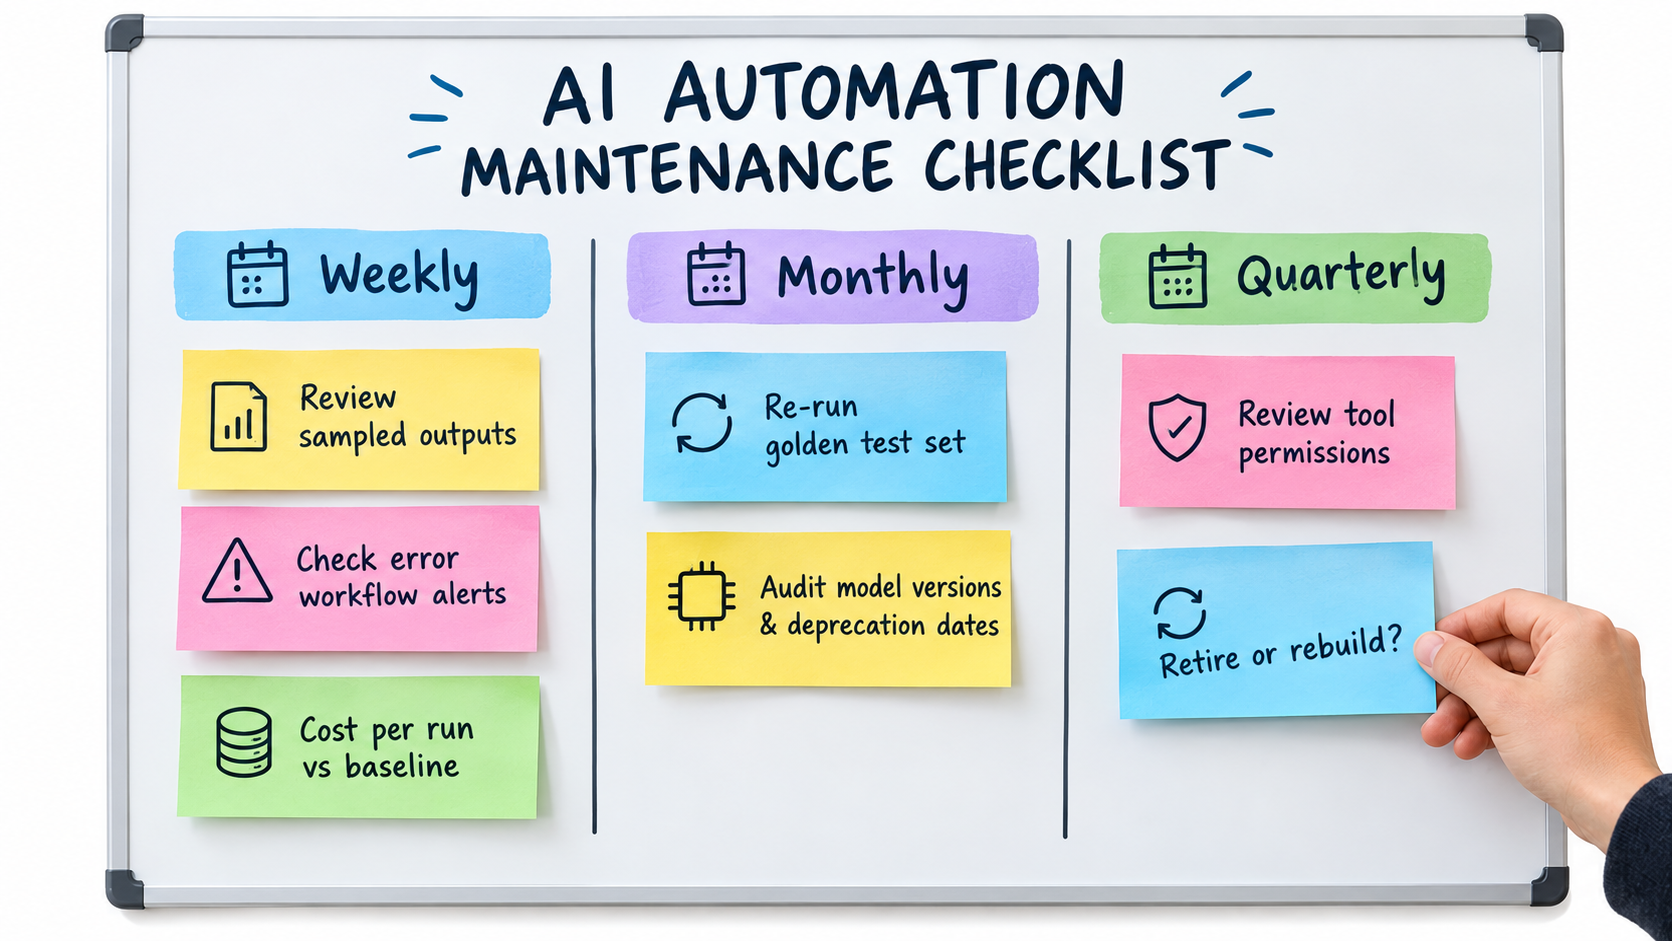
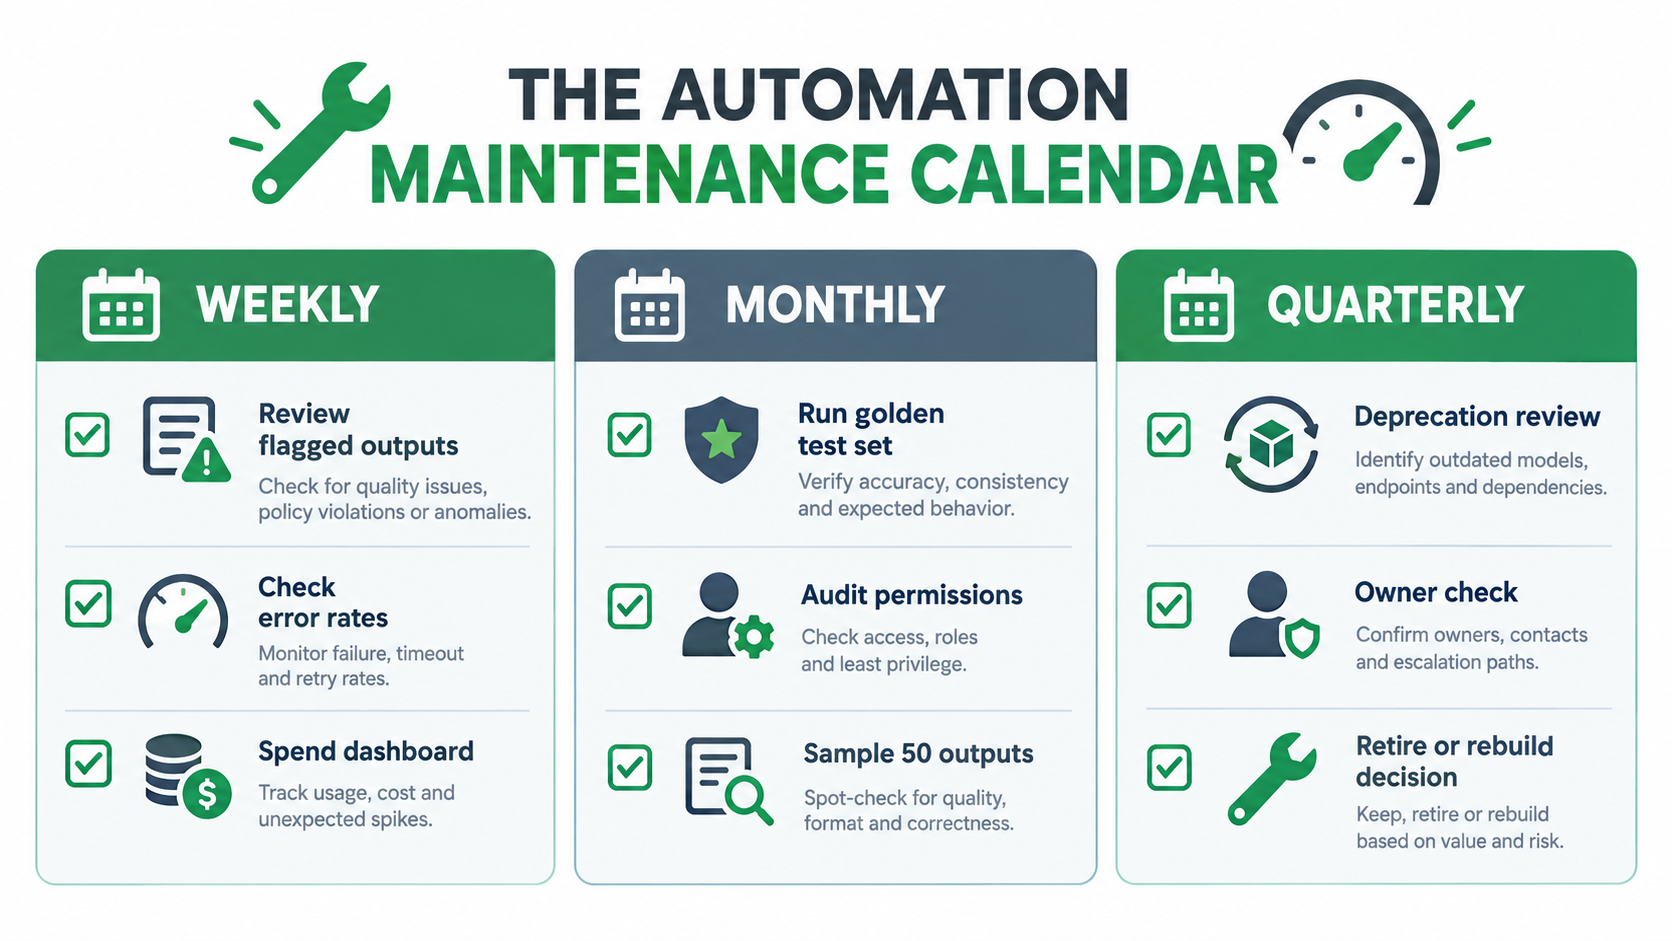
    Governance that exists only on paper is worse than no governance — it creates the illusion of oversight without the substance. Three review cadences keep self-healing governance meaningful in practice: a weekly review of healing event volume and Gate 1/2/3 distribution (to catch threshold drift early), a monthly review of diagnosis accuracy and false-positive rate (to calibrate the learn phase), and a quarterly full playbook review (to retire stale remediation actions, add new ones for emerging failure patterns, and re-validate scope contracts). Each review should produce a written record — even a brief one — that confirms the review occurred and notes any threshold or playbook changes made as a result.

    Building the Feedback Loop That Actually Learns

    The learn phase is where self-healing automation creates durable value rather than temporary convenience. Without it, you have a system that responds to failures. With it, you have a system that progressively encounters fewer failures over time — because each incident makes the system smarter about both detecting and preventing the next one. Building this loop in practice requires four specific components that many implementations omit.

    Component 1: Outcome Labeling

    For the diagnosis model to learn, it needs labeled outcomes: did the remediation action actually resolve the failure, or did the failure recur? This sounds obvious but is frequently absent. Many systems log that an action was taken but not whether it worked. Outcome labeling requires a post-remediation validation step — a check that runs some defined interval after the action to confirm the target system is operating normally and that the same failure signature hasn’t re-appeared. The validation result becomes the ground-truth label that trains the next iteration of the diagnosis model.

    Component 2: Pattern Immunization

    When a failure pattern has been resolved at root cause — not just remediated at symptom level — the system should update its detection rules to recognize that the pattern has been fixed and should no longer trigger that specific remediation path. This prevents the system from continuing to alert on conditions that no longer exist, which is a major source of alert fatigue in mature deployments. Pattern immunization is the automation equivalent of a doctor updating a patient’s treatment history: “this was a problem, it’s been fixed, don’t keep treating it.”

    Component 3: Counterfactual Logging

    Counterfactual logging tracks cases where the system would have taken an action but didn’t — either because confidence was too low, or because a human overrode the proposed remediation. These cases are at least as valuable as successful resolutions for training the diagnosis model. A high rate of human overrides on a specific failure class tells you that your diagnosis model is wrong about that class and needs more training data. A high rate of Gate 3 escalations that humans approve without modification tells you the threshold is set too conservatively and could be moved to Gate 2.

    Component 4: Replay Testing

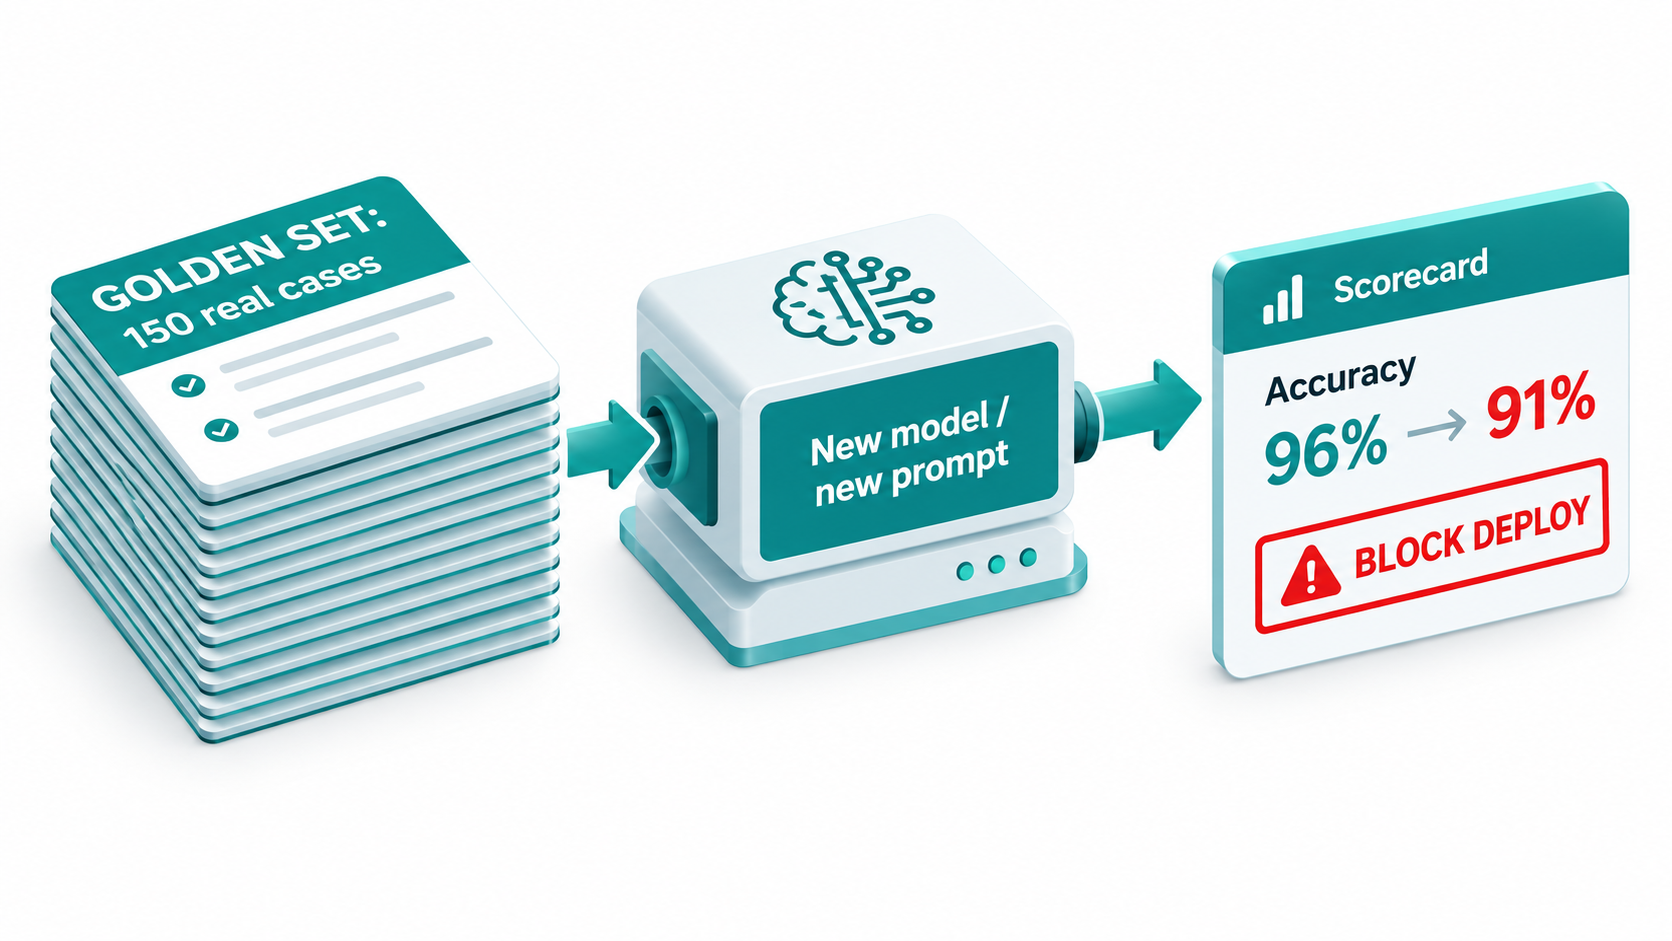
    Any change to the diagnosis model, remediation playbooks, or confidence thresholds should be validated against a historical dataset of real incidents before it goes to production. Replay testing re-runs past incidents through the updated system and compares the proposed actions against the documented correct resolutions. This catches regressions — cases where a change that improves handling of a new failure pattern inadvertently degrades handling of an existing one. It’s the equivalent of a unit test suite for the self-healing system itself.

    Implementation Sequence: Where to Start and What to Instrument First

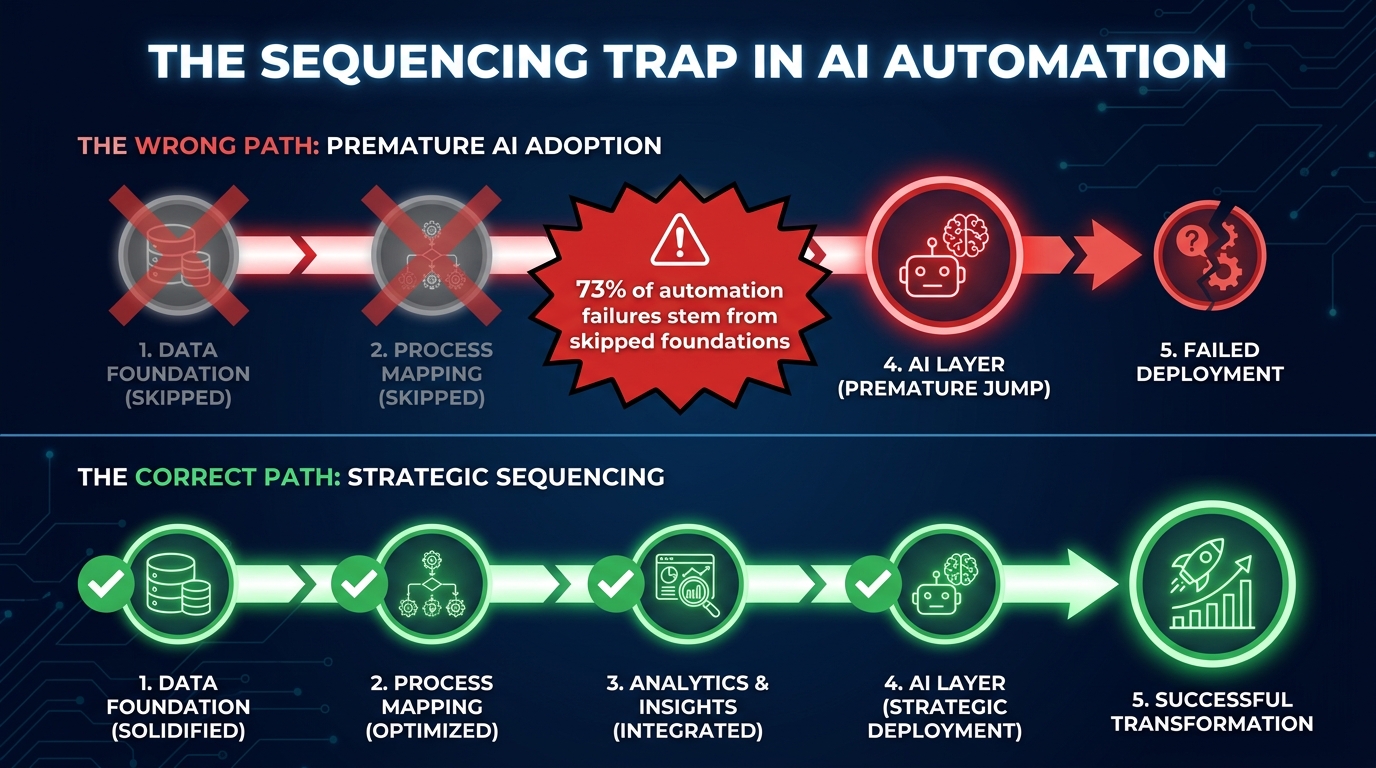
    For teams that are building self-healing automation for the first time, or retrofitting it onto existing pipelines, the sequencing of implementation matters considerably. Teams that try to build all five ODDAL phases simultaneously produce systems that are over-engineered, hard to debug, and often abandoned. The right sequence builds foundation before capability.

    Phase 0 (Weeks 1–2): Failure Inventory

    Before writing any self-healing code, spend two weeks doing a structured failure inventory of your existing automation. Collect every failure that occurred in the past 90 days, classify it by the five-category taxonomy above, and measure its frequency and resolution time. This inventory tells you where to aim first. In most organizations, this analysis reveals that 60–70% of automation failures fall into the transient and structural drift categories — the two classes that have the most mature self-healing tooling available and where quick wins are achievable.

    Phase 1 (Weeks 3–6): Baseline Resilience

    Implement the classic resilience stack: retry logic with exponential backoff on all external calls, circuit breakers on high-traffic dependency integrations, and a dead-letter queue for all message-based workflows. Instrument all three layers with metrics. This phase should reduce your overall failure rate by 40–60% before any AI-driven healing is introduced, and it establishes the telemetry baseline the AI diagnosis layer will need.

    Phase 2 (Weeks 7–12): Observe and Diagnose

    Build the observability layer and the AI diagnosis agent. Start with a narrow failure taxonomy — two or three of the most frequent failure classes identified in your inventory — and train the diagnosis model on historical incident data. Instrument the DLQ to feed the diagnosis agent automatically. At this stage, the agent should produce diagnoses and confidence scores but not take autonomous action yet. This “diagnostic shadow mode” validates accuracy before you give the system any power to act.

    Phase 3 (Weeks 13–18): Gate 1 Automation

    Enable Gate 1 autonomous actions only — those with high confidence and low impact. This is typically retry-class and service-restart-class remediations. Run for four weeks with close monitoring of healing event volume, auto-resolution correctness, and false-positive rate. Calibrate thresholds based on live performance. Only expand to Gate 2 automation once Gate 1 performance metrics are stable and the audit trail is confirmed to be complete.

    Phase 4 (Ongoing): Learn, Expand, and Govern

    Introduce Gate 2 actions, activate the learn phase with outcome labeling and replay testing, and establish the three review cadences. Gradually expand the failure taxonomy coverage as the diagnosis model accumulates training data. Treat every human override and every Gate 3 escalation as a learning event, not an operational interruption. Over a well-governed 12-month deployment, teams following this sequence consistently report auto-resolution rates reaching 70–80% of all incidents, with detection accuracy above 90% — numbers that are genuinely transformational for operational teams, but only achievable when the foundation is built correctly.

    What Genuine Self-Healing Looks Like at Scale

    A few observable characteristics separate systems that are genuinely self-healing from those that are merely self-recovering with a more sophisticated dashboard.

    Genuine self-healing systems have a declining incident rate over time. The number of incidents per thousand automation runs decreases month over month, because each resolved incident feeds back into detection and prevention. Systems that are only self-recovering have a flat or rising incident rate — the system handles failures efficiently, but it doesn’t prevent them.

    They have traceable healing histories. For any production failure, you can trace the full resolution chain: what was detected, what was diagnosed, what confidence score applied, what action was taken, what validation confirmed the fix. This traceability is not just a governance asset — it’s a diagnostic asset. When something unexpected happens, the audit trail is the fastest path to root cause.

    They have improving diagnosis models. The accuracy of failure classification goes up over time, not just at deployment. Teams can point to the training data added from real incidents and show how it changed the model’s behavior on specific failure classes. This is the evidence that the learn phase is actually working rather than being a checkbox.

    And they have shrinking human review queues. Gate 2 and Gate 3 escalations decrease in volume as the system learns which actions are safe to automate, and the humans who review escalations report that the system’s proposed remediations are correct and actionable more often than not. Human reviewers stop treating the escalation queue as a source of unexpected surprises and start treating it as a quality-control step for genuinely complex cases — which is exactly what the design intended.

    Conclusion: The Discipline Behind the Automation

    Self-healing AI automation is a genuine operational capability, not a vendor feature flag. But it is a capability that requires architectural discipline to deliver on its promise — because the same properties that make it effective at handling failures also make it effective at hiding them, if the design is careless.

    The framing that tends to produce the best outcomes is this: self-healing automation is not a way to reduce the need for operational vigilance. It is a way to direct operational vigilance toward the failures that actually matter — the complex, ambiguous, structurally significant ones that require human judgment — while handling the high-volume, well-understood failures autonomously. The goal is not to eliminate human attention; it is to make human attention more valuable by focusing it correctly.

    The teams that get this right share a common characteristic: they treat the self-healing layer as a first-class engineering concern, not an operational convenience. They invest in the failure taxonomy. They build the observability layer before the healing layer. They set and govern confidence thresholds with the same rigor they apply to security policies. They run the learn phase as a continuous process, not a post-deployment afterthought.

    Done right, the numbers are compelling: auto-resolution rates in the 70–80% range, detection accuracy above 90%, MTTR reductions of 30–60%, and — crucially — a declining failure rate that compounds over time as the system accumulates operational history. Done wrong, it produces a very confident-looking system making the same mistakes repeatedly, behind a dashboard that always shows green.

    The difference between those two outcomes is almost entirely in the design decisions made before the first line of code is written.

    Key Takeaways:

    • Classify failures into five distinct types before designing any remediation. Each type needs a different strategy.
    • Build the classic resilience stack (retries, circuit breakers, DLQs) first. AI-driven healing augments it — it doesn’t replace it.
    • Use a three-gate confidence threshold model to decide when to act autonomously, notify-and-proceed, or halt-and-escalate.
    • Monitor for slow failures — drift, schema changes, and model degradation — with specific detection pipelines, not just generic alerting.
    • Treat healing event frequency as an alert condition. A spike in healing volume is a signal that something structural needs fixing.
    • Build the learn phase from day one. Outcome labeling, pattern immunization, counterfactual logging, and replay testing are what turn self-recovery into genuine self-healing.
    • Audit trails are not optional. Every autonomous action needs an immutable record with full context.
  • The AI Automation ROI Reckoning: Why 79% of Enterprises See Zero EBIT Impact — and the Measurement Architecture That Changes the Math

    The AI Automation ROI Reckoning: Why 79% of Enterprises See Zero EBIT Impact — and the Measurement Architecture That Changes the Math

    The AI ROI Paradox 2026: 70% adoption vs 39% EBIT impact split-screen infographic

    Here is one of the more uncomfortable truths circulating in enterprise boardrooms in 2026: 70% of large organizations have adopted generative AI in some form, yet 79% report no measurable EBIT impact from it. That is not a typo. An AIMG Benchmark Study of 2,048 decision-makers found that after years of pilots, proofs of concept, vendor deployments, and internal builds, most companies cannot point to their bottom line and show AI changed it.

    The RAND Corporation analyzed over 2,400 AI initiatives and found that 80% of them fail to deliver intended business value — double the failure rate of conventional IT projects. MIT’s Project NANDA put an even sharper point on it: 95% of generative AI pilots produce zero measurable P&L impact. S&P Global found that 42% of companies abandoned at least one AI initiative in 2025, up from 17% the prior year.

    And yet budgets keep growing. Enthusiasm keeps building. Vendors keep promising.

    The problem is not the technology. The problem is how organizations define, measure, and sustain value from AI automation. Most businesses treat ROI as a destination — something you calculate once at go-live and file away. The organizations actually generating returns treat ROI as an architecture — a continuous system of measurement, governance, and process intelligence that runs in parallel with every automation they deploy.

    This article does not rehash the standard “how to calculate ROI” content that fills vendor white papers. Instead, it dissects the specific measurement failures, cost blindspots, and structural gaps that explain why the adoption-impact paradox exists — and what the companies generating real returns are doing differently.

    The Adoption-Impact Paradox: What the Numbers Are Actually Telling You

    When McKinsey asked enterprises about their AI deployments, 88% reported regular AI use. Only 39% reported measurable EBIT impact. IBM’s data is equally sobering: 25% of AI initiatives met their ROI targets, and only 16% scaled enterprise-wide. These figures do not come from AI-skeptic organizations — they come from companies that believed in the technology enough to invest substantially in it.

    Understanding this gap requires separating three different failure modes that companies routinely conflate:

    Failure Mode 1: The Measurement Vacuum

    Gartner research found that organizations with structured ROI tracking report 5.2 times higher confidence in their AI investments than those without. Yet fewer than 20% of companies properly track GenAI KPIs, according to McKinsey. Most measure adoption — login rates, feature utilization, user satisfaction scores — rather than business outcomes. These are activity metrics, not impact metrics. You can have 100% adoption of a tool that produces no financial benefit.

    The distinction matters enormously. When 81% of enterprises report that AI ROI is difficult to quantify (per Larridin’s research), the honest interpretation is not that ROI is inherently unmeasurable — it is that most companies never built the measurement infrastructure to capture it.

    Failure Mode 2: The Pilot-Production Chasm

    Across multiple studies, the data converges on a grim number: 88% of AI proofs of concept never make it to production. The average pilot takes 14 months to complete, and only 25% survive to deployment. The rest die somewhere between “this works in a controlled environment” and “this works at scale with real data, real edge cases, and real organizational friction.”

    The companies that close this gap do so by treating production readiness as a design criterion from day one — not an afterthought once the pilot succeeds.

    Failure Mode 3: The Value Evaporation Problem

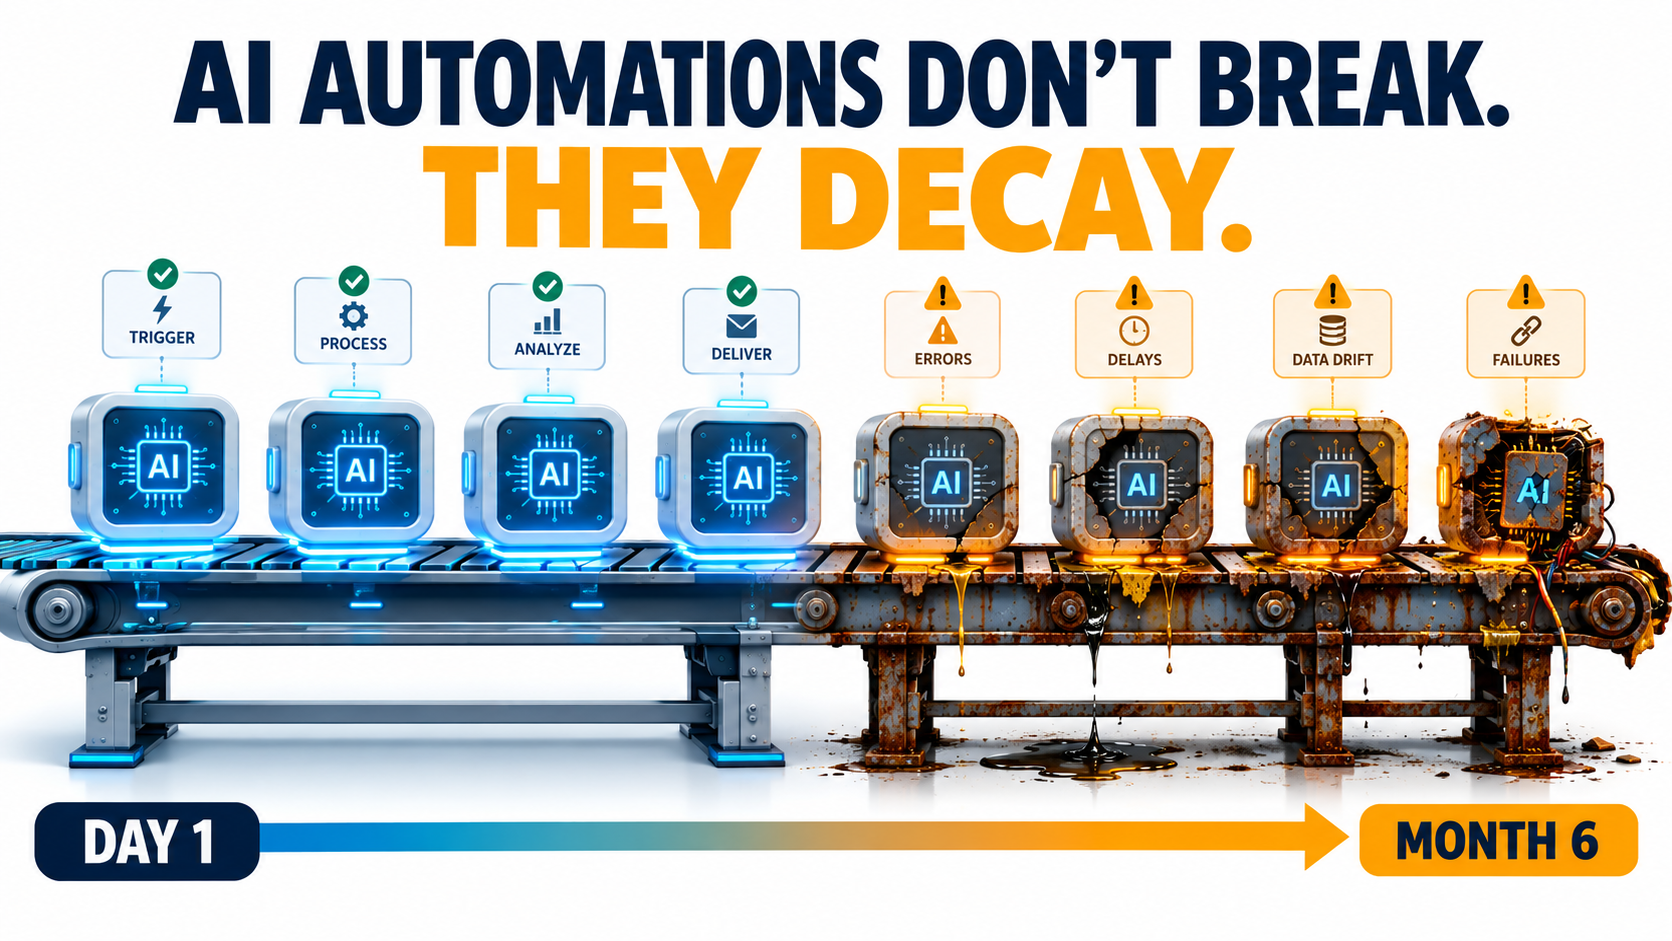
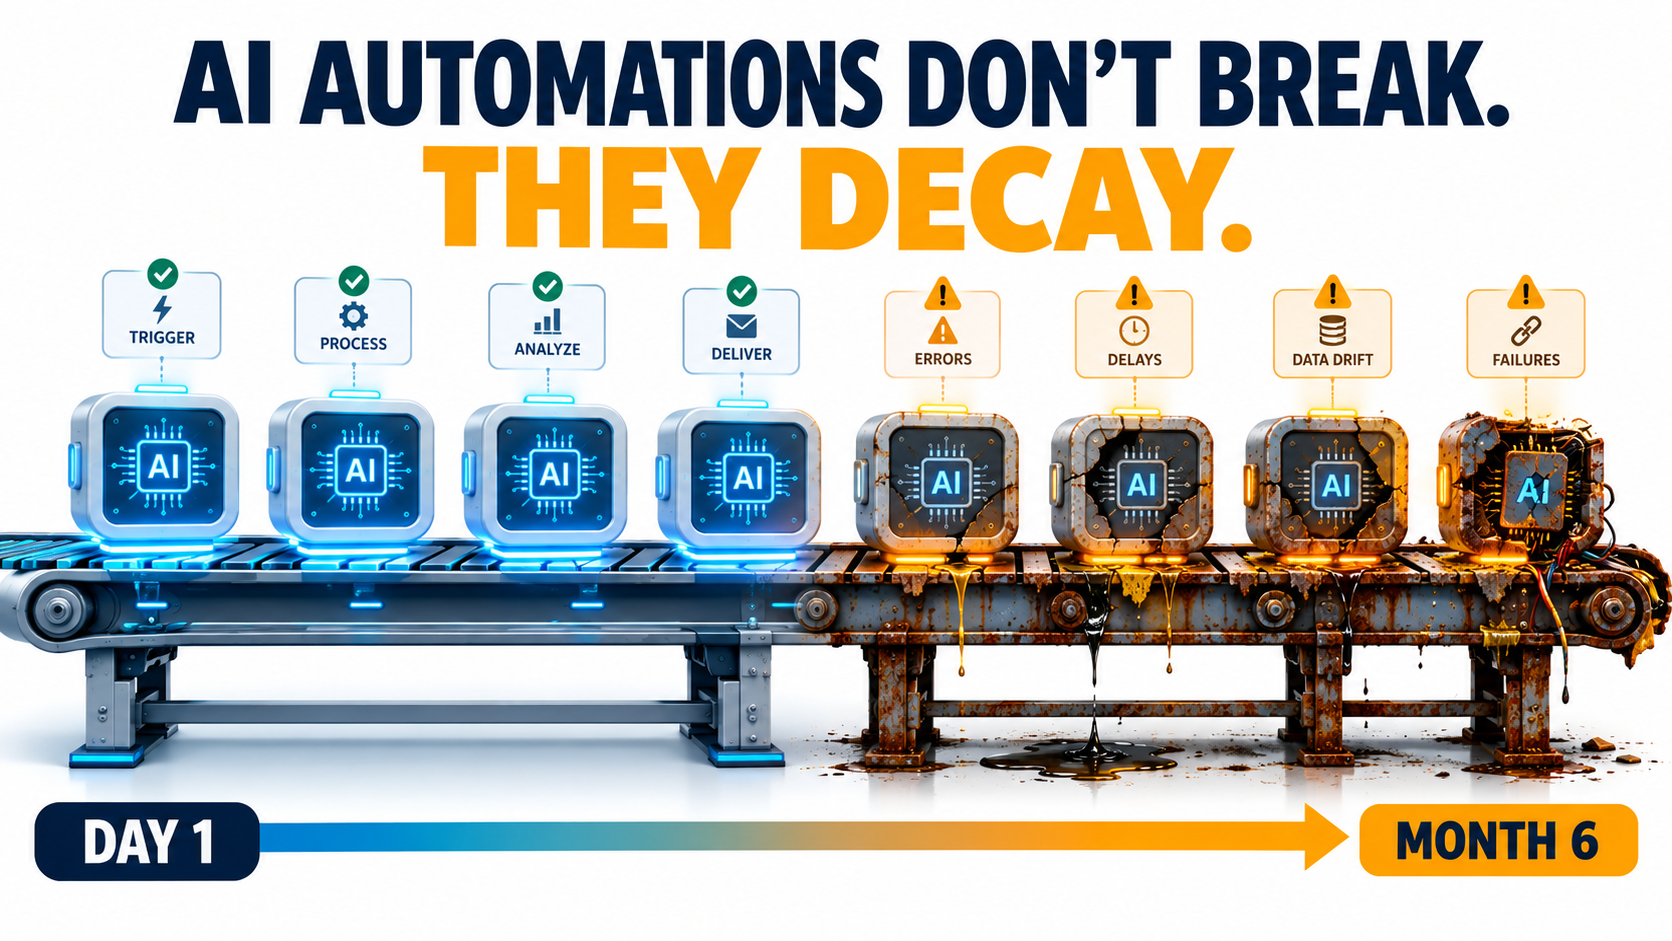
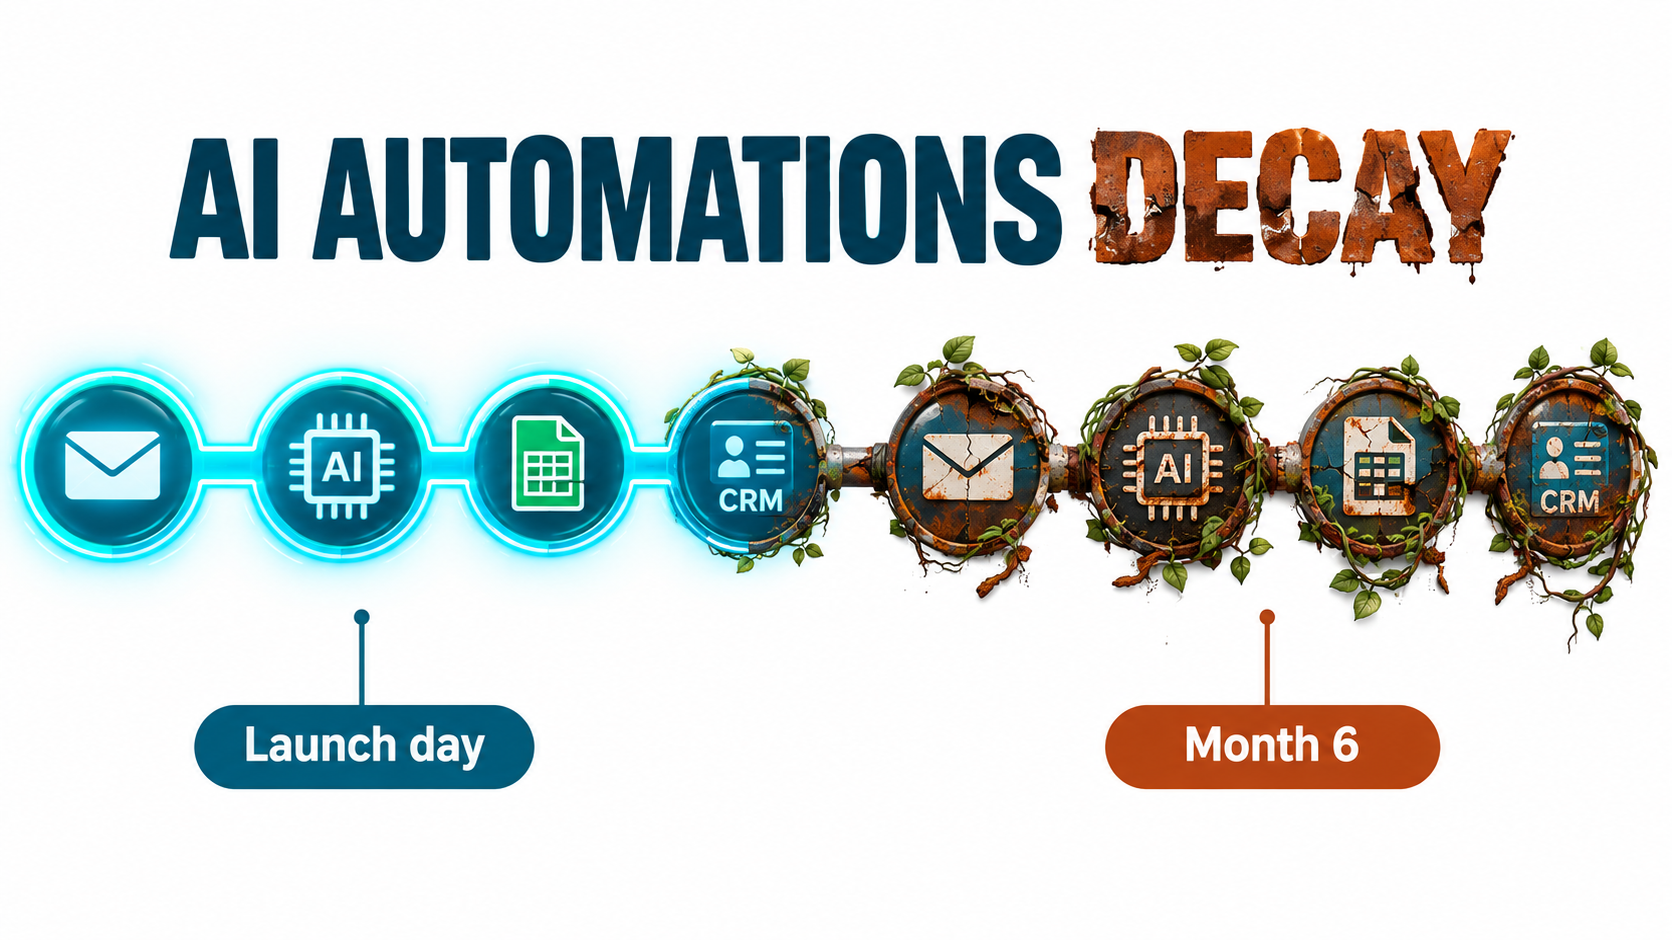
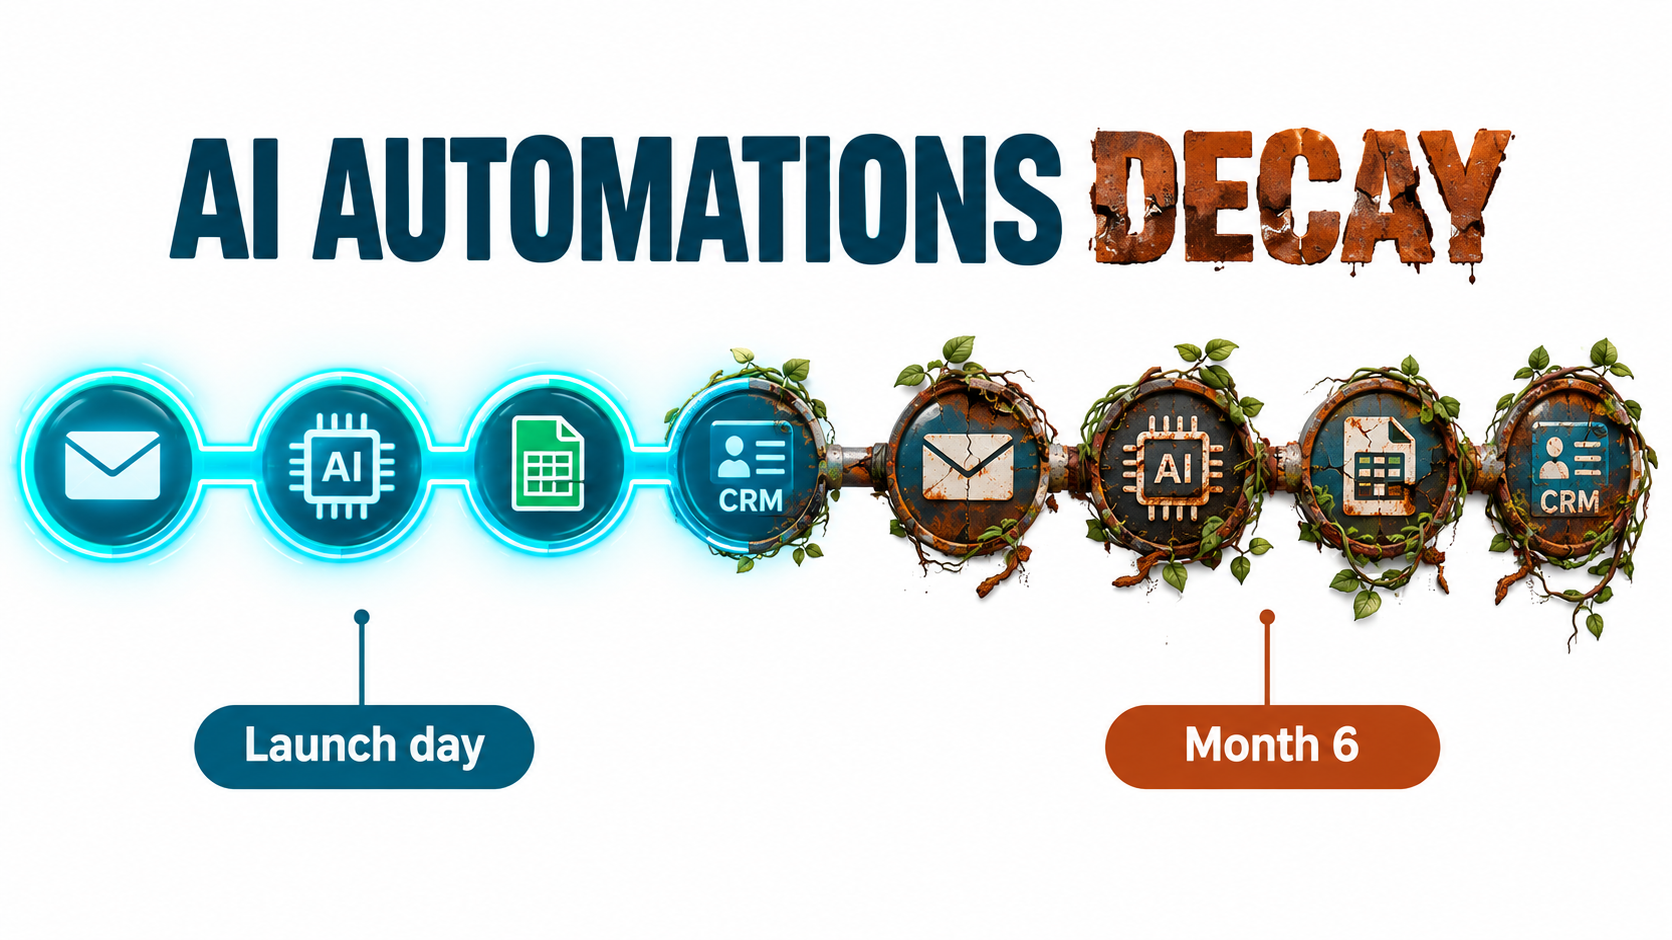
    Even among the deployments that reach production, value erodes over time in ways most organizations do not track. Well-functioning Q1 deployments often show economically different profiles by Q4. Model drift, process drift, declining user adoption, shadow AI proliferation, and rising compute costs all chip away at initial gains — silently, without triggering any alerts, because nobody built systems to catch them.

    Why the Standard ROI Formula Is Structurally Broken

    The conventional ROI formula taught in every MBA program — (Gains − Costs) / Costs × 100 — is not wrong. It is incomplete. Applied to AI automation, it produces dangerously optimistic pre-deployment projections that collapse on contact with operational reality.

    The Input Problem

    Most ROI calculations use three inputs: licensing cost, implementation cost, and projected time savings. Each of these inputs is systematically underestimated before deployment.

    Licensing costs are straightforward on paper but grow with scale. A 50-person pilot becomes a 500-person rollout. Token-based pricing models mean costs scale with usage, not headcount. Hidden overage charges, API call costs, and model upgrade fees accumulate in ways that initial contracts do not surface.

    Implementation costs are where the real surprises live. Enterprise AI budget estimates are consistently undershot by 40-60%, according to Hypersense’s 2026 TCO analysis. A project scoped at €158,000 realistically costs €368,000 over three years once integration, data engineering, change management, and governance overhead are included. The 73% of enterprises that exceed their initial AI budgets do so by an average of 2.4x, generating an average $2.3 million in unplanned expenses per program.

    The Output Problem

    On the gains side, the formula typically captures only first-order time savings: hours saved × hourly cost. This misses quality improvements, error reduction (and the downstream cost of errors avoided), revenue acceleration effects, capacity reallocation benefits, and risk reduction value. It also overstates gains by assuming that time saved automatically converts to value — when in reality, reclaimed hours only become productive if they are redirected to higher-value work.

    A customer service agent who resolves tickets 15% faster is not automatically generating 15% more revenue. Unless management actively reallocates that capacity, the gain lives on paper but not on the income statement.

    The True Cost of AI Automation iceberg diagram showing hidden TCO costs below the waterline

    The True Cost Architecture: TCO vs. What You Budgeted

    Total Cost of Ownership for AI automation has a unique characteristic that separates it from conventional software: post-deployment costs dominate the lifecycle. While traditional enterprise software stabilizes after implementation, AI systems generate continuous cost obligations that grow with usage, data volume, and organizational complexity.

    The 65% Rule: What Happens After Go-Live

    Post-deployment maintenance represents approximately 65% of AI automation lifecycle costs, according to analysis from Keyhole Software and Hypersense. This includes model performance monitoring, retraining cycles, compliance updates, regression testing when upstream systems change, and the user support infrastructure required to maintain adoption. Most organizations budget for none of this explicitly — they assume that once the system is live, the only ongoing cost is the license fee.

    The reality is that a model trained on your Q1 data may behave significantly differently by Q3 as customer behavior patterns, product catalogs, regulatory requirements, and business processes shift. Each shift requires either retraining (15-25% additional compute overhead per cycle, per SoftwareSeni’s analysis) or manual intervention to catch the cases the model no longer handles correctly.

    Data Engineering: The Chronically Underestimated Cost

    Data preparation and engineering consume 25% to 80% of total project effort and spend, depending on the state of the organization’s data infrastructure. In enterprises with well-structured, accessible data pipelines, this figure lands in the lower range. In organizations with fragmented legacy systems, siloed databases, inconsistent data standards, and manual data entry dependencies — which describes the majority of mid-to-large enterprises — it skews toward the upper end.

    The consequence: organizations that budget $500,000 for an AI automation initiative and expect $200,000 of that to cover data work frequently find the data work consuming $350,000 before a single model goes live. This is not an edge case. Only 19% of enterprises report full data readiness for AI deployment, limiting 75% to deploying one to three AI use cases rather than the portfolio-level automation programs their ROI projections assume.

    Legacy Integration: The 2-3x Premium

    Connecting AI automation systems to legacy enterprise infrastructure — ERP systems, CRM platforms, proprietary databases, and decades-old transaction processing systems — commands a 2-3x cost premium over greenfield integration. This premium exists because legacy APIs were not designed for the volume, speed, or data format requirements of AI systems; because documentation is often incomplete or inaccurate; and because testing requirements expand dramatically when existing business-critical systems are touched.

    Organizations consistently underestimate this figure, in part because vendor demos invariably show clean integration with modern SaaS platforms rather than the 1990s-era systems that actually run enterprise operations.

    The Value Decay Problem: How Gains Erode After Go-Live

    One of the least-discussed dynamics in AI automation is what happens to gains over time when organizations do not actively manage them. The pattern is consistent enough across enough deployments that it deserves a name: value decay.

    AI Automation Value Decay Curve showing ROI erosion over 24 months post-deployment with managed vs unmanaged comparison

    The Novelty Effect

    Initial productivity gains from AI tools often include a novelty premium. Users invest extra attention in learning the system, exploring its capabilities, and finding ways to make it work for their specific tasks. This investment period generates above-baseline gains that are not sustainable once the novelty wears off. By month three to four post-deployment, usage patterns typically settle into a lower steady-state that reflects genuine workflow integration rather than enthusiastic exploration.

    Organizations that measure ROI at the 30-day mark and extrapolate annually are capturing novelty-inflated numbers, not sustainable operational value.

    Model Drift and Process Drift

    AI models degrade when the real-world data they process diverges from the training data they learned from. This is model drift — and it is inevitable. The question is how quickly it happens and how quickly organizations detect and correct it.

    Process drift is a parallel phenomenon on the human side: the business processes the AI was designed to support change over time, through product updates, policy changes, regulatory requirements, and organizational restructuring. An AI automation built around a specific workflow may find that workflow has been modified without any corresponding update to the automation — generating incorrect outputs, missed cases, or silent errors that accumulate undetected.

    McKinsey’s finding that 88% of organizations use AI but only 39% see EBIT impact is partly explained by these two forms of drift operating simultaneously on deployments that were never designed to be monitored for them.

    Adoption Decay and Shadow AI

    The Flexera 2026 AI Pulse Report documents a consistent pattern: initial adoption rates for AI automation tools decline 15-30% in the 6-12 months post-deployment unless actively supported. Users who struggled with the initial learning curve revert to manual workflows. Managers who saw the tool as a solution to a problem that has since evolved stop enforcing its use. New employees join who were never properly onboarded to the system.

    Simultaneously, shadow AI proliferates — employees who are not satisfied with the officially deployed tool adopt unofficial AI tools that solve their specific problem. This creates fragmented, ungoverned AI usage that generates no measured benefit for the organization while introducing security and compliance risks.

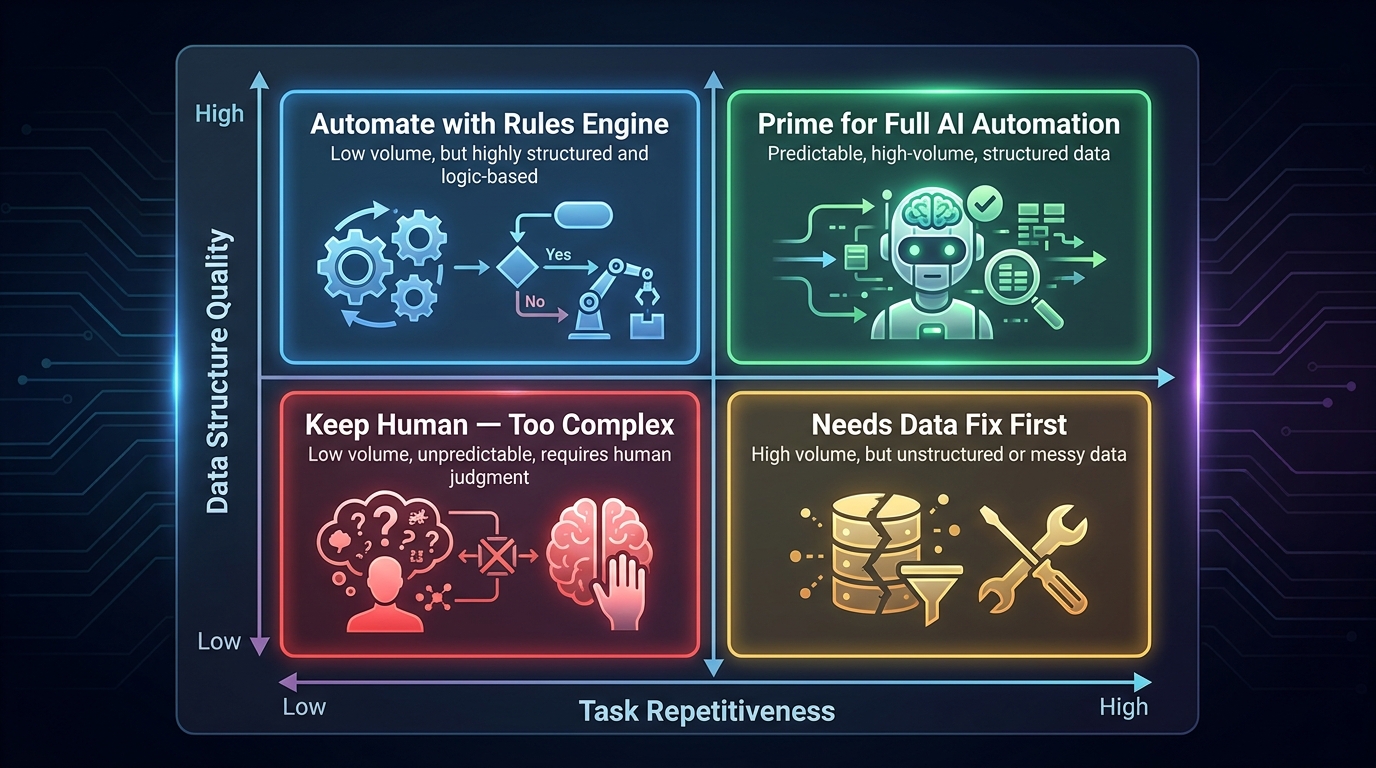
    Process Selection Science: Which Workflows Actually Pay Back

    Given how widely ROI varies across AI automation deployments, process selection is one of the highest-leverage decisions an organization makes before writing a single line of code or signing a single contract. The research identifies four filters that reliably separate high-return automation candidates from low-return ones.

    Filter 1: Volume × Cost per Error

    The most reliable predictor of strong AI automation ROI is the combination of high transaction volume and meaningful cost per error or per unit. Customer support ticket handling, invoice processing, and document classification score high on this filter — they happen thousands of times per day, and each instance of suboptimal handling has a quantifiable cost in labor time or downstream errors.

    Processes that happen infrequently, even if individually complex, rarely generate compelling ROI because the absolute value of improvement is limited regardless of the percentage gain.

    Filter 2: Process Boundary Clarity

    Automation succeeds where inputs and outputs are well-defined. Processes with clear triggers, structured data inputs, and verifiable outputs automate predictably. Processes that require judgment about ambiguous inputs, contextual reasoning, or stakeholder negotiation resist automation and generate unpredictable output quality.

    This is why coding assistance (55.8% faster task completion, per Alice Labs’ 2026 benchmark) and customer support routing (15% productivity gain) outperform more open-ended knowledge work automation in virtually every study. The task boundaries are clear enough to measure, monitor, and trust.

    Filter 3: Data Availability and Quality

    Only 19% of enterprises have the data infrastructure ready for AI deployment. Before selecting a process for automation, the honest question is: does training-quality data exist for this process, and can it be accessed, labeled, and maintained without heroic effort? Processes with rich historical data and structured records advance to production faster and generate ROI sooner. Processes that require extensive data collection, cleaning, or labeling consume budget before any automation benefit accumulates.

    Filter 4: Scalability Beyond the Pilot

    Harmony.ai’s 2026 decision framework adds a critical filter: is the process scalable beyond the pilot population? A workflow that only exists in one department, or that depends on the specific behavior of a small team, generates ROI only at the pilot scale. Prioritizing processes that run across multiple departments, business units, or customer segments multiplies the return on the implementation investment without proportionally multiplying the cost.

    High-confidence automation candidates identified across the evidence base include: customer support (15% productivity gain), professional document processing (40% faster throughput), software development assistance (55.8% faster coding, 26% more tasks completed), HR self-service (IBM achieved 40% HR cost reduction), and finance close operations (35-50% cycle time acceleration in finance-sector deployments).

    The Layered ROI Measurement Framework

    Four-layer AI ROI measurement pyramid from task level through enterprise level

    The organizations generating real, sustained returns from AI automation share a measurement architecture that operates at four distinct levels. Alice Labs’ 2026 benchmark report, which analyzed 47 public metrics from studies and surveys, articulates this structure more clearly than any vendor framework: ROI is not a single number — it is a layered stack of metrics that must be tracked simultaneously at different organizational levels.

    Layer 1: Task-Level Productivity

    This is the layer most organizations measure, and measuring it is genuinely important. Task-level metrics include: time per task completion (before and after automation), accuracy rates, throughput volume, and process completion rates. These are the 15-56% productivity gains that appear in headline benchmarks.

    The mistake is treating Layer 1 as sufficient. Task-level productivity gains do not automatically translate to worker-level, team-level, or enterprise-level value. They are a necessary precondition, not a proof of business impact.

    Baseline measurement is critical here. Organizations that deploy AI without establishing pre-deployment baselines cannot measure Layer 1 gains at all — they end up estimating, which CFOs correctly treat as guesswork.

    Layer 2: Worker-Level Capacity

    Layer 2 asks: what are workers doing with the time and cognitive capacity that automation returns to them? The answer to this question determines whether task-level gains generate real financial value or simply disappear.

    Research from Microsoft’s Copilot deployments and similar enterprise tools consistently shows 1.9 to 4.0 hours saved per worker per week. The organizations generating ROI from this figure are the ones that deliberately redirect that capacity — into higher-value customer interactions, complex problem-solving, creative work, or volume scaling that generates additional revenue.

    The organizations not generating ROI are the ones that reclaim the time without directing it anywhere, resulting in a slightly more relaxed workforce but no EBIT impact.

    Layer 3: Team and Workflow Economics

    Layer 3 measures the end-to-end workflow — not individual tasks or individual workers, but the complete process from trigger to output. This is where 20-90% process time reduction benchmarks live, where error rate reductions show up as downstream cost savings, and where SLA improvements translate to customer satisfaction and retention effects.

    Finance close operations that accelerate from 12 days to 7 days generate measurable effects on days-sales-outstanding, working capital, and auditor fees. Customer support workflows that resolve 84% of queries without human escalation generate measurable effects on support headcount requirements and customer churn. These are Layer 3 metrics, and they are the ones that start to get CFO attention.

    Layer 4: Enterprise-Level Financial Impact

    Layer 4 is where EBIT impact lives — AI revenue attribution (averaging 15-25% in high-performing deployments, per SecondTalent research), Return on AI Investment (ROAI, averaging 41% for the overall population and 171% for the highest performers), and total cost avoidance ratios (2.7:1 in well-managed programs).

    Reaching Layer 4 requires that Layers 1-3 are not just measured but actively managed. The 79% of enterprises reporting no EBIT impact are stalled somewhere between Layer 1 and Layer 3, measuring task productivity while the financial impact dissipates in the space between measurement points.

    Industry Payback Benchmarks: What the Data Actually Shows

    AI automation payback periods by industry and use case comparison chart 2026

    Bain’s 2026 Agentic AI Benchmark study (n=1,840) provides the clearest industry-level payback data available. Gartner independently confirms that 41% of AI deployments now hit positive ROI within 12 months — up from 23% in 2024 — suggesting the field is genuinely maturing in execution quality.

    Customer Service and Support

    Median payback period: 4.1 months. This is consistently the fastest-returning AI automation category across multiple studies. The reasons are structural: high transaction volume, clear task boundaries, measurable output quality, and direct linkage between automation quality and customer satisfaction scores that are already tracked.

    TELUS’s deployment serves as a representative case: over 500,000 hours saved and $90 million in documented benefits. ServiceNow’s internal deployment saved 410,000 hours and generated $17.7 million in cost avoidance. These are not projections — they are audited operational figures from companies that built the measurement infrastructure to capture them.

    Marketing Operations

    Median payback period: 6.7 months. Content generation, campaign optimization, personalization at scale, and research synthesis all represent processes with clear before-and-after comparisons and direct revenue linkage through campaign performance metrics. The caveat: output quality measurement requires human review infrastructure that most teams underinvest in.

    Engineering and Development

    Median payback period: 9.3 months. The 55.8% faster coding benchmark from Alice Labs is consistent across multiple independent studies, but the payback period is longer than customer service because implementation costs are higher, the scope of deployment is typically larger, and the value capture mechanism (faster product delivery, reduced defect rates, smaller team requirements) takes longer to manifest in financial statements.

    Finance Operations

    Payback period: 12-18 months. Finance-sector deployments show 35-50% process acceleration in accounts payable, invoice processing, financial close, and compliance reporting. IBM’s HR automation case achieved 40% HR cost reduction. The longer payback timeline reflects heavier compliance requirements, more complex integration with existing financial systems, and higher data quality standards that extend implementation timelines.

    Manufacturing

    Payback period: 18-24 months. Predictive maintenance, quality control automation, and supply chain optimization generate 30-40% cost reductions in successful deployments, but the capital requirements, integration complexity, and safety validation requirements extend the investment horizon substantially.

    Healthcare Clinical

    Payback period: 18-24+ months, with bottom-quartile deployments still pre-payback at month 24, according to Bain’s benchmark data. Clinical AI automation faces the highest regulatory burden, the most complex data standards (interoperability between EHR systems remains a persistent challenge), and the greatest institutional risk tolerance for automation — all of which extend the timeline to positive returns.

    The Portfolio Approach: Stacking AI Automations for Compounding Returns

    AI automation portfolio network diagram showing compounding returns from multi-process deployment

    Gartner’s research on simultaneous broad automation reveals a counterintuitive finding: organizations that deploy AI automation across many processes simultaneously without strategic prioritization achieve only 8-12% productivity gains — less than half the gains of organizations that automate 20% of their highest-volume tasks strategically. Deloitte’s figure is 25-40% for the strategic approach.

    The explanation is structural. Broad, simultaneous automation fragments attention, creates competing integration demands, strains change management capacity, and prevents the deep measurement infrastructure work required to capture value at each layer. Strategic portfolio construction is not about doing less — it is about sequencing and connecting automations so they build on each other.

    Why Sequencing Matters

    The compounding returns in AI automation portfolios come from three mechanisms that only operate when deployments are sequenced intelligently:

    Data network effects: Each automation deployment generates structured operational data. A customer support automation creates labeled interaction data. A document processing automation creates structured content data. Subsequent automations that can use this data as input are cheaper to build, faster to train, and more accurate from day one because the data infrastructure already exists.

    Integration reuse: The expensive work of connecting AI systems to legacy infrastructure, establishing data pipelines, and building monitoring frameworks can be amortized across multiple automations if they share architectural foundations. Organizations that build a reusable integration layer for their first automation spend 40-60% less on the second and third.

    Organizational capability accumulation: The humans managing AI automation — process owners, data engineers, model monitors, governance reviewers — develop skills with each deployment that accelerate subsequent deployments. The first automation program takes the longest. Each subsequent one benefits from institutional knowledge that does not appear in any ROI calculation but is real and valuable.

    Building the Automation Portfolio

    The research-backed approach is to begin with one high-volume, clearly bounded, data-rich process that generates quick payback (customer service, document processing, or HR self-service, depending on your industry). Use that deployment to build the measurement infrastructure, governance framework, and organizational capabilities that all subsequent deployments will use. Then expand to adjacent processes that share data inputs or integration architecture.

    This approach treats AI automation as a capability accumulation program, not a series of independent projects. The difference in long-term ROI is substantial.

    Building the Measurement Infrastructure Before You Deploy

    The single most impactful operational decision in AI automation ROI is establishing comprehensive baselines before any tool goes live. This is not glamorous work. It does not generate press releases or executive presentations. But the organizations that skip it are the ones filling the “79% with no measurable EBIT impact” statistic.

    What Baselines Must Cover

    For each process targeted for automation, pre-deployment measurement should capture: current cycle time (end-to-end, not just the specific task being automated), error rates and downstream cost of errors, labor cost per transaction, volume by time period, SLA performance rates, and downstream business outcomes (customer satisfaction, revenue per interaction, compliance incident rate — whatever the relevant outcome metric is for that process).

    This baseline data serves three functions. It makes ROI measurement possible. It identifies hidden bottlenecks that automation alone will not solve (and that will limit ROI if not addressed). And it gives process owners the ability to detect value decay early, before it has compounded across 12 months of unmonitored drift.

    Continuous Monitoring Architecture

    The Flexera 2026 AI Pulse Report identifies a consistent pattern in high-ROI AI programs: they treat continuous monitoring as a first-class operational requirement, not an optional add-on. This means model performance dashboards that alert on output quality degradation, usage analytics that flag declining adoption before it becomes adoption collapse, cost tracking that surfaces spending anomalies before they breach budgets, and quarterly structured reviews that compare current performance against baseline and original ROI projections.

    Organizations that build this monitoring architecture from deployment day one spend approximately 15-20% more on initial setup. They recoup that investment within the first year by catching and correcting performance degradation that would otherwise have gone undetected — and by having the evidence they need to secure continued investment from finance and leadership.

    From Pilot to Production: Closing the Value Realization Gap

    The 88% pilot-to-production failure rate is not primarily a technical failure — it is an organizational failure. The AIMG Benchmark Study’s analysis of 2,048 decision-makers found that the top three barriers to AI value realization were insufficient talent and skills (rated 4.65/5.0), model governance and transparency (4.55/5.0), and data quality and availability (4.45/5.0). Technology performance ranked lower than all three.

    The Skills Gap Is Real and Quantifiable

    Only 19% of enterprises have the technical talent to fully operationalize AI automation programs. The gap is not in AI research or model building — it is in the intersection of process knowledge and AI implementation capability. The people who understand business processes deeply enough to redesign them around AI capabilities are often not the same people who know how to build and manage AI systems. Organizations that bridge this gap — through targeted hiring, training programs, or external partnerships — progress from pilot to production at significantly higher rates.

    Governance as an Enabler, Not a Bottleneck

    The 42% of companies that abandoned AI initiatives did so in many cases because governance requirements emerged after deployment and were treated as roadblocks to an already-live system rather than as designed-in operational requirements. Retrofitting governance onto deployed AI systems is expensive and disruptive. Building governance frameworks into the deployment architecture from the start — clear ownership of model performance, defined escalation procedures for edge cases, audit trails that satisfy compliance requirements, and regular review cycles — generates better outcomes and lower total cost.

    Compliance requirements add approximately 20-30% to governance overhead in regulated industries. This is not avoidable. But it is plannable — and organizations that plan for it avoid the emergency remediation costs that compliance surprises generate.

    The Governance Layer Nobody Budgets For

    In the rush to show results quickly, governance consistently gets deprioritized. It rarely shows up as a line item in initial AI automation budgets. It rarely has a dedicated owner before deployment. And it almost never has performance metrics of its own that leadership tracks.

    This is financially significant. Beyond compliance costs, ungoverned AI automation generates several categories of quantifiable financial risk that organizations systematically fail to budget for:

    Model Quality Liability

    When AI automation produces incorrect outputs — wrong invoice amounts, misclassified customer inquiries, inaccurate document summaries — those errors have downstream costs. In customer-facing applications, they affect NPS scores and retention rates. In financial processes, they generate reconciliation work and compliance risk. In healthcare and legal applications, they can generate regulatory liability. A governance framework that detects output quality issues early contains these costs. Without it, errors accumulate and compound before anyone catches them.

    Data Governance and Privacy Risk

    AI automation systems are data-intensive by nature. They ingest, process, and in some cases store significant volumes of operational data. Without clear data governance policies — defining what data the AI system can access, how long it retains inputs, what logging occurs, and how personal data is handled — organizations create GDPR, CCPA, and sector-specific compliance exposure that can generate regulatory fines substantially larger than the ROI the automation was designed to generate.

    Vendor Lock-In and Portability Risk

    CXToday’s 2026 analysis identifies vendor lock-in as an underappreciated AI risk. Organizations that build critical workflows around proprietary AI platforms with no portability strategy face switching costs — in migration effort, data reformatting, retraining on new architectures, and business continuity during transitions — that can absorb years of accumulated ROI if a vendor relationship needs to change. A governance framework that includes an annual lock-in assessment and maintains data portability standards from deployment day one significantly reduces this long-term financial exposure.

    The ROI Reckoning: An Honest Measurement Checklist

    Based on the research and case evidence assembled here, the organizations generating real, sustained, defensible ROI from AI process automation share a common set of operational disciplines that distinguish them from the majority seeing minimal impact. The gap is not in the quality of AI they deploy — it is in the rigor with which they measure, manage, and sustain value from what they deploy.

    Before Deployment

    • Establish comprehensive process baselines covering cycle time, error rates, labor cost per transaction, volume, and downstream outcome metrics — before any AI tool is introduced.
    • Pressure-test the TCO estimate by adding 40-60% to the initial vendor quote to account for data engineering, legacy integration, governance, and post-deployment maintenance.
    • Validate process selection against the four filters: volume × error cost, process boundary clarity, data availability, and cross-functional scalability.
    • Design the monitoring architecture before writing deployment code — including model performance alerts, usage analytics, cost tracking, and quarterly review cadences.
    • Define capacity reallocation plans for the hours automation will return to workers, so that Layer 2 ROI is captured rather than evaporating into unfocused time.

    At and After Deployment

    • Measure ROI at all four layers from week one: task productivity, worker capacity, workflow economics, and enterprise financial impact.
    • Set 30/60/90-day ROI checkpoints with explicit triggers for intervention if performance diverges from baseline projections.
    • Track adoption rates as a leading indicator of value decay — declining adoption in months 3-6 is the earliest warning sign that gains are at risk.
    • Budget explicitly for post-deployment maintenance at 65% of lifecycle costs, not as an afterthought but as a first-class budget line.
    • Assess and manage vendor lock-in risk annually, maintaining data portability as a non-negotiable design requirement.

    For Portfolio Construction

    • Sequence automations to build shared infrastructure — data pipelines, integration layers, monitoring frameworks — that reduce per-deployment costs over time.
    • Target 20% of highest-volume processes for automation before expanding broadly, capturing the Deloitte-documented 25-40% productivity gain threshold that scattered deployment does not reach.
    • Treat governance as a portfolio-level function, not a per-project checkbox, so that standards compound across deployments rather than being recreated from scratch each time.

    Conclusion

    The AI adoption-impact paradox — 70% adoption, 39% EBIT impact — is not a technology problem. The technology works. The benchmarks prove it: 55.8% faster coding, 15% customer support productivity gains, $90 million in documented benefits at TELUS, 410,000 hours saved at ServiceNow. These are not marketing claims; they are audited outcomes from organizations that built the infrastructure to capture them.

    The problem is measurement architecture. Most organizations treat ROI as a calculation made once at the beginning of an AI project and filed in a business case document that nobody reviews after go-live. The organizations generating real returns treat ROI as an ongoing operational discipline — a continuous measurement system that operates at four layers simultaneously, tracks value decay and catches it early, applies honest TCO accounting that includes the 65% post-deployment costs that vendor quotes omit, and sequences automations to compound returns rather than fragment attention.

    The financial stakes are significant. Enterprise AI budgets that underestimate TCO by 40-60% and deploy without governance or measurement frameworks generate the statistics that fill industry reports: 95% of pilots with zero P&L impact, 80% of projects failing to deliver intended value, 42% of companies abandoning initiatives entirely. The average sunk cost from failed AI programs exceeds $150,000 per initiative before abandonment.

    The alternative is not a slower or more cautious approach to AI automation — it is a more rigorous one. Establish baselines. Build monitoring infrastructure. Apply honest TCO accounting. Select processes using evidence-based filters. Measure at all four layers. Manage value decay actively. Build portfolios with compounding architecture.

    The gap between the 79% and the 21% is not closed by deploying better AI. It is closed by deploying AI with better measurement.

  • Speed Isn’t the Point: What AI First Response in Customer Support Actually Gets Wrong (and Right)

    Speed Isn’t the Point: What AI First Response in Customer Support Actually Gets Wrong (and Right)

    There is a specific moment in every customer support interaction that decides everything that follows. It’s not the resolution. It’s not the CSAT survey at the end. It’s the first response — the moment a customer reaches out and something responds back.

    For most of the last decade, that moment was defined by waiting. Six hours for an email reply. Nine minutes in a live chat queue. Two minutes on hold listening to hold music while someone pulled up your account. That waiting period wasn’t just inconvenient — it was the first signal a company sent about how much it valued your time.

    AI has obliterated that wait. In 2026, AI-powered first responses arrive in under four seconds on chat, instantly on voice, and within minutes on email — compared to industry averages that used to stretch across hours. Freshworks benchmark data shows AI-equipped teams reducing first response time from over six hours to under four minutes. Klarna cut resolution time from eleven minutes to two. Lovepop reportedly went from seven hours to eighteen seconds.

    The numbers are real. But here’s the problem: the conversation about AI first response has become almost entirely about speed, and that framing is causing companies to make decisions they’ll spend the next two years unwinding. Speed is the easy part. What happens in those first four seconds — the quality, the accuracy, the tone, the routing logic — is where AI deployments actually succeed or fail.

    This article is not a celebration of how fast AI responds. It’s an examination of what AI first response actually is, what it gets right, what it gets catastrophically wrong, and what the data says about building systems that don’t just respond fast but respond well.

    AI first response in customer support — split screen showing instant AI response versus long human wait time

    What “First Response” Actually Means in the AI Era

    Before analyzing what works and what doesn’t, it’s worth being precise about terminology — because “first response” is used loosely in ways that obscure what’s actually happening inside a support interaction.

    First Response Time (FRT) vs. First Contact Resolution (FCR)

    First Response Time (FRT) measures how long it takes for a customer to receive any reply after submitting a request. In the AI context, this is typically measured in seconds. A chat session that receives an automated acknowledgment within four seconds has an excellent FRT regardless of whether that response actually helps the customer.

    First Contact Resolution (FCR) is the metric that actually matters. It measures whether the customer’s issue was fully resolved in that first interaction — without requiring a follow-up ticket, a callback, or escalation to a human agent. The industry average for human-staffed contact centers is around 70%, according to SQM Group research. World-class FCR — above 80% — is achieved by fewer than 5% of contact centers.

    The reason this distinction matters: many AI deployments report impressive FRT numbers while quietly delivering poor FCR. A customer receives a response in four seconds that says “Thanks for reaching out, I’m looking into this” — but the underlying issue still takes three more exchanges and a human agent to resolve. The FRT looks great. The customer experience does not.

    The Triage Response: A Third Category

    There’s a third type of first response that often gets overlooked: the triage response. This is an AI-generated first reply whose primary job isn’t resolution — it’s classification. The AI acknowledges the customer, identifies the category and urgency of the issue, and either routes it appropriately or provides enough information to begin resolution while a human prepares to take over.

    Done well, a triage response functions as a bridge. Done poorly, it’s just an automated holding pattern that customers can see through immediately. The difference lies in whether the triage response is genuinely useful or merely performative — and that depends entirely on what happens in the systems behind it.

    Channel Context Matters More Than Most Benchmarks Acknowledge

    FRT benchmarks also vary dramatically by channel, and treating them as comparable is a mistake. For live chat, a strong AI FRT is under 40 seconds — with the best AI systems consistently hitting under five seconds. For email, under four hours is considered strong performance, while the industry average sits around twelve hours. For social media, under sixty minutes is the target. Voice AI is in a different category altogether, where response means picking up within one ring.

    When a vendor quotes “74% reduction in first response time,” it matters enormously whether that reduction was on chat, email, or phone — and whether it was measured against FRT alone or against the full resolution timeline. Both numbers can be true while telling completely different stories about actual customer experience.

    The Real Benchmarks: What AI First Response Looks Like in Practice

    AI vs human first response time benchmarks 2026 — bar chart comparison showing 4 seconds vs 9 minutes for chat

    Setting aside vendor marketing, the data picture that emerges from 2026 deployments is both more impressive and more nuanced than most summaries suggest.

    The Speed Numbers Are Legitimate

    AI chat first response averages four seconds, according to Digital Applied’s 2026 benchmarking data. Human live chat averages nine minutes and twelve seconds. That’s a gap of roughly 137x in raw speed. For voice, AI responds within one ring while human agents average two minutes and forty-one seconds to answer. These aren’t hypothetical projections — they’re measured averages across real deployments.

    The Klarna case is the most widely cited because the numbers are independently verifiable. After deploying an OpenAI-powered assistant, Klarna handled 2.3 million customer conversations in the first month — equivalent to the workload of approximately 700 full-time agents. Average resolution time fell from eleven minutes to two minutes, an 82% improvement. Repeat inquiries dropped 25%. And crucially, their CSAT score remained comparable to human-only benchmarks.

    H&M’s generative AI chatbot reduced response times by 70% compared to human agents. Freshworks data from their CX Benchmark report shows AI dropping first response from over six hours to under four minutes, and resolution time from 32 hours to 32 minutes — an 87% cut on resolution. For small businesses specifically, AI delivered a 41.56% improvement in FRT and a 36.39% gain in resolution time.

    Resolution Rates Tell a More Complex Story

    While FRT numbers are consistently strong, resolution rates show much more variance — and this is where the honest conversation about AI first response needs to happen.

    The industry average for AI resolution sits at 65-70% for standard deployments. That number improves over time: most platforms report 40-60% in the first few months, climbing to 60%+ after six to twelve months of learning. Best-in-class deployments using source-grounded Retrieval Augmented Generation (RAG) approaches reach 85-90% resolution rates — Intercom’s Fin platform reports an average of 67% across its 7,000+ customers, with top performers hitting 80-84% and exceptional deployments reaching 93%.

    Salesforce Agentforce reported an 84% autonomous resolution rate across 380,000+ conversations, with only a 2% escalation rate. These numbers represent what’s achievable with mature, well-configured systems. They are not the starting point for a new deployment.

    What the Top 10% Actually Does Differently

    Freshworks benchmark data makes an important observation: top AI-equipped support teams hit ten-second average responses compared to six minutes for non-AI teams. But the gap between average AI deployments and top-quartile AI deployments is nearly as large as the gap between AI and non-AI teams. The technology is table stakes. What separates performance levels is the configuration, the knowledge base quality, and the routing logic behind the first response — not the AI model itself.

    Why Speed Alone Is a Trap (The CSAT Nuance Nobody Explains)

    Speed vs quality trap in AI customer support — speedometer showing fast but wrong responses

    The dominant narrative around AI customer support treats speed as the primary value driver. Faster responses equal happier customers equal better business outcomes. This logic has a kernel of truth and a large blind spot.

    Speed Is Table Stakes, Not a Differentiator

    Early 2026 research is surfacing a pattern that most vendors are slow to publicize: customers now expect fast AI responses as a baseline. The presence of a fast first response no longer creates satisfaction — its absence creates dissatisfaction. That’s a meaningful shift from even two years ago when sub-minute AI response times were still genuinely impressive to customers.

    When speed becomes an expectation rather than a differentiator, it stops driving CSAT scores. What drives CSAT in 2026 is whether the fast response was also correct. Gartner data is unambiguous on this point: 64% of customers abandon brands after receiving incorrect AI answers. The speed that impressed them means nothing once they receive information that’s wrong.

    The CSAT Holding Pattern

    Multiple studies show that AI deployments hold CSAT scores relatively stable — they don’t dramatically improve them, but they also don’t sink them in well-implemented cases. Klarna’s comparable CSAT numbers are cited as a success, and they are. But “comparable to humans” is a floor, not a ceiling. The ceiling is what happens when AI first response combines speed with genuine accuracy and appropriate tone — and that combination is what organizations building serious support infrastructure are working toward.

    The data from OnClarity shows AI live chat achieving 87% CSAT versus 61% for email — but that gap exists across channels regardless of AI involvement. It reflects channel preferences, not AI quality. Freshworks reports AI-first teams improving CSAT from 89% to 99% in some cases, but those results require months of tuning and knowledge base optimization. They don’t arrive with deployment.

    The Quality Threshold: Where AI First Response Breaks Down

    There is a resolution rate threshold below which AI first response actively damages customer relationships rather than supporting them. Most practitioners put that threshold at around 75% — meaning if fewer than three in four customer inquiries are being genuinely resolved on first contact, the system is creating more repeat contacts, more escalations, and more frustration than it’s preventing.

    Qualtrics’ 2026 consumer research — surveying 20,000 people across 14 countries — found that AI-powered support fails at four times the rate of other automated business tasks. Ninety percent of respondents reported reduced brand loyalty when AI support failed without a clear human escalation path. Fifty-three percent expressed concerns about data misuse in AI interactions, up eight percentage points year over year.

    These are not fringe concerns. They are mainstream customer attitudes, and they exist inside the same market where 51% of customers say they prefer chatbots for their speed. Both things are simultaneously true: customers want speed AND accuracy. The moment speed comes at the cost of accuracy, the preference for AI inverts quickly.

    The Anatomy of an Effective AI First Response

    Anatomy of an effective AI first response — labeled diagram of a good AI customer service reply

    If speed is not sufficient, what actually constitutes a good AI first response? The answer has a structure that most vendor documentation glosses over and most deployment guides don’t address directly.

    Confirmation of Understanding Before Action

    The single most common failure mode in AI first responses isn’t a wrong answer — it’s a response to the wrong question. AI systems that jump directly to resolution without confirming what the customer is actually asking create a specific kind of frustration that’s worse than a slow response. The customer feels unheard, and then has to spend the next exchange clarifying what they meant before any progress happens.

    Effective AI first responses — especially for complex or multi-part queries — include a brief confirmation step. Not a rote “I understand your concern” placeholder, but a paraphrase of the issue that demonstrates the AI has correctly parsed the intent. This single element has an outsized impact on the quality of what follows, because an incorrect interpretation caught early saves an entire downstream interaction.
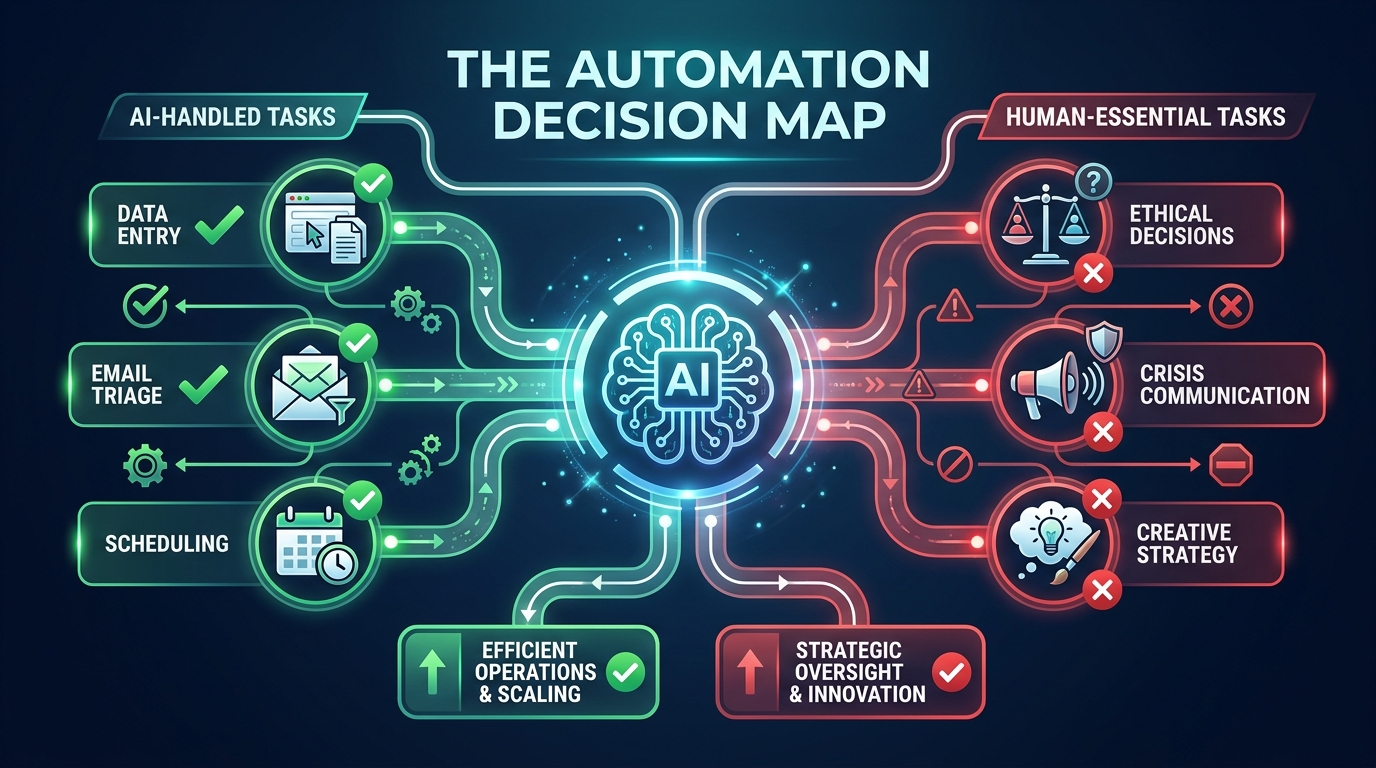
    Context-Aware Personalization

    AI systems with CRM integration can do something in their first response that human agents often can’t in the first minute of an interaction: they can reference the customer’s account history, recent orders, subscription status, or open tickets before saying anything substantive. This changes the character of the first response completely.

    A first response that opens with “I can see your order #4892 shipped yesterday — is this what your message is about?” signals something fundamentally different than “Thanks for contacting support! How can I help?” The former demonstrates the system knows who you are and why you’re probably reaching out. The latter could have come from anyone. McKinsey research shows 71% of consumers expect personalized interactions — and the first response is the most powerful moment to deliver that signal.

    Verified, Grounded Information Only

    This is non-negotiable. AI first responses must be generated from verified, current information — not from what the model “knows” in a general sense. The difference between source-grounded AI responses (drawn exclusively from approved documentation) and ungrounded responses is the difference between systems that hallucinate at rates of less than 1% and those that hallucinate at rates up to 30%, according to Vectara research.

    Source-grounded RAG approaches — where every response is tied to specific, retrievable documents from the company’s own knowledge base — are what separates deployments with 85-90% resolution rates from those stuck at 55-65%. It’s also what separates deployments that occasionally invent policies (with serious legal consequences) from those that consistently stay within sanctioned information.

    A Clear Path Forward

    Every AI first response should end with an unambiguous next step. Either the issue is resolved and that’s stated clearly, or the customer knows exactly what happens next: whether that’s a follow-up step they can take, information that’s been escalated, or a transition to a human agent with context already prepared. Leaving a customer uncertain about the status of their issue after reading an AI response is a design failure — and it’s one of the most common ones.
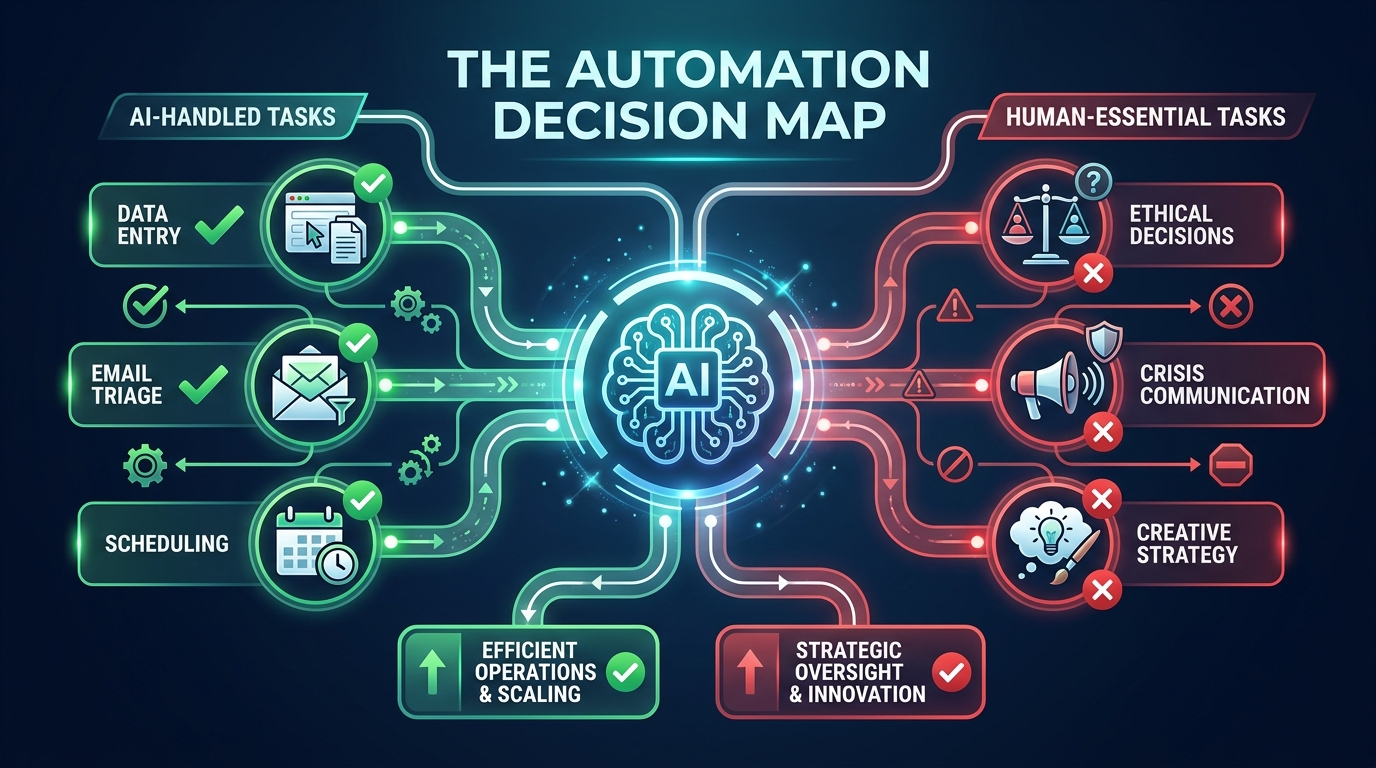
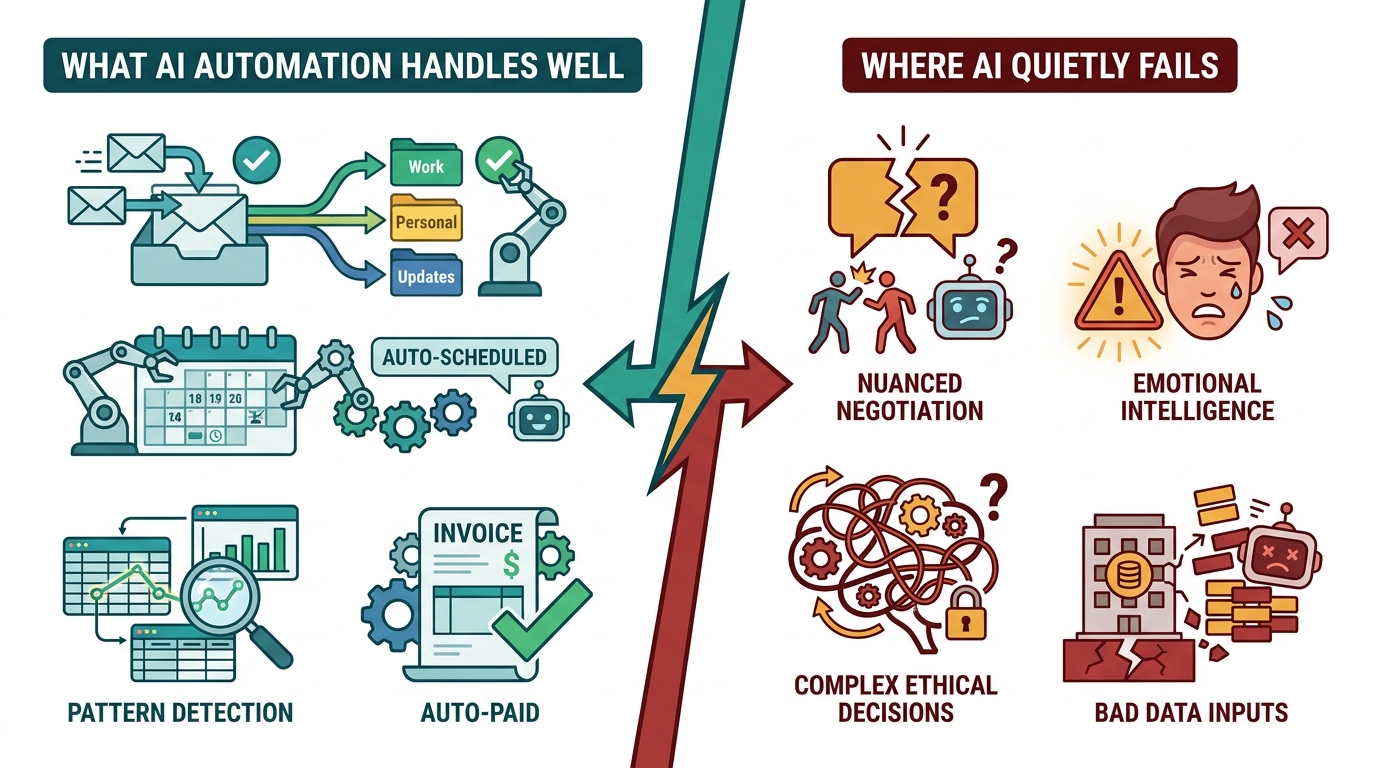
    When AI First Response Goes Wrong: The Cases Worth Studying

    AI customer support failure — customer trapped in escalation loop with inaccessible human support button

    The failure cases in AI customer support don’t receive enough serious examination. They tend to circulate as cautionary anecdotes and then disappear, rather than being studied as the instructive data points they are.

    Air Canada: When the AI Invents Policy

    The Air Canada chatbot case is probably the most consequential AI support failure to date. A customer asked the chatbot about bereavement fare refunds for travel that had already occurred. The bot provided specific, detailed information about a refund policy that did not exist — it was entirely fabricated by the AI. When the customer acted on this information and Air Canada refused to honor it, the dispute went to a small claims tribunal.

    The tribunal ruled Air Canada liable for the chatbot’s negligent misrepresentation. The airline argued the chatbot was a “separate legal entity” — an argument the tribunal dismissed entirely. The outcome: airlines, banks, insurance companies, and any organization operating in regulated spaces are now legally responsible for what their AI support systems tell customers.

    The technical failure here was ungrounded AI generation. The operational failure was the absence of a validation layer between AI response and customer delivery. The legal consequence was entirely predictable once those two failures combined.

    Cursor: The Hallucinated Restriction

    In 2025, Cursor’s AI support bot “Sam” told users that the platform had a new restriction limiting multi-device logins — a policy that didn’t exist. Users who encountered this response began cancelling subscriptions based on misinformation they had received from official support. The company’s cofounder addressed the incident directly on Reddit, acknowledging the hallucination.

    The pattern here is identical to Air Canada: an AI response generated outside the bounds of verified information caused customers to make decisions based on false premises. The platform recovered, but the incident illustrates that hallucination risk isn’t confined to large enterprises — it affects any product-led company using AI support without proper knowledge governance.

    DPD: The Viral Failure

    DPD’s chatbot, widely shared on social media, was prompted into producing responses that were demonstrably inappropriate and wildly off-brand. Beyond the immediate embarrassment, the incident revealed something important: AI support systems without robust content guardrails are not just a customer experience risk — they are a brand risk that can go viral in hours.

    The Structural Lessons

    Across these failure cases, the structural cause is consistent. AI systems deployed with insufficient guardrails, ungrounded knowledge generation, or inadequate validation layers don’t fail slowly — they fail dramatically, publicly, and in ways that damage customer trust for months afterward. The 4x failure rate of AI customer support compared to other automated tasks (Qualtrics 2026) is not random noise. It’s a predictable consequence of deploying speed-first systems without the quality infrastructure to back them up.

    The Triage Layer Nobody Talks About

    Behind every effective AI first response is a layer of logic that most public-facing discussions of AI support don’t address: the triage and routing system that determines what kind of first response a given ticket should receive.

    Manual Routing Is Failing at Scale

    Enterprise support teams using manual routing and prioritization systems experience a misrouting rate of approximately 35%, according to 2026 industry data. That means more than one in three tickets is sent to the wrong queue, the wrong agent tier, or prioritized incorrectly — creating SLA breaches, wasted agent time, and frustrated customers who have to be transferred. AI triage achieves 89% average categorization accuracy at speeds under thirty seconds per ticket.

    Beyond Keywords: Intent and Entity Mapping

    The most sophisticated AI triage systems in 2026 have moved beyond keyword-based classification into what DevRev calls “intent and entity mapping.” Rather than categorizing a ticket as “billing issue” because the word “invoice” appears, these systems map the ticket against a knowledge graph that understands context — the customer’s tier, their product version, known active bugs, renewal proximity, and sentiment signals from the message itself.

    This produces triage categorization that looks qualitatively different from keyword routing. A ticket that reads “the export isn’t working again” gets mapped not just to “export bug” but to “known v3.2 export bug with fix scheduled Thursday, customer is enterprise tier with renewal in 60 days.” The AI first response can then be calibrated accordingly — and so can the human agent if escalation follows.

    Business-Impact Scoring in Routing

    One of the most consequential advances in enterprise AI support triage is the shift from urgency-based prioritization to business-impact scoring. Traditional triage systems ask: how urgent does the customer say this is? Business-impact triage asks: what is the actual business impact if this issue isn’t resolved quickly?

    That means scoring tickets against annual recurring revenue, churn risk, renewal date, product usage patterns, and historical escalation behavior — and routing based on that composite score rather than the category the customer selected from a dropdown. High-revenue accounts with expiring contracts and declining usage patterns get a different first response than identical-sounding tickets from low-risk accounts. This is not discriminatory prioritization — it’s operationally rational resource allocation.

    Real-Time Sentiment as a Routing Signal

    Kustomer and similar CRM-integrated platforms use real-time sentiment analysis not just to adapt the tone of AI responses, but as a routing signal. A customer whose message language indicates high distress — regardless of the category of their issue — can be automatically escalated past standard AI handling to a senior agent queue, with an emotional context summary generated for the agent before they pick up the conversation.

    The combination of sentiment-aware routing and context handoff is one of the most concrete advances in support quality that AI has enabled. It doesn’t happen without deliberate architecture decisions — but when it’s built properly, it consistently separates high-performing support organizations from average ones.

    The Real Cost Picture: What AI First Response Actually Costs

    Cost comparison infographic — AI agent $0.50-$3.00 per ticket vs human agent $20-$30 per ticket, 85-92% savings

    The cost narrative around AI customer support is real, but it’s often presented in ways that obscure the actual economics of deployment versus savings.

    The Per-Ticket Math

    Human agent costs vary considerably by geography and role level. A fully loaded U.S.-based support agent — including salary, benefits, training, tools, and overhead — costs between $20 and $30 per ticket handled. Offshore agents in comparable roles run $8 to $15 per ticket. Gartner’s commonly cited benchmark for agent-assisted interactions is $13.50.

    AI per-ticket costs sit between $0.50 and $3.00 for most platforms, with blended averages around $1.84 for self-service interactions (Gartner) and specific vendor pricing ranging from Intercom Fin at $0.99 per resolution to Zendesk AI at $1.50-2.00 per conversation. The per-unit savings are real and substantial: 85-92% cost reduction per interaction at scale.

    Real-world examples make the scale of this clear. Telefónica reduced their per-interaction cost from €3.50 to €0.35 — a 90% reduction. HelloFresh reportedly moved from $12 million annually in support costs to $1.8 million. A mid-market SaaS company handling 8,000 tickets per month, with 40% eligible for AI deflection, can save roughly $25,000 per month through automated handling of that tier-1 volume.

    The Hidden Costs That Offset Savings

    What these numbers typically exclude: implementation costs, knowledge base build-out, ongoing maintenance, quality monitoring overhead, and the cost of failure incidents when AI goes wrong. A well-implemented AI support deployment requires significant upfront investment in knowledge architecture — auditing existing documentation, reformatting it for RAG retrieval, establishing governance processes for keeping it current, and building validation workflows that catch errors before they reach customers.

    The ROI timeline matters too. Most platforms report breakeven happening at 1,000+ tickets per month with 40-50% tier-1 volume — which means companies under that threshold may not see meaningful financial returns in the first year. McKinsey estimates that deflection rates of 40-50% trigger ROI within six months for mid-market deployments, while more complex enterprise implementations may take twelve to eighteen months to see net savings above implementation costs.

    The Repeat Contact Cost Nobody Accounts For

    Gartner research puts the cost of each repeat contact — when a customer has to reach out again because their issue wasn’t resolved the first time — at $13.50 per instance in agent-assisted environments. When AI first response fails to resolve an issue and triggers a repeat contact, it doesn’t eliminate that $13.50 cost — it defers it and often increases it because the second contact now requires context reconstruction and possibly agent time.

    This is why FCR, not FRT, is the metric that actually drives AI support economics. A system that responds in four seconds and resolves 90% of issues is dramatically more valuable — financially and operationally — than a system that responds in four seconds and resolves 55% of issues, even if both report excellent first response times.

    The Hybrid Handoff Problem

    If there is a single area where AI customer support most consistently fails customers, it is the handoff from AI to human — and it is the area that receives the least design attention in most deployment projects.

    Why Escalation Design Is the Real Failure Point

    Qualtrics 2026 data is striking on this point: 90% of customers report reduced loyalty when they cannot access human support during an AI interaction. Support abandonment spikes sharply after five failed exchanges with an AI system. And the primary driver of AI support failure — ahead of incorrect answers, slow response times, or poor personalization — is the inability to clearly and easily reach a human when the AI can’t resolve the issue.

    This isn’t an AI capability problem. It’s an intentional design problem. Many organizations deploy AI support with escalation paths deliberately obscured — because escalation to a human agent costs money, and the AI is supposed to contain that cost. The short-term cost containment logic is understandable. The long-term brand damage from customers who feel trapped is not worth it.

    The Context Transfer Failure

    Even when escalation paths exist, the quality of handoff from AI to human agent varies enormously — and poor handoffs compound the customer’s frustration significantly. When a customer spends three exchanges explaining their issue to an AI, successfully escalates to a human, and then has to explain the entire issue again from scratch, the experience is measurably worse than if they had reached a human from the start.

    Effective AI escalation design includes automatic context transfer — a structured summary of what the customer said, what the AI understood, what solutions were attempted, and what remains unresolved — presented to the human agent before they begin the conversation. This single element transforms the quality of hybrid interactions from frustrating to genuinely seamless. Without it, escalation becomes punishment rather than resolution.

    Designing Escalation as a Feature, Not a Failure State

    The best-performing support organizations in 2026 treat human escalation not as a sign that AI failed, but as a deliberate part of their service architecture. For certain issue types — billing disputes involving large amounts, security-related concerns, emotionally charged situations, or anything involving regulatory compliance — the correct first response may be an AI triage that immediately routes to a human rather than attempting autonomous resolution.

    Gartner data shows that 95% of enterprise leaders retain human agents alongside AI systems. The ones doing this well have defined clear, documented criteria for which issue types always go to humans, which always get autonomous AI handling, and which follow hybrid protocols. That taxonomy doesn’t exist by default — it requires deliberate architecture decisions that most deployment projects rush past.

    Building AI First Response That Doesn’t Break: The Implementation Reality

    The gap between AI customer support deployments that perform well and those that create ongoing problems is almost entirely explained by implementation decisions, not technology selection. The platforms are similar enough that the differentiating factor is almost always the quality of the setup.

    The Six Implementation Mistakes That Predict Failure

    Based on 2026 post-deployment analysis from practitioners across the industry, six specific implementation patterns reliably predict problems:

    1. Skipping validation layers. Sending AI responses directly to customers without any quality check — even an automated one — is the most common path to the kinds of failures described above. Every production AI support system should have a layer between generation and delivery that checks responses for on-topic accuracy, brand voice consistency, and policy compliance.
    2. Deploying AI on unorganized operations. AI scales what’s already there. If your knowledge base is inconsistent, your SOPs are undocumented, and your support processes rely on tribal knowledge, an AI system will faithfully replicate all of that inconsistency at ten times the volume. Before deploying AI first response, the knowledge architecture must be clean, current, and structured.
    3. Single-model overloading. Feeding an entire knowledge base into one AI model produces the kind of context overload that degrades accuracy sharply. Best practices in 2026 involve deploying multiple specialized agents — one for billing, one for technical troubleshooting, one for account management — each with tightly scoped, optimized knowledge rather than one model attempting to handle everything.
    4. Full-volume deployment without staged rollout. Deploying AI first response to 100% of ticket volume on day one means that any systemic errors in your configuration reach every customer simultaneously. A staged rollout — starting with a single high-volume, low-risk queue, measuring performance for 30 days, and expanding incrementally — catches configuration errors before they become incidents.
    5. Neglecting post-sale vendor support. AI support platforms are not set-and-forget deployments. They require ongoing configuration, knowledge updates, and troubleshooting. Organizations that evaluate vendors primarily on features and price without rigorously vetting post-implementation support find themselves without help during exactly the moments when things break — high-volume periods like product launches or holiday seasons.
    6. Ignoring data freshness governance. AI systems trained on or retrieving from stale documentation generate confidently stated wrong answers. Knowledge base governance — including freshness metadata, update protocols, and version tracking — is not an optional operational detail. Vectara research shows hallucination rates range from 1% (with strong freshness controls) to 30% (without them).

    The 30-Day Pilot Framework

    The most reliable deployment methodology in current practice involves a structured 30-day pilot on a single, representative queue before any broader rollout. The metrics tracked during this pilot: FRT, misrouting rate (target below 5%), first contact resolution rate, escalation rate, and CSAT on AI-handled tickets versus human-handled tickets from the same queue.

    If FCR on AI-handled tickets comes in below 65% during the pilot, the correct response is to improve the knowledge base before expanding — not to push forward on schedule. The cost of fixing a poorly configured AI system across full production volume is substantially higher than taking an extra four weeks to get the pilot right.

    The Emotional Intelligence Gap

    AI emotional intelligence in customer support — sentiment analysis detecting frustration and adapting response tone

    One of the most significant developments in AI customer support in 2026 is the emergence of what practitioners are calling emotion-aware first response — AI systems that detect the emotional state of a customer’s message and adapt their response accordingly, in real time.

    What Sentiment-Aware AI Actually Does

    The technical architecture behind emotion-aware support AI involves multiple concurrent analysis streams: natural language processing to identify semantic content, sentiment classification to detect emotional valence (positive, neutral, negative, distressed), tone analysis to distinguish frustration from anger from sadness, and in voice applications, acoustic analysis of speech patterns.

    These signals feed into response generation in ways that change the character of the first response. A neutral inquiry about order status gets an efficient, informational response. A message from a customer who uses language indicating frustration — repeated phrases, capitalization, descriptions of how much time they’ve spent on the issue — triggers a response that leads with acknowledgment before moving to resolution. SciTePress research measuring satisfaction scores shows sentiment-aware AI producing scores of 9.13 out of 10 compared to 8.41 for systems without sentiment adaptation — a meaningful difference in perceived quality.

    The Personalization Layer

    Hyper-personalization — using a customer’s purchase history, account age, previous support interactions, and behavioral patterns to tailor the tone and content of first responses — is one of the highest-ROI investments an AI support team can make. Nextiva data shows 47% of companies linking personalization capabilities directly to revenue outcomes. McKinsey’s research indicates 5-15% revenue increase attributable to personalized customer interactions at scale.

    In practice, this means AI systems that distinguish between a customer who has been with a company for five years and one who signed up last week — and calibrate their first response language, offer parameters, and escalation thresholds accordingly. The five-year customer who contacts support for the first time gets acknowledged as a longtime customer. The new customer gets onboarding-oriented framing if their issue suggests a product familiarity problem. These are not dramatic differences — but in aggregate they shift how customers perceive the support interaction.

    Where Emotional Intelligence Still Has Limits

    Despite genuine advances, it’s worth being direct about where AI emotional intelligence remains limited. Approximately 50% of customers view AI as genuinely empathetic (Zendesk data), which means the other half do not — and when customers are dealing with genuinely distressing situations (bereavement, financial hardship, health issues), even well-executed AI empathy often feels insufficient. Only 27% of Gen Z consumers, the demographic most comfortable with AI across the board, are comfortable relying on AI for emotional support in a support context.

    The correct operational response to this is not to push AI emotional intelligence further into sensitive domains — it’s to use emotional signals as escalation triggers. When sentiment analysis detects a genuine distress signal that exceeds a threshold, the appropriate AI response is to acknowledge and immediately route to a human agent, with context prepared. That’s not a failure of AI — it’s an appropriate use of it as part of a larger system.

    What Comes Next: The Direction AI First Response Is Moving

    Looking beyond current deployments, the trajectory of AI first response in customer support points in several specific directions that organizations planning multi-year support infrastructure should be accounting for now.

    Proactive First Response

    The concept of the first response is already beginning to shift from reactive to proactive. AI systems integrated with product telemetry, order management systems, and usage data can identify customers who are likely to contact support — before they do — and send a first response proactively. A delivery that’s delayed gets a message before the customer notices and reaches out. A user whose behavior patterns suggest they’re stuck on a feature gets a helpful resource before they open a frustration-driven ticket. This inverts the support model fundamentally, and the early data on proactive AI support suggests significant CSAT improvements and measurable ticket volume reduction.

    Agentic Resolution: Beyond Triage

    First-response AI that can only talk is giving way to agentic AI that can act. The 2026 generation of AI support systems doesn’t just respond to a refund request — it checks the order status, validates the refund eligibility criteria, processes the refund, and sends the confirmation, all within the first interaction. ServiceNow reports that autonomous AI agents handle 80% of inquiries end-to-end, cutting complex case resolution by 52%. This shift from conversational to agentic AI changes the economics of support dramatically — because the cost isn’t just first response time anymore, it’s full resolution time on a per-case basis.

    The Accountability Architecture

    The Air Canada tribunal ruling has accelerated something that was already developing: formal accountability frameworks for AI-generated customer communications. Organizations are building audit trails that log every AI response, the knowledge sources it drew from, the confidence score associated with the generation, and the customer’s subsequent behavior. This creates a feedback loop that makes quality governance possible — and in regulated industries, may soon be required rather than optional.

    Conclusion: The Shift from Fast to Right

    The question that mattered most in AI customer support two years ago was: “How do we get response times down?” That question has been largely answered. The technology is there. The speed is achievable. The benchmarks are well-established.

    The question that matters in 2026 — and will matter more as AI support becomes universal — is different: “How do we make sure that fast response is also the right response?”

    That’s a harder question, and it doesn’t have a platform-level answer. It requires decisions about knowledge governance, validation architecture, escalation design, emotional intelligence calibration, and quality monitoring that have to be made by the organizations building these systems. The technology enables the speed. The quality is a choice.

    Companies that treat AI first response as a cost-reduction lever will continue to generate impressive FRT numbers and frustrating customer experiences. Companies that treat it as a quality-at-scale problem — using AI to deliver the kind of fast, accurate, personalized, emotionally aware first response that a great human agent would give — are the ones building support infrastructure that actually earns customer trust.

    The standard for AI first response in 2026 isn’t four seconds. It’s four seconds and correct.

    Actionable Takeaways

    • Measure FCR alongside FRT. If your AI reporting only shows first response time, you’re measuring the least important half of the equation. Build FCR tracking from day one.
    • Implement source-grounded RAG before deploying at scale. Ungrounded AI generation is the proximate cause of most high-profile AI support failures. Knowledge governance isn’t optional — it’s the foundation everything else sits on.
    • Audit your escalation paths as a separate project. Have someone unfamiliar with your system try to reach a human agent when the AI fails to resolve their issue. If they can’t do it in three steps or less, your escalation design needs work.
    • Pilot on one queue before expanding. A 30-day pilot on a high-volume, representative queue gives you the FCR and misrouting data you need to decide whether to expand or iterate.
    • Use sentiment signals for routing, not just tone adjustment. Real-time sentiment detection is most valuable as a routing trigger — getting distressed customers to human agents faster — not just as a way to make AI responses sound warmer.
    • Build context transfer into every escalation. The moment a customer transitions from AI to human agent, the agent should already have a structured summary of the conversation, the issue, the attempted resolutions, and the customer’s emotional state. This is a design decision, not a default behavior.
    • Track repeat contact rate as a lagging indicator. A rising repeat contact rate is the clearest signal that AI first response quality has degraded — and it often surfaces before CSAT scores move, giving you an early warning window to fix issues before they become patterns.
  • When AI Makes Things Up: How Retrieval-Augmented Automation Actually Solves the Hallucination Problem

    When AI Makes Things Up: How Retrieval-Augmented Automation Actually Solves the Hallucination Problem

    Retrieval-Augmented Automation: split-screen concept showing AI hallucination on the left versus RAG-grounded accurate output on the right, with glowing data pipelines connecting to verified knowledge sources

    There is something uniquely dangerous about a system that is wrong with complete confidence. A person who guesses and admits it gives you a warning. A system that fabricates and presents that fabrication as settled fact does not. That is the core problem with large language models deployed inside automation workflows without grounding — they don’t know what they don’t know, and they don’t tell you when they’re making something up.

    The industry has a word for this: hallucination. But that label has always felt a little too gentle, a little too neurological-metaphor-as-excuse. What we’re actually describing is a retrieval failure — an AI system generating outputs that are not supported by any real source, because it has no real source to consult. It is pattern-matching its way to an answer and presenting the result as if it were verified fact.

    In low-stakes contexts, hallucinations are a nuisance. In automated workflows — where AI output triggers downstream decisions, populates reports, feeds into customer communications, or informs compliance documentation — they are a liability. A documented, expensive, legally consequential one. Global business losses attributed to AI hallucinations reached $67.4 billion in 2024. That figure is almost certainly larger in 2026, as enterprise AI adoption has expanded to 85% of large organizations.

    Retrieval-Augmented Generation (RAG) is the architectural response to this problem. Not a model improvement, not a prompting technique, not a guardrail applied after the fact — but a structural change to how AI systems access and use information. This piece examines what RAG actually does, where it breaks down, how it’s evolving into something more powerful, and how to build automation workflows around it that hold up under real-world conditions.

    What Hallucinations Actually Cost: The $67.4B Reality Check

    Infographic showing AI hallucination cost statistics: $67.4 billion global business losses, 47% of executives made decisions on unverified AI content, $14,200 annual cost per employee for fact-checking AI outputs

    Before addressing the solution, it’s worth being precise about the problem — because “AI makes mistakes sometimes” dramatically undersells what’s actually happening in enterprise environments.

    The Numbers That Should Be on Every Executive Dashboard

    According to research by AllAboutAI cited across multiple 2026 analyses, global business losses from AI hallucinations reached $67.4 billion in 2024. That’s not a projection. That’s documented cost from decisions made, contracts filed, content published, and analyses produced based on AI outputs that were factually wrong.

    A Deloitte study found that 47% of business executives made major decisions based on unverified AI-generated content. Nearly half. In organizations where AI is embedded in financial forecasting, supply chain analysis, regulatory reporting, or customer communications, that statistic describes a systemic accuracy problem — not an edge case.

    Employees are spending 4.3 hours per week verifying AI outputs, according to Forrester research. At an organizational scale, that translates to roughly $14,200 per employee per year in verification overhead. Companies that deployed AI to accelerate work are now paying humans to check that work — and in many cases, that cost erodes the productivity gains AI was supposed to deliver.

    Hallucination Rates by Domain: The Range Is Alarming

    Hallucination rates are not uniform across tasks. On simple summarization, the best frontier models achieve rates as low as 0.7% — close to acceptable for many use cases. But in the domains where AI is most actively being deployed for automation, rates climb sharply.

    • Legal queries: 69–88% hallucination rate in ungrounded LLMs (Stanford HAI/RegLab). Even leading legal AI tools like Lexis+ retain ~17% error rates and Westlaw AI shows ~33%.
    • Medical and clinical queries: 15–60%+ in ungrounded models; clinical decision-support errors carry per-incident costs ranging from $50,000 in customer service contexts to $2.1 million in healthcare.
    • Financial analysis: 15–25% error rates, with per-incident costs in financial services ranging $50,000–$2.1 million.
    • Customer service: 15–27% hallucination rate without grounding, per recent benchmarks.
    • Stanford HAI 2026 AI Index: Documented hallucination rates of 22–94% across 26 models in standardized accuracy benchmarks.

    The implication is stark: if your AI automation is running without retrieval grounding in any of these domains, you are not operating a productivity tool. You are operating a confident fabrication machine. The business case for RAG is not theoretical — it’s the gap between those hallucination rates and what’s achievable with proper retrieval architecture in place.

    The Hidden Cost Layer: Automation Amplification

    What makes hallucinations in automated workflows particularly damaging is the amplification effect. When a human analyst is wrong, they’re wrong once. When an automated system is wrong, it’s wrong at scale — across every instance of the workflow, every customer it touches, every report it generates, until someone catches the error manually. Testlio found that 82% of AI bugs stem from hallucinations, not visible system failures. Most of them aren’t caught at the point of generation. They’re caught downstream, after damage has already occurred.

    Why Traditional AI Automation Fails Without Grounding

    Understanding RAG requires understanding why LLMs hallucinate in the first place — and it’s not what most people assume. The common mental model is that AI “doesn’t know” something and guesses. The actual mechanism is more specific and more troubling.

    The Parametric Knowledge Problem

    Large language models store knowledge in their parameters — the billions of numerical weights that encode statistical relationships between tokens, learned during training. This parametric knowledge has three critical limitations for automation use cases.

    It has a cutoff date. Any information generated or updated after training is invisible to the model. For enterprise environments where policies, pricing, regulations, product specifications, and procedures change regularly, this is immediately disqualifying for high-stakes automation without a grounding layer.

    It generalizes, rather than specializes. A model trained on broad internet data knows a lot about general concepts but very little about your specific internal processes, your particular product line, your organization’s compliance requirements, or your customer history. When asked about these specifics, it extrapolates from general patterns — and those extrapolations are where hallucinations live.

    It cannot cite what it doesn’t have. Parametric knowledge produces confident assertions without traceable sources. Even when a model happens to be correct, you cannot verify it, audit it, or trace its reasoning back to a primary document. In regulated industries, this alone disqualifies ungrounded AI from most production workflows.

    Why Fine-Tuning Isn’t the Answer

    Fine-tuning — the process of further training an LLM on domain-specific data — addresses some of these problems but not the core one. Fine-tuning is expensive, time-consuming, and produces a static artifact. The moment your internal data changes, your fine-tuned model is already out of date. It also doesn’t eliminate hallucination; it adjusts the model’s tendencies without providing verifiable grounding. Fine-tuned models hallucinate — they just hallucinate in more domain-appropriate-sounding language, which can actually make errors harder to detect.

    RAG solves a different problem than fine-tuning solves. Fine-tuning is about style, tone, and domain fluency. RAG is about factual accuracy and source verifiability. They are not substitutes for each other, and conflating them leads to misallocated engineering effort.

    RAG Explained: What Retrieval-Augmented Generation Actually Does

    Technical diagram of the RAG pipeline showing three stages: user query input, retrieval engine pulling from multiple knowledge sources including PDFs and databases, and grounded LLM generation with source citations

    Retrieval-Augmented Generation, introduced in a 2020 paper by Lewis et al. at Meta AI, is architecturally simple in concept: before the LLM generates a response, a retrieval system fetches relevant documents from a knowledge base and injects them into the model’s context window. The model then generates its answer based on that retrieved context — not (primarily) from parametric memory.

    The Three-Stage Architecture

    A production RAG system operates across three distinct stages, each with its own failure modes and optimization levers:

    Stage 1 — Indexing. Documents from your knowledge sources (PDFs, internal wikis, databases, APIs, policy documents, CRM records) are preprocessed, chunked into retrievable segments, converted into numerical vector representations (embeddings), and stored in a vector database. This is the foundation stage. Errors here — poor chunking, wrong embedding models, stale content — cascade forward into every subsequent retrieval.

    Stage 2 — Retrieval. When a query arrives, the system converts it into a vector representation and searches the index for chunks that are semantically similar. The top-K most relevant chunks are selected and assembled into a context window. This stage is where most RAG failures in production actually originate — not in the LLM generation step.

    Stage 3 — Generation. The assembled context, along with the original query, is fed to the LLM. The model generates its response based on the retrieved content and is instructed (via system prompt) to only answer based on provided context — and to acknowledge when the context doesn’t contain a sufficient answer.

    The Chunking Decision That Matters More Than Model Choice

    Most teams getting started with RAG spend most of their optimization effort on model selection. Research from FloTorch benchmarks suggests they’re looking in the wrong place. The chunking strategy — how documents are split before indexing — has an outsized effect on retrieval accuracy.

    FloTorch’s FinanceBench data makes this concrete: semantic chunking with metadata filtering achieves 60% accuracy, compared to only 25% for fixed-size chunking with metadata. That’s not a marginal difference — it’s the difference between a system that works and one that doesn’t. Semantic chunking respects natural information boundaries in documents (paragraphs, sections, logical units) rather than splitting arbitrarily on character counts. Metadata tagging — adding document type, date, source, and topic labels to each chunk — allows the retrieval system to filter candidates before ranking them.

    Hybrid Retrieval: Why Vector Search Alone Isn’t Enough

    Early RAG implementations relied on dense vector search — embedding-based similarity matching. It works well when queries are semantically related to the stored content but degrades on exact-match lookups, product codes, proper nouns, and highly specific technical terminology where semantic similarity isn’t a reliable proxy for relevance.

    Hybrid retrieval — combining dense vector search with sparse keyword-based retrieval (typically BM25) — closes this gap. FloTorch benchmarks show that hybrid retrieval yields 20–40% higher recall compared to dense-only approaches. The practical implication: if your RAG system uses vector search only, you are leaving significant retrieval accuracy on the table, particularly for structured data and domain-specific terminology queries.

    The Three Layers Where RAG Breaks (And How to Fix Each One)

    Architecture diagram showing the three failure points in a RAG pipeline: stale knowledge base data, wrong chunks retrieved at the retrieval layer, and LLM ignoring context at the generation stage, with fixes shown for each

    RAG is not a plug-and-play solution. Research into production RAG failures reveals a consistent pattern: teams that succeed with RAG are those who understand where retrieval fails. Teams that treat RAG as a black-box fix add it to their stack and then wonder why hallucinations persist.

    Layer 1 Failure: Knowledge Base Governance

    The most common — and most underappreciated — RAG failure mode has nothing to do with vector databases or embedding models. It’s stale, uncertified, or poorly structured source content.

    Analysis of production RAG systems found that 40–60% fail in production due to stale content, uncertified sources, or undefined data ownership. The scenario plays out predictably: an enterprise indexes its internal documentation, deploys RAG, and gets promising results in testing. Six months later, policies have changed, procedures have been updated, and new product specifications have been issued — but the knowledge base hasn’t been updated with the same discipline. The RAG system is now confidently surfacing outdated information, grounded in real documents that are no longer accurate.

    The fix: Knowledge base governance is not an IT task — it’s an ongoing operational discipline. This means assigning document ownership, establishing update SLAs for each document category, adding freshness signals (metadata timestamps with expiration triggers), and implementing automated staleness alerts. Re-rankers and sophisticated retrieval improve precision across indexed content, but they cannot compensate for content that simply shouldn’t be surfaced at all.

    Layer 2 Failure: Retrieval Quality

    Even with a well-maintained knowledge base, retrieval quality failures are common. The most frequent patterns identified in production audits include: embedding drift (accuracy decaying 5–8% per month as content evolves while embeddings remain static), context fragmentation from aggressive chunking, query-document terminology mismatch, and top-K parameter settings that retrieve too many low-relevance chunks that dilute the context.

    Re-ranking is the primary mitigation for retrieval quality failures at this layer. After initial retrieval, a cross-encoder model re-scores each candidate chunk against the specific query — not just for semantic proximity, but for genuine relevance to the question being asked. Enterprise benchmarks show cross-encoder re-ranking improves precision by 18–42% and meaningfully reduces hallucinations by filtering out irrelevant context before it reaches the LLM.

    The fix: Implement a two-stage retrieval process. Use vector search (dense + sparse hybrid) for broad candidate selection, then apply a re-ranker to narrow to the genuinely most relevant chunks. Set a confidence threshold — typically 0.7–0.8 — and configure the system to respond with an explicit “I don’t have sufficient information” when no retrieved chunk meets that threshold. Silence on low-confidence queries is not a failure; it’s a feature.

    Layer 3 Failure: Generation Phase Drift

    The third failure mode occurs even when the right content is retrieved: the LLM ignores or undermines the retrieved context, falling back on parametric knowledge to fill gaps or resolve ambiguities. This happens particularly when retrieved context is contradictory, when the context window is overloaded with marginally relevant information, or when prompting hasn’t established clear grounding constraints.

    The fix: System prompt engineering for RAG is a distinct discipline from general prompt engineering. Effective RAG system prompts explicitly instruct the model to: (1) treat the provided context as authoritative, (2) not supplement context with parametric knowledge, (3) cite the source of claims in responses, and (4) explicitly acknowledge when the provided context does not contain a sufficient answer. Context window management — ensuring retrieved chunks are ordered by relevance, with the highest-relevance content early in the context — also significantly reduces generation drift.

    From Basic RAG to Agentic RAG: The Architecture That Changes Everything

    Comparison chart of Basic RAG versus Agentic RAG versus GraphRAG showing increasing accuracy, architectural complexity, and enterprise performance across the three approaches

    Basic RAG is a static pipeline: query arrives, retrieval runs, context is assembled, LLM generates, response is returned. This works well for straightforward question-answering over a well-maintained knowledge base. It breaks down on complex, multi-step tasks where a single retrieval pass cannot capture all the information needed to generate an accurate answer.

    Agentic RAG replaces the static pipeline with an autonomous reasoning loop that can plan retrieval strategies, execute multiple queries, reflect on intermediate results, use external tools, and refine its answer iteratively before returning a final response.

    The Five Workflow Patterns of Agentic RAG

    Enterprise agentic RAG implementations have coalesced around five core workflow patterns, each suited to different task types:

    • Prompt chaining: Sequential retrieval steps where each output feeds the next query. Ideal for multi-step analytical tasks where later questions depend on earlier answers.
    • Routing: An agent classifies the incoming query and directs it to the appropriate specialized retrieval process — routing a billing question to CRM data, a policy question to the internal documentation index, and a technical question to engineering documentation, rather than searching all sources every time.
    • Parallelization: Multiple retrieval queries run concurrently, with results merged before generation. Reduces latency for complex queries that require broad knowledge synthesis.
    • Orchestrator-workers: A planning agent decomposes complex tasks into sub-tasks and delegates them to specialized retrieval workers, each focused on a specific knowledge domain or tool.
    • Evaluator-optimizer: After initial generation, a separate evaluation agent reviews the response for factual consistency with the retrieved context and triggers additional retrieval or refinement if the answer fails quality thresholds. This pattern is what enables self-reflective RAG — the architecture that achieved 0% hallucination rates in controlled clinical consultations.

    The Latency Trade-Off

    Agentic RAG delivers significantly higher accuracy for complex tasks, but it comes with a cost: latency. Current benchmarks show agentic RAG averaging 3+ seconds for complex multi-hop queries. For synchronous customer-facing applications, this is a real constraint. For asynchronous automation workflows — nightly report generation, document review pipelines, compliance checking, research summarization — it’s typically irrelevant. Architecture selection should be driven by the latency tolerance of the specific workflow, not by default preference for the most sophisticated approach.

    Real-World Agentic RAG Deployments

    Practical agentic RAG use cases that are in production in 2026 include:

    Employee support automation that handles expense policy questions by querying across HR documentation, finance policy docs, and historical exception tickets — escalating only when no retrieved context provides a definitive answer.

    Developer copilots that retrieve across code repositories, API documentation, build results, and issue trackers before suggesting fixes — running linting and static analysis tools as part of the retrieval process.

    Customer support agents that search CRM records, product manuals, and past ticket histories, and that explicitly re-ask or escalate when retrieved context is incomplete — rather than generating a plausible-sounding answer from parametric memory.

    Legal research pipelines that decompose a complex legal question into sub-questions, retrieve across case law, regulatory texts, and internal precedent documents simultaneously, then synthesize a grounded summary with explicit citations to every source.

    GraphRAG: When Relationships Matter More Than Documents

    Vector-based RAG treats each document chunk as an independent unit retrieved by similarity. This works when queries can be answered from individual passages. It fails when the answer requires reasoning about relationships between entities — how a regulation affects a specific business unit, how a product recall in one market interacts with warranty policies in another, or how customer behavior data links to specific support escalation patterns.

    GraphRAG addresses this by grounding retrieval in a knowledge graph rather than (or in addition to) a vector index. Instead of retrieving similar text chunks, the system traverses structured relationships between entities — products, customers, regulations, incidents, policies — to assemble a factually grounded, relationally coherent context.

    What the Numbers Say About GraphRAG in Enterprise

    GraphRAG’s performance advantages over traditional vector RAG are significant at scale:

    • GraphRAG achieves 72–83% comprehensiveness versus traditional RAG on complex enterprise queries, with a 3.4x accuracy improvement in enterprise scenarios (Towards AI, 2026)
    • Knowledge graph-backed RAG can achieve 90%+ accuracy versus approximately 60% for embeddings-only RAG on entity reasoning tasks (Graphwise research)
    • For multi-hop queries — questions requiring more than one logical inference step — GraphRAG achieves 70–85% accuracy compared to 40–55% for traditional RAG (RebaseHQ benchmarks)
    • LinkedIn reported a 78% accuracy improvement and 29% faster median resolution time after integrating knowledge graphs into their RAG pipeline

    When to Use GraphRAG vs. Vector RAG

    GraphRAG isn’t the right architecture for every use case. Building and maintaining a knowledge graph requires significantly more upfront effort than indexing documents into a vector store. The decision framework is relatively straightforward: if more than 25% of your automation’s queries involve relational reasoning — connecting entities across data domains — GraphRAG will deliver meaningful accuracy gains that justify the investment. If your queries are predominantly single-document lookups or semantic search tasks, well-optimized vector RAG with hybrid retrieval will perform adequately and at lower operational complexity.

    Many production systems in 2026 run hybrid architectures: a vector store for broad document retrieval, a knowledge graph for entity-relationship queries, and routing logic that directs incoming queries to the appropriate retrieval path based on intent classification.

    Measuring What You Can’t See: RAG Evaluation Frameworks

    RAG evaluation scorecard dashboard showing faithfulness, context precision, context recall, and answer relevancy metrics as circular gauges, with RAGAS, TruLens, and DeepEval evaluation tools

    One of the most common mistakes in RAG deployment is treating successful testing as validation of production readiness. RAG systems degrade over time — as knowledge bases go stale, as query patterns shift, as embedding drift accumulates — and that degradation is often invisible without active measurement.

    By 2026, RAG evaluation has matured into a specialized tooling ecosystem with three dominant frameworks, each serving a different phase of the development and operations lifecycle.

    The Four Metrics That Define RAG Health

    Across RAGAS, TruLens, and DeepEval — the three leading evaluation frameworks — four core metrics have emerged as the standard measures of RAG quality:

    Faithfulness measures whether the claims in a generated answer are actually supported by the retrieved context. This is the primary hallucination detection metric. A faithfulness score below 0.75 indicates frequent hallucination or context drift. Production systems targeting regulated industries should aim for 0.9 or above. RAGAS computes this by decomposing generated claims and checking each against the retrieved context — a more rigorous approach than simple similarity scoring.

    Context Precision measures the proportion of retrieved chunks that are actually relevant to answering the query. Low precision means the retrieval stage is pulling too much noise, which dilutes the LLM’s context and increases generation drift. Target: 0.70 or above.

    Context Recall measures whether the retrieved context actually contains the information needed to answer the query. Low recall means the knowledge base is incomplete or the retrieval strategy is missing relevant documents. Target: 0.75 or above.

    Answer Relevancy measures whether the generated response directly addresses the original query — catching cases where the model answers a related but different question. Target: 0.80 or above.

    Choosing the Right Evaluation Tool

    RAGAS is the best starting point for most teams — lightweight, reference-free (doesn’t require ground truth labels), and fast enough to run on representative query sets during development. Its primary limitation is that it doesn’t provide span-level pipeline diagnostics, making it harder to identify exactly where in the pipeline a failure occurred.

    TruLens fills this gap with OpenTelemetry-based tracing that instruments each step of the retrieval pipeline. When a faithfulness score drops, TruLens can tell you whether the failure occurred at retrieval (wrong chunks), context assembly (too much noise), or generation (model drift). It integrates natively with LangChain, LlamaIndex, and Snowflake, making it the preferred monitoring tool for production systems that need failure root-cause analysis.

    DeepEval leads for teams running CI/CD pipelines. With 50+ metrics, native Pytest integration, and support for RAG, agents, and multimodal systems, it’s the right choice for organizations that want automated evaluation gates before deploying updates to their RAG pipeline.

    The Decay Problem: Why Evaluation Is an Ongoing Practice

    Production audits of enterprise RAG systems reveal a consistent pattern: systems that are not actively monitored show 5–8% accuracy decay per month as content becomes stale, embedding models drift relative to content evolution, and query patterns shift in ways the original retrieval strategy wasn’t optimized for. Building evaluation into deployment pipelines — not just at launch — is what separates RAG implementations that maintain performance from those that degrade silently.

    Industry-by-Industry: Where RAG Is Already Working

    The case for RAG is most compelling not in aggregate statistics but in the domain-specific evidence. Here’s where retrieval-augmented automation is delivering documented results across industries in 2026.

    Legal and Compliance

    Legal AI presents one of the starkest before-and-after stories in RAG adoption. Ungrounded LLMs hallucinate at rates of 69–88% on legal queries — a rate that makes them actively dangerous for any compliance or legal research application. Stanford RegLab research documented this range across commercial legal AI tools before RAG grounding was applied.

    Post-RAG, the numbers shift significantly: Lexis+ AI, with retrieval grounding, reduced its error rate to approximately 17%. That’s still not zero, and no legal professional should rely on AI without expert review — but the reduction from 69–88% to 17% represents a practical difference between a system that’s occasionally wrong and one that’s wrong most of the time.

    For compliance automation specifically — policy Q&A, regulatory change monitoring, AML policy lookups — RAG’s citation capabilities are as important as its accuracy improvements. Auditable, source-traceable outputs are a compliance requirement in regulated industries. Ungrounded LLMs cannot provide them. RAG can.

    Healthcare and Clinical Decision Support

    Clinical AI is the domain where RAG’s accuracy improvements are most dramatic — and where the stakes of failure are highest. A PubMed study cited in 2026 RAG analyses found that self-reflective RAG in clinical decision support eliminated hallucination errors entirely (from an 8% baseline to 0%) in 100 synthetic consultations, with an 89% performance improvement over the ungrounded baseline.

    Multi-evidence RAG — systems that retrieve from multiple clinical knowledge sources and require cross-corroboration before including a claim in the output — achieved a greater than 40% reduction in hallucinations in biomedical applications. Visual RAG (V-RAG) combining text and image retrieval improved F1 scores and reduced hallucinated entities in radiology reporting workflows.

    These aren’t marginal improvements. They’re the difference between clinical AI that can be responsibly integrated into a care workflow under human oversight and clinical AI that can’t be deployed at all.

    Financial Services

    Financial services AI faces a dual challenge: high hallucination rates in ungrounded models (15–25% on financial analysis tasks) and severe per-incident costs ($50,000–$2.1 million for documented hallucination-related errors). RAG grounding combined with GraphRAG for relational reasoning across financial data has become the production standard for financial analysis automation in regulated markets.

    Real-time data integration is particularly important in financial AI. Modern RAG implementations use stream processing (Apache Kafka and similar) to ingest continuously-updated market data, regulatory filings, and internal financial records — enabling responses grounded in current information rather than training data that may be months or years old.

    Enterprise Knowledge Management and Support

    Perhaps the most widely deployed use case for RAG in 2026 is internal knowledge management: AI-powered employee support, HR policy Q&A, and operational procedure lookup. Organizations report 60–80% reductions in hallucinations and 3x accuracy improvements on domain-specific queries after deploying RAG over their internal knowledge bases.

    The driver here isn’t just accuracy — it’s the economics of scale. When AI handles 60–70% of tier-one support queries with grounded, accurate responses, the remaining volume that reaches human agents is higher-complexity and more valuable for human attention. The cost per resolved query drops, and employee time is redirected toward exceptions rather than routine lookups.

    Building a RAG-Grounded Automation Stack That Holds Up

    Deploying RAG in production is an engineering project with specific architectural requirements — not a feature flag. Here’s the practical framework for building automation on retrieval-augmented grounding that performs reliably over time.

    Step 1: Define Your Knowledge Domains Before Touching Architecture

    The most common architecture mistake is building a single monolithic knowledge base for all AI automation use cases. Different domains have fundamentally different data characteristics, update frequencies, and relevance criteria. Your internal HR documentation, product engineering specs, customer support history, and regulatory compliance library should not live in the same vector index.

    Domain-specific knowledge bases with domain-aware retrieval routing deliver significantly better precision than generalist indexes. Define your knowledge domains first — their sources, ownership, update frequency, and query patterns — before designing your retrieval architecture.

    Step 2: Invest in Data Quality Before Investing in Model Quality

    Given that 40–60% of RAG failures originate in the knowledge base layer, the ROI on data quality work is consistently higher than the ROI on model upgrades. This means: establishing document ownership and update SLAs, implementing content certification processes, adding metadata schemas that enable filtered retrieval, and building automated staleness detection.

    A RAG system running on a rigorously maintained, well-structured knowledge base with a standard embedding model will outperform a RAG system running on a poorly maintained knowledge base with a state-of-the-art embedding model. This is consistently underestimated by teams that come from a model-centric perspective.

    Step 3: Build Hybrid Retrieval From the Start

    Given the 20–40% recall improvement that hybrid retrieval (dense + sparse) delivers over dense-only approaches, there is rarely a good reason to build dense-only retrieval in a production system. The additional implementation complexity is modest, and the accuracy benefit is consistent across benchmarks.

    A typical production configuration: 60% weight to semantic vector search, 40% weight to BM25 keyword matching, with results merged using reciprocal rank fusion before re-ranking. These weights can be tuned based on your specific query mix — queries heavy on proper nouns and exact terminology benefit from higher BM25 weighting.

    Step 4: Layer in Re-Ranking Before Generation

    Initial retrieval prioritizes recall — getting the right documents into the candidate set. Re-ranking optimizes precision — ensuring the LLM only sees genuinely relevant content. Cross-encoder re-ranking adds computational overhead but delivers 18–42% precision improvements consistently enough that it should be treated as a standard pipeline component, not an optional enhancement.

    Step 5: Set Explicit Confidence Thresholds and Graceful Fallback

    A production RAG system should know when it doesn’t know. Configuring explicit confidence thresholds — and training the system to respond with “I don’t have sufficient information to answer that reliably” when retrieved context falls below that threshold — is not a degradation of capability. It’s what makes the system trustworthy for automation.

    A system that answers 70% of queries accurately and explicitly declines 30% is more useful — and vastly less dangerous — than a system that answers 100% of queries with 70% accuracy and no indication of which answers are reliable.

    Step 6: Build Evaluation Into the Pipeline, Not Onto the Side

    RAGAS or equivalent scoring should run continuously against a representative query set, with automated alerting when faithfulness scores drop below thresholds. For regulated industries, target faithfulness >0.9 and context precision >0.75. For general enterprise use, faithfulness >0.8 and context precision >0.7 are reasonable operational targets.

    Evaluation should run before deployment (catching regressions in the retrieval pipeline) and in production (catching accuracy decay from knowledge base staleness or query pattern drift). Teams that evaluate only at deployment discover problems months after they’ve already affected users.

    The Governance Layer: RAG in Regulated and Compliance-Critical Environments

    For organizations operating in regulated industries — financial services, healthcare, legal, government — RAG deployment carries additional requirements beyond technical accuracy. The EU AI Act (in enforcement from August 2026) and parallel regulatory frameworks in the US and APAC markets impose specific transparency, auditability, and human oversight requirements on high-risk AI systems.

    What Compliance Requires From a RAG System

    Regulated RAG deployments need to address four specific compliance concerns:

    Source traceability. Every AI output must be traceable to specific source documents. RAG’s native citation capability — including the chunk, the document, and the version of the document used to generate each output — is the mechanism that makes this possible. Systems that generate outputs without this audit trail do not meet compliance requirements in most regulated sectors.

    Access control alignment. The documents a user can access through AI should mirror the documents they can access directly. RAG systems in enterprise environments need to implement per-query access control filtering, ensuring retrieval only surfaces content the querying user or system has authorization to see.

    Human oversight touchpoints. For high-stakes automation — decisions affecting customer financial accounts, clinical recommendations, legal determinations — RAG automation should be designed as decision-support, not decision-replacement. Outputs should include confidence signals that inform human review prioritization.

    Data residency and privacy. For organizations operating across jurisdictions with data residency requirements, RAG architectures need to route queries to geographically-appropriate knowledge bases and ensure that retrieval doesn’t surface data across compliance boundaries. Edge RAG deployments — where retrieval occurs on-premises or in a specific region — are an emerging architecture pattern for privacy-critical environments.

    The Practical Takeaways: What to Actually Do With This

    If you’re building or evaluating AI automation for 2026 deployment, retrieval-augmented grounding is not optional in any domain where accuracy, auditability, or compliance matters. Here’s a compressed decision framework:

    Start with an honest hallucination audit

    Before deploying any AI automation, run your specific query types through your chosen LLM and measure actual hallucination rates using RAGAS or equivalent tooling. Domain-specific rates — not benchmark rates — tell you what you’re actually working with. The gap between current rates and acceptable rates defines your RAG investment case.

    Match architecture to query complexity

    Basic RAG with hybrid retrieval is the right starting point for most use cases. Layer in re-ranking as a default component. Add agentic capabilities (iterative retrieval, tool use, evaluator loops) only for workflows where single-pass retrieval demonstrably falls short. Adopt GraphRAG for domains where relational reasoning across entity types is a primary query pattern.

    Treat knowledge base maintenance as a core operational function

    Assign document ownership. Set update SLAs. Automate staleness detection. Budget for ongoing knowledge base curation the same way you budget for database administration — because that’s effectively what it is.

    Build evaluation into every stage

    Faithfulness, context precision, context recall, and answer relevancy should be tracked from first deployment and monitored continuously. Set automated alerts for threshold breaches. Treat accuracy decay the same way you’d treat a service degradation — with a structured response, not reactive troubleshooting after users notice.

    Conclusion: The New Baseline for Trustworthy AI Automation

    The conversation about AI hallucinations too often gets stuck at the level of model benchmarks — which LLM hallucinates less, which safety training is most effective, which guardrail catches the most errors. These are useful questions, but they address symptoms rather than architecture.

    RAG addresses architecture. It changes the information structure that AI operates within — from parametric memory with no verifiable source to retrieved, grounded, citable context with explicit provenance. That structural change is what drops hallucination rates from 69–88% to 17% in legal AI, from 8% to 0% in self-reflective clinical systems, from unacceptable baselines to production-viable accuracy across domains.

    The $67.4 billion cost of AI hallucinations is a 2024 figure. Every organization that deployed AI automation without grounding in 2024 and 2025 contributed to it. The organizations that won’t contribute to whatever the 2026 figure turns out to be are the ones treating retrieval grounding not as an advanced technique but as the baseline requirement it has become.

    RAG is not a complete solution. Knowledge base governance is hard. Retrieval optimization is ongoing. Evaluation requires dedicated infrastructure. Agentic architectures introduce latency trade-offs. GraphRAG requires significant upfront investment in knowledge modeling. None of these challenges are reasons to avoid retrieval-augmented automation — they’re the reasons building it correctly requires deliberate engineering rather than plug-and-play deployment.

    The alternative — confident, fluent, unverifiable, wrong — is no longer acceptable for production AI systems. The $67.4 billion says so. So does the 47% of executives who made major decisions on AI content nobody bothered to check. Retrieval-augmented automation is not a feature addition to AI workflows. In 2026, it’s the minimum viable architecture for any AI automation that needs to be trusted.

    “A system that answers 70% of queries accurately and declines the rest is more trustworthy than a system that answers everything with 70% accuracy and no indication of which answers are reliable.”

    The gap between those two systems is where RAG lives. Close it deliberately, or discover it expensively.

  • The Architecture of Perception: How to Build Multimodal AI Workflows That Actually Work in Production (2026)

    The Architecture of Perception: How to Build Multimodal AI Workflows That Actually Work in Production (2026)

    The Multimodal Automation Stack — three-layer architecture diagram showing perception, reasoning, and action layers with data flows

    Most conversations about AI automation get the core question wrong. The question isn’t which AI model should we use? It’s what are we actually asking the AI to perceive?

    When a customer service agent gets a complaint, it arrives as text. But the full signal behind that complaint might include a photo of a damaged product, a video clip the customer recorded, a prior call transcript, and metadata about their purchase history. If your automation workflow can only read the text of that complaint, you are — by definition — working with a fraction of the available information. You are making decisions from an amputated signal.

    This is the multimodal problem. And in 2026, it sits at the center of why some AI automation projects are delivering 300–500% ROI while others are stuck in perpetual pilot mode.

    Multimodal AI — systems that can simultaneously process text, images, audio, video, and structured sensor data — has crossed from research curiosity into production deployment. The global multimodal AI market stands at $3.85 billion in 2026 and is tracking toward $13.51 billion by 2031 at a 28.59% compound annual growth rate. Gartner forecasts that 40% of enterprise applications will embed AI agents by the end of this year, up from just 5% in 2025. But deployment rates don’t tell the full story. The gap between deploying a multimodal model and building a multimodal workflow that actually works in production is where most organizations quietly struggle.

    This guide is about that gap — the architectural decisions, the failure modes, the data pipeline realities, and the design patterns that determine whether a multimodal AI project delivers measurable business value or becomes an expensive proof of concept that never escapes the sandbox.

    What Multimodal AI Actually Means for Automation (Beyond the Buzzword)

    The term “multimodal AI” gets used loosely enough that it’s worth establishing a precise definition — particularly one that’s useful for people building automation systems rather than just experimenting with chatbots.

    A multimodal AI system is one that ingests, processes, and reasons across two or more distinct input types — typically some combination of text, images, audio, video, and structured data (like sensor readings, database records, or time-series signals). The key word is simultaneously. A system that processes an image and then separately processes a text description of that same image is not truly multimodal. True multimodality means the model forms a unified internal representation that draws on all inputs together, allowing the signals from one modality to inform interpretation of another.

    The Three Dominant Models in 2026

    Three models currently dominate enterprise multimodal deployment, each with distinct strengths:

    • GPT-4o leads on ecosystem breadth and raw multimodal benchmark performance, scoring 69.1% on the MMMU (Massive Multitask Multimodal Understanding) benchmark and 92.8% on DocVQA (document visual question answering). Its 128K context window and deep integration with Microsoft 365 Copilot make it the default choice for organizations already in the Microsoft stack. Its diagram understanding score of 94.2% on the AI2D benchmark makes it particularly strong for technical document workflows.
    • Claude 3.7 Sonnet (and increasingly Claude 4.x in newer deployments) excels on document-heavy, structured-extraction tasks. With a 200K+ context window and a 77.2% SWE-bench score for code-adjacent reasoning, it’s the preferred choice for workflows requiring precision over breadth — legal document analysis, technical specification extraction, compliance audit workflows.
    • Gemini 2.0 offers native integration with Google Workspace and Google Cloud infrastructure, with demonstrated efficiency gains of approximately 105 minutes saved per user per week in internal Google studies. For organizations in the Google ecosystem processing high-volume tasks, Gemini’s cost-per-token economics and native tool integration make it the rational default.

    Multimodal Models vs. Multimodal Workflows

    Here’s the distinction most implementations miss: a multimodal model is a capability. A multimodal workflow is an architectural decision. You can have access to the most capable multimodal model available and still build a workflow that delivers unimodal results — because the workflow was designed to funnel everything into text before passing it to the model.

    This is context collapse, and it’s more common than most practitioners will admit. We’ll cover it in detail in the next section. For now, the important frame is this: choosing a model is step five. Designing the data flow, the modality routing, and the fusion strategy is steps one through four.

    The Three-Layer Architecture Every Multimodal Workflow Needs

    Regardless of industry or use case, production-grade multimodal automation systems follow a consistent architectural pattern. Understanding this pattern is prerequisite knowledge before selecting tools, vendors, or models.

    Layer 1: The Perception Layer

    The perception layer is responsible for ingesting raw inputs from all modalities and transforming them into representations that the reasoning layer can work with. This is not the glamorous part of the stack, but it is where most production failures originate.

    In practical terms, the perception layer includes:

    • Modality-specific encoders: Separate neural encoding pipelines for visual data (images, video frames), audio (voice, environmental sound), structured data (sensor readings, database records), and text (documents, transcripts, metadata). Each encoder converts raw input into embedding vectors.
    • Temporal synchronization: When multiple data streams arrive simultaneously — say, a security camera feed, a microphone input, and sensor readings from the same piece of equipment — they must be aligned in time to sub-millisecond precision. Desynchronization here creates “ghost artifacts” downstream — the model reasons about events that don’t actually co-occur.
    • Preprocessing and normalization: Image resolution standardization, audio resampling, text tokenization, and schema validation for structured data. Inconsistent preprocessing is one of the most common sources of modality mismatch errors in production.
    • Streaming vs. batch ingestion: Real-time workflows (production line QC, emergency response) require streaming ingestion with Kafka or Flink. Batch workflows (document processing, report generation) can use Apache Spark or simpler ETL pipelines. Choosing the wrong ingestion architecture here locks you into latency characteristics that can’t be easily changed later.

    Layer 2: The Reasoning Layer

    The reasoning layer is where the multimodal fusion actually happens. Encoder outputs from the perception layer are combined into a unified representation using cross-attention mechanisms — the same transformer-based architecture that allows a model to understand that the cracked surface in an image corresponds to the vibration anomaly in the sensor reading and the “grinding noise” mentioned in the maintenance log.

    The reasoning layer also handles:

    • Short-term and long-term memory: In agentic systems, the reasoning layer needs access to the current context (what’s happening right now across all input streams) and persistent memory (what happened in prior interactions, prior inspection cycles, prior customer touchpoints). Without this, workflows lose coherence across multi-step tasks.
    • Conflict detection: When two modalities give contradictory signals — a quality control image shows a perfect product while a sensor reading indicates a thermal anomaly — the reasoning layer must flag this conflict rather than arbitrarily resolving it. Systems that silently resolve contradictions produce confident wrong answers.
    • Fusion strategy selection: Not all fusion happens the same way. Early fusion combines raw inputs before encoding (best for tightly correlated signals like video + audio). Late fusion combines encoded representations after each modality is independently processed (better when modalities have different reliability levels). Hybrid fusion uses early fusion for some pairs and late fusion for others. Production systems that apply one fusion strategy uniformly across all use cases consistently underperform.

    Layer 3: The Action Layer

    The action layer translates reasoning-layer outputs into concrete workflow steps: API calls to downstream systems, database writes, alerts, approval requests, generated documents, or commands to physical systems like robotic actuators.

    The critical design consideration at this layer is output format fidelity. The reasoning layer may generate rich, nuanced conclusions. If the action layer only supports a binary approve/reject output to a downstream ERP system, that nuance is lost. Action layer design should work backwards from what downstream systems can actually consume — not forwards from what the model can theoretically produce.

    Where Multimodal Workflows Break: The Three Failure Modes

    Three failure modes of multimodal AI workflows: context collapse, modality mismatch, and fusion failure — a technical diagnostic diagram

    Understanding how multimodal workflows fail is as important as understanding how they succeed. Three failure modes account for the majority of production breakdowns, and all three are architectural — not model — problems.

    Failure Mode 1: Context Collapse

    Context collapse happens when a workflow converts rich multimodal inputs into text before passing them to the model. An engineer receives a PDF with embedded charts, screenshots, and tabular data. Instead of letting the model process the visual elements natively, the pipeline runs OCR on the document, converts everything to text, and sends that text to the LLM. The chart data becomes garbled ASCII approximations. The spatial relationships in tables are destroyed. The model reasons about a degraded representation of the original information.

    Context collapse is insidious because it doesn’t cause obvious errors — it causes subtle accuracy degradation that’s hard to attribute to a root cause. Systems affected by context collapse will work well enough to pass initial testing but underperform at scale on edge cases that depend on visual or structural nuance.

    The fix is upstream: redesign the ingestion pipeline to preserve modality-native representations and pass them directly to a model capable of processing them without text conversion. This requires a perception layer built with native multimodal handling — not retrofitted OCR.

    Failure Mode 2: Modality Mismatch

    Modality mismatch occurs when different data streams about the same event are misaligned — either temporally (captured at different times) or semantically (described using different schemas or classification systems).

    A concrete example: a logistics company deploys a workflow that cross-references delivery video footage with the corresponding delivery confirmation form. The footage uses a timestamp from the camera’s local clock; the form uses a server-side timestamp from the delivery management system. A two-minute drift between these clocks means the system consistently correlates the wrong footage with the wrong form — an error that produces plausible-looking but incorrect outputs.

    More subtle mismatch occurs with semantic schema drift: an image classifier that labels damaged packaging as “condition: poor” while the warehouse management system uses a three-tier scale of “acceptable / marginal / reject.” If the middleware mapping between these schemas is inconsistent, the multimodal fusion layer works with incommensurable inputs.

    The fix requires building explicit synchronization and schema validation into the perception layer, not assuming that data from different systems will naturally align. Sub-millisecond timestamp precision standards need to be enforced at ingestion, and semantic mappings need to be version-controlled and audited.

    Failure Mode 3: Fusion Failure

    Fusion failure happens when the integration architecture between modalities is too simple for the complexity of the relationship between them. The most common manifestation: treating modality fusion as a simple concatenation — appending image embeddings to text embeddings and hoping the model figures out the relationship.

    Cross-attention fusion, by contrast, allows each modality’s representation to actively query and attend to features in other modalities — enabling genuinely joint reasoning rather than parallel processing with a naive merge at the end. Systems that use concatenation-style fusion consistently underperform on tasks requiring cross-modal reasoning, which is most of the interesting cases.

    Fusion failure is also common when organizations use a single fusion strategy for all use cases. An early-fusion architecture works well for video + audio synchronization but poorly for text + image when the image and text are about the same topic but arrive at different times and reliability levels. Building a monolithic fusion layer is an architectural bet that rarely pays off at scale.

    Choosing Your Modality Stack: A Practical Decision Framework

    Decision framework comparing GPT-4o, Claude 3.7 Sonnet, and Gemini 2.0 for enterprise multimodal AI workflows — benchmark scores and use case routing

    Model selection is not a one-time decision. In 2026, the most sophisticated multimodal workflows use model routing — dynamically selecting different models depending on the type of input, the required output precision, and the acceptable cost envelope for that specific task. Single-model architectures are increasingly a liability rather than a simplification.

    The Task-Specificity Principle

    No single model leads universally on all multimodal tasks. GPT-4o’s 94.2% score on diagram understanding makes it the clear choice for engineering drawing analysis, but Claude’s superior performance on structured document extraction and long-context reasoning makes it a better fit for legal review workflows processing dense contracts with embedded tables and cross-references.

    Before selecting a model, audit your workflow’s task distribution:

    • High-volume, low-complexity tasks (document classification, simple image tagging): Favor cheaper, faster models. Gemini 2.0 Flash or GPT-4o mini deliver acceptable accuracy at significantly lower cost-per-token.
    • Moderate complexity, mixed-modality tasks (customer complaint triage combining text, image, and transaction history): GPT-4o’s broad ecosystem integration makes it the pragmatic choice.
    • High-precision, document-heavy tasks (compliance auditing, legal review, technical specification extraction): Claude’s 200K context window and precision-first architecture outperforms alternatives in benchmark and production settings.
    • High-volume Google ecosystem tasks (Gmail processing, Google Docs summarization, Google Cloud data pipelines): Gemini’s native integration removes an entire infrastructure layer and reduces both latency and cost.

    Building a Multi-Model Router

    Platforms like Clarifai, LiteLLM, and custom orchestration layers built on LangGraph or CrewAI are enabling multi-model routing in production. The router receives an incoming task, classifies it by modality mix and complexity, and dispatches to the appropriate model. This pattern achieves two things simultaneously: it reduces cost (routing simple tasks to cheaper models) and improves accuracy (routing complex tasks to more capable ones).

    The practical catch: multi-model routing introduces latency at the classification step and requires that each model’s output format be normalized by a reconciliation layer before downstream consumption. Factor both costs into your architecture before committing.

    Build vs. Buy: The Vendor Lock-In Reality

    Every major cloud provider now offers managed multimodal AI services: Azure AI (GPT-4o via Azure OpenAI), Google Cloud Vertex AI (Gemini), AWS Bedrock (Claude, plus others). These managed services reduce infrastructure overhead dramatically — but they also create lock-in that becomes painful when a competitor model leapfrogs your vendor’s offering.

    The hedge: architect your perception and action layers to be model-agnostic from the start, even if you’re deploying with a single vendor initially. The reasoning layer integration points should abstract away model-specific APIs so that swapping the underlying model doesn’t require rebuilding the entire workflow.

    Building the Data Pipeline: The Unglamorous Part That Determines Everything

    Multimodal AI pipelines fail at the data layer far more often than at the model layer. The model is the least likely component to be the bottleneck. The data pipeline — how data is ingested, stored, preprocessed, and served to the model — is where most production-grade multimodal workflows encounter their worst problems.

    Storage Architecture for Mixed Modalities

    Different modality types have fundamentally different storage requirements:

    • Images and video live best in object storage (S3, Azure Blob, Google Cloud Storage). High-resolution images are large; storing them in relational databases kills performance.
    • Audio is similar to video — object storage with metadata in a relational or NoSQL layer for queryability.
    • Time-series sensor data requires purpose-built time-series databases (InfluxDB, TimescaleDB) for efficient range queries at scale.
    • Text and structured data fit traditional relational or document databases, but unstructured text for retrieval augmentation needs vector storage (Pinecone, Weaviate, pgvector, or Databricks Mosaic AI Vector Search).
    • Embeddings — the vector representations that the model produces during processing — need their own vector index, updated continuously as new data arrives.

    Multimodal workflows that try to fit all modalities into a single storage system consistently underperform. The data engineering overhead of purpose-built storage per modality type is not optional complexity — it’s the baseline infrastructure that makes everything else work.

    Handling Noisy and Missing Data

    In real-world production environments, inputs are never clean. Cameras go offline. Sensors malfunction. Documents arrive with missing pages. Audio has background noise that degrades transcription quality. Multimodal workflows that aren’t designed for graceful modality degradation will fail in production in ways they never encountered in testing — because test data is almost always cleaner than production data.

    The engineering principle here is called Missing Modality Robust Learning (MMRL). The practical implementation: for every workflow, explicitly design the fallback behavior when each modality is unavailable. What happens if the image is missing? If the audio transcription confidence score falls below threshold? If the sensor data stream drops? Systems with explicit degradation policies surface these events cleanly — routing to human review — rather than silently producing low-confidence outputs that downstream systems treat as reliable.

    Observability: You Cannot Fix What You Cannot See

    Multimodal pipelines need observability instrumentation at every layer — not just at the final output. At minimum, track:

    • Ingestion completeness by modality (what percentage of expected inputs actually arrived?)
    • Preprocessing error rates by modality and data source
    • Model confidence scores per output, tagged by input modality mix
    • Latency percentiles at each layer (p50, p95, p99)
    • Downstream system integration error rates

    Prometheus/Grafana stacks work well for operational metrics. For AI-specific observability — tracking confidence distributions, detecting model drift, flagging unusual input patterns — purpose-built tools like Arize AI, WhyLabs, or Evidently AI add the layer that general infrastructure monitoring tools miss.

    Human-in-the-Loop Design: When to Trust the Machine

    Escalation architecture decision flowchart: confidence-score routing to auto-execute, HITL approval, or HOTL audit paths in multimodal AI workflows

    The question of when a multimodal AI workflow should execute autonomously and when it should escalate to human review is not a philosophical debate — it’s a design decision that should be made explicitly, documented, and version-controlled. Most production failures in agentic AI systems trace back to this decision being left implicit.

    The Three Oversight Models

    There are three established oversight architectures for production AI systems, and each is appropriate for different risk profiles:

    • Human-in-the-Loop (HITL): A human approves every consequential decision before execution. Appropriate for high-stakes, low-volume workflows — regulatory filings, medical diagnosis support, financial fraud determinations. HITL provides maximum oversight but doesn’t scale to high-volume automation.
    • Human-on-the-Loop (HOTL): The AI executes autonomously but all decisions are logged and surfaced for periodic human review. Appropriate for moderate-risk, high-volume workflows — procurement approvals within pre-approved budget ranges, customer tier classification, content moderation decisions with appeal pathways.
    • Human-in-Command (HIC): The AI operates fully autonomously, with humans retaining only the ability to override or shut down. Appropriate only for low-risk, highly structured workflows with tight operational guardrails and extensive prior validation data.

    Confidence Thresholds and Auto-Escalation

    The practical implementation of any oversight model depends on a confidence threshold system. The most common pattern: model outputs include a confidence score (or can be prompted to generate one). Outputs above an 85% confidence threshold proceed autonomously; outputs below this threshold trigger escalation. The threshold should be calibrated per use case and per modality mix — a workflow processing clean, high-resolution images from a controlled factory environment can use a higher confidence threshold than one processing variable-quality customer-submitted photos.

    Beyond confidence scores, explicit escalation triggers should include:

    • Modality conflict: When different input modalities suggest contradictory conclusions (the image looks fine but the sensor anomaly is severe), escalate regardless of confidence score.
    • Out-of-distribution inputs: When the input characteristics fall outside the distribution of training or validation data, the model’s confidence score may be unreliable even when it appears high.
    • High-consequence action scope: Any action that crosses a pre-defined consequence threshold (financial value, irreversibility, regulatory exposure) should require human approval regardless of model confidence.

    Governance-as-Code and Regulatory Compliance

    The EU AI Act entered full applicability in August 2026, with fines of up to €40 million or 7% of global turnover for violations involving high-risk AI systems. Multimodal AI workflows processing health data, making decisions affecting employment, or operating in critical infrastructure are explicitly classified as high-risk under this framework.

    The operational response is governance-as-code: encoding decision rules, escalation thresholds, audit requirements, and human review protocols directly into the workflow infrastructure — not into policy documents that nobody reads. Tools like OPA (Open Policy Agent) and enterprise-grade MLOps platforms (MLflow with governance extensions, SageMaker Clarify, Vertex AI Model Registry) enable this. The audit trail isn’t a report generated quarterly — it’s a live, queryable log of every decision, with the input that produced it and the human override status.

    Industry-Specific Workflow Blueprints

    The three-layer architecture applies universally, but the specific modality combinations, fusion strategies, and escalation protocols differ substantially by industry. Here are three production-relevant blueprints based on documented deployments.

    Manufacturing: The Closed-Loop Quality Workflow

    Modalities involved: visual (camera images of components), acoustic (vibration/sound sensors on machinery), and textual (maintenance logs, specification documents).

    The workflow: Components pass a camera array. Computer vision encoders detect surface defects, dimensional deviations, and color anomalies. Simultaneously, acoustic sensors on the production machinery capture vibration signatures that correlate with tool wear. The reasoning layer fuses visual inspection results with acoustic anomaly scores and cross-references both against maintenance log records documenting recent tool changes. A defect flagged by vision alone gets compared against whether the acoustic signature changed at the same time a tool was replaced — allowing the system to distinguish between a machine problem and a batch-specific material issue.

    Results from documented deployments: visual inspection alone achieves 70–80% defect detection accuracy. Fusing vision with acoustic and maintenance log data pushes this above 95%, while reducing false positives by 40–60%. Siemens’ AI-powered production workflow delivered a 15% reduction in production time and a 99.5% on-time delivery rate. Predictive maintenance applications in manufacturing have documented 300–500% ROI over three-year periods, with 35–45% reductions in unplanned downtime.

    Healthcare: The Clinical Decision Support Workflow

    Modalities involved: medical imaging (X-rays, MRI, CT), electronic health records (structured text), and clinical notes (unstructured text, sometimes dictated audio converted to text).

    The workflow: An incoming patient encounter triggers ingestion of all available modalities — current imaging, historical imaging for comparison, structured EHR data (lab values, medication list, vital signs), and physician voice-dictated notes. The reasoning layer fuses these signals to surface relevant findings, flag contradictions between modalities (an image finding inconsistent with the documented symptom history), and generate a structured summary for the reviewing clinician. The system operates in HITL mode: it generates recommendations but the clinician makes and documents all final decisions.

    The modality alignment challenge here is acute: imaging timestamps often reflect scan acquisition time while EHR records use documentation timestamps, and the drift between them can be clinically significant. Healthcare multimodal deployments that solve this alignment problem have demonstrated meaningful diagnostic accuracy improvements and significant reductions in the time physicians spend on chart review before patient encounters.

    Logistics: The Intelligent Parcel Workflow

    Modalities involved: video (facility cameras, delivery cameras), GPS/location data (structured), and document images (shipping labels, customs forms, invoices).

    The workflow: As parcels move through a logistics facility, video feeds track package handling and condition. OCR-multimodal models process shipping label images — not just reading text, but interpreting label damage, barcode obscuring, and weight sticker placement. GPS streams provide location context. When a package arrives at a customs checkpoint, the system fuses the physical condition assessment from video with the declared value from the invoice document image and the route history from GPS — identifying discrepancies that warrant further inspection.

    UPS’s ORION routing system, which uses multimodal optimization combining route data, delivery instructions, and real-time constraints, saves over $400 million annually. DHL’s warehouse AI deployment achieved a 30% efficiency improvement. Protex AI’s deployment of visual multimodal AI across 100+ industrial sites and 1,000+ CCTV cameras achieved 80%+ incident reductions for clients including Amazon, DHL, and General Motors — demonstrating that edge-scale multimodal deployment is operational today.

    The ROI Reality Check: Numbers Worth Actually Tracking

    Multimodal AI ROI by industry 2026 data — manufacturing 300-500% ROI, healthcare 150-300%, logistics 200-400% with supporting statistics

    ROI ranges for multimodal AI implementations are real but heavily deployment-specific. The numbers that get cited in vendor materials represent best-case outcomes in well-executed, mature deployments — not what a first implementation will deliver in year one.

    What the Numbers Actually Represent

    • Predictive maintenance: 300–500% ROI over three years, with 5–10% reduction in maintenance costs and 30–50% reduction in unplanned downtime. These numbers assume the baseline is reactive maintenance with high unplanned outage costs. Organizations with already-mature preventive maintenance programs will see a smaller delta.
    • Visual quality control: 200–300% ROI, with accuracy improvements from 70–80% (manual inspection) to 97–99% (AI-assisted inspection). The ROI calculation includes the cost reduction from catching defects earlier in the production cycle, not just the accuracy improvement itself.
    • Logistics and supply chain optimization: 150–457% ROI over three years, depending on starting state. 20–50% inventory reduction and 30–50% throughput improvements are achievable — but only after the data pipeline and integration work is complete, which takes meaningful time and upfront investment.

    The Hidden Costs Most ROI Models Ignore

    Standard ROI models for AI automation typically account for model licensing costs and some implementation labor. They systematically underestimate:

    • Data pipeline infrastructure: Purpose-built storage per modality, streaming ingestion infrastructure, real-time synchronization systems. For large deployments, this infrastructure can exceed model licensing costs by 2–3×.
    • Human review labor during calibration: HITL workflows during the initial deployment period require significant human review time to generate the labeled data that calibrates confidence thresholds. This is a real labor cost that typically isn’t in the initial business case.
    • Observability tooling: AI-specific monitoring, model drift detection, confidence score dashboards. These are ongoing operational costs, not one-time implementation costs.
    • Retraining cycles: Production environments change. Camera angles shift, sensor calibration drifts, document formats evolve. Models need periodic retraining to maintain performance, which carries both compute cost and engineering labor cost implications.

    Payback Period Reality

    Documented payback periods for well-executed multimodal AI deployments range from 3–12 months for narrow, well-defined use cases (a single quality inspection station, a specific document processing workflow) to 18–36 months for enterprise-wide, multi-department deployments. Projects that try to boil the ocean — implementing multimodal AI across five departments simultaneously — consistently run longer, cost more, and deliver the worst unit economics. The fastest payback comes from targeting the single workflow with the highest combination of current error rate, high consequence per error, and high volume of decisions.

    From Pilot to Production: The 5 Decisions That Determine Success

    Most multimodal AI pilots succeed. Most multimodal AI production deployments disappoint. The gap is not technical — it’s architectural and organizational. Five decisions, made explicitly at the right time, separate the projects that scale from the ones that stay in pilot indefinitely.

    Decision 1: Define Data Governance Before Selecting Models

    Data governance decisions — who owns each modality’s data, what access controls apply, how long data is retained, what privacy requirements govern processing — constrain your architectural choices more than model capabilities do. A healthcare workflow that cannot retain patient images for model training due to HIPAA requirements needs a fundamentally different architecture than one where retention is unrestricted. Making governance decisions after model selection leads to expensive rearchitecting.

    Decision 2: Build the Observability Stack Before Going Live

    Organizations that go live without observability instrumentation spend their first six months in production debugging blindly. Every multimodal workflow needs per-modality confidence tracking, input quality monitoring, and downstream accuracy validation before the first production decision is made — not after you notice something is wrong.

    Decision 3: Test Modality Degradation, Not Just Happy-Path Performance

    Production testing of multimodal systems should include systematic degradation testing: What happens when image quality drops? When audio has significant background noise? When 20% of sensor readings are missing? Systems that perform well only on clean inputs are not production-ready, regardless of how impressive their benchmark scores are on curated test sets.

    Decision 4: Map Skill Gaps Before Committing to Architecture

    Multimodal AI workflows require a broader skill set than text-only AI implementations. Specifically: computer vision engineering (distinct from NLP), signal processing for audio and sensor data, data pipeline engineering for mixed-modality storage, and MLOps practitioners familiar with multi-model routing. Organizations that commit to architectures requiring skills they don’t have — or plan to hire for after implementation begins — consistently miss timelines and budgets.

    Decision 5: Negotiate Model-Agnostic Contracts

    The multimodal AI landscape is moving faster than most enterprise procurement cycles. A model that leads benchmarks today may be two generations behind in 18 months. Contracts with cloud providers and AI vendors should include explicit provisions for model swapping, exit data portability, and inference cost renegotiation triggers. This is not standard in vendor-proposed terms — it requires deliberate negotiation.

    What’s Next: Edge Deployment and Real-Time Multimodal Agents

    Edge-deployed multimodal AI in an industrial facility with real-time AI vision overlays, sensor data readouts, and sub-50ms latency edge inference node

    Two developments will define the next phase of multimodal AI in automation workflows: edge deployment and autonomous multi-agent orchestration. Both are moving from planning-stage concepts to production-scale reality faster than most enterprise roadmaps anticipated.

    Edge Inference: Bringing Multimodal AI to the Data Source

    The current dominant pattern — cloud-based inference for most enterprise multimodal AI — has latency limitations that make it unsuitable for real-time physical processes. A manufacturing quality control system that takes 800ms to get a cloud inference result cannot run on a production line moving at 120 components per minute. Edge deployment — running multimodal inference directly on hardware at the data source — eliminates this constraint.

    Edge deployment in 2026 is enabled by a new generation of purpose-built edge AI hardware (NVIDIA Jetson Orin, Qualcomm Cloud AI 100) and by model distillation techniques that compress larger multimodal models into smaller versions that run efficiently on constrained hardware without catastrophic accuracy loss. The tradeoff: edge-deployed models update less frequently, require more careful hardware lifecycle management, and have constrained context windows compared to cloud-based counterparts.

    Protex AI’s deployment of visual multimodal AI across 100+ industrial sites and 1,000+ CCTV cameras — achieving 80%+ incident reductions for clients including Amazon, DHL, and General Motors — demonstrates that edge-scale multimodal deployment is not a future concept. It is operational infrastructure today.

    Autonomous Multi-Agent Orchestration

    The next architectural evolution is multi-agent systems where specialized agents — each optimized for a specific modality or task — collaborate autonomously on complex workflows. An orchestrator agent receives a high-level task (audit this facility’s safety compliance from last week’s camera footage and incident reports). It decomposes the task and dispatches to a vision agent (process video footage), a document agent (extract data from incident report PDFs), and a reasoning agent (synthesize findings into a structured compliance report). The orchestrator manages sequencing, handles agent failures, and determines when human escalation is needed.

    Current data suggests that multi-agent systems achieve 45% faster problem resolution and 60% more accurate outcomes compared to single-agent architectures. However, fewer than 10% of enterprises that start with single agents successfully implement multi-agent orchestration within two years. The prerequisite is organizational and operational maturity, not just technical capability. Attempting multi-agent orchestration before individual agents are stable and well-monitored in production is one of the most reliable ways to make a complex system dramatically more complex to debug.

    Building Workflows That Actually Perceive

    The organizations getting disproportionate returns from multimodal AI in 2026 share a specific characteristic: they designed their workflows around the full signal of the problem — not just the part that was easy to digitize first.

    Text was the first modality to be fully digested by AI automation. It was accessible, and the returns from text-only automation were real. But the real world is not a text file. It is a simultaneous stream of visual information, acoustic cues, sensor readings, spatial coordinates, and natural language — and the most consequential decisions in operations, healthcare, logistics, and manufacturing depend on reasoning across that full signal.

    Multimodal AI workflows are the architectural response to that reality. But the implementation details are where these projects succeed or fail. Getting the perception layer right — preserving modality-native signals instead of collapsing them into text. Building fusion architectures that reflect actual signal relationships rather than applying a universal strategy. Designing escalation logic that is explicit, version-controlled, and calibrated to actual risk levels. Running the data pipeline with purpose-built infrastructure for each modality type. Testing for degradation, not just clean-data performance.

    None of this is glamorous. All of it is what separates a multimodal AI workflow that works in production from one that works impressively in a controlled demo and quietly underperforms in the real world.

    Key Takeaways for Practitioners

    • Design your workflow architecture before selecting models. The modality stack, fusion strategy, and escalation logic are more consequential than which underlying model you use.
    • Build purpose-built storage infrastructure for each modality type. Trying to fit images, audio, time-series data, and text into a single storage system is a consistent source of production failure at scale.
    • Test for modality degradation systematically. Production data is dirtier than test data. Workflows that aren’t built for graceful degradation will fail on the cases that matter most.
    • Negotiate model-agnostic contracts with vendors. The multimodal model landscape is moving faster than procurement cycles. Lock-in that feels manageable today will feel expensive in 18 months.
    • Target the single highest-value workflow for your first deployment. Fastest payback, clearest learning, and organizational proof-of-concept all favor narrow-then-scale over wide-then-optimize.
    • Implement governance-as-code before going live. The EU AI Act’s full applicability in August 2026 makes this a legal requirement for high-risk systems — but it’s sound engineering practice regardless of regulatory jurisdiction.
  • Snap’s AI Code Revolution: What the 65% Stat Really Means for Your Engineering Team

    Snap’s AI Code Revolution: What the 65% Stat Really Means for Your Engineering Team

    Split composition showing traditional large engineering team versus small AI-augmented squad with 65% AI-generated code stat overlay

    On the morning of April 15, 2026, Evan Spiegel sent a memo to Snap’s global workforce that would ripple through every engineering leader’s inbox within hours. One thousand jobs — 16% of the company’s entire headcount — were being eliminated. Three hundred additional open roles were closed before the first applicant ever interviewed. The reason Spiegel cited wasn’t a revenue miss, a strategic pivot, or a board mandate to cut burn. It was something far more consequential: artificial intelligence now generates 65% of all new code written at Snap.

    He called it a “crucible moment.” The market called it an 8% stock pop. The engineering world called it a warning shot.

    But here’s what got lost in the noise of the layoff headlines: the actual mechanics of how Snap got to 65% AI-generated code, why that number matters far more than the layoff count, and — critically — what it would take for a mid-sized engineering team to replicate that kind of output without the collateral damage of mass restructuring.

    This isn’t a story about job cuts. It’s a story about a fundamental rewiring of how software gets built. If you run, manage, or work inside an engineering organization in 2026, Snap’s April announcement is the most important competitive benchmark you haven’t fully stress-tested yet. Here’s what it actually means — and what you should do about it.

    The Numbers Behind the Headlines: Snap’s 65% Stat Unpacked

    Infographic showing Snap's April 2026 announcement: 1,000 jobs cut, 16% of workforce, 65% AI-generated code, $500M+ annual savings

    Sixty-five percent sounds dramatic. But context matters enormously here, and the industry data around it tells a story that most breathless news articles ignored entirely.

    Where Snap Fits in the Broader Industry Picture

    According to 2026 market research, 41% of all enterprise code is now AI-generated across the industry, up from roughly 20% in early 2024. The AI coding tools market has grown to $12.8 billion in 2026 — more than double its $5.1 billion valuation in 2024. Eighty-two percent of developers now use AI tools weekly, and among elite-tier engineering teams, AI-assisted code share sits between 60% and 75%. Snap, at 65%, isn’t an outlier. It’s a bellwether: a large-scale proof that what top-performing teams achieve individually can be institutionalized company-wide.

    What makes Snap’s 65% figure different from a developer who just leans heavily on autocomplete is scope. The AI generation isn’t limited to boilerplate or unit tests. According to details from Spiegel’s memo and subsequent reporting, AI-generated code is running across Snapchat+ subscription features, the advertising platform’s infrastructure, Snap Lite builds, and core backend engineering tasks. This is production-grade, revenue-critical code — not a side experiment.

    The Financial Architecture of the Decision

    The math Snap is working with is brutal and clear. Prior to the April restructuring, Snap employed approximately 5,261 full-time staff globally. With 1,000 jobs cut and 300+ open roles closed, the company targets over $500 million in annualized cost savings by the second half of 2026. At the same time, Snap absorbed $95–130 million in pre-tax charges in Q2 2026, primarily from severance. That’s the short-term cost of a long-term structural shift toward net-income profitability.

    For engineering leaders watching from the outside, the question isn’t whether Snap’s trade-off was the right one ethically. The question is whether the productivity math actually works — and the evidence suggests that for Snap’s specific operating context, it does. The company has not reported a corresponding slowdown in product velocity. Snapchat+ sits at 24 million subscribers and climbing. Ad platform performance metrics are improving. The lights are on, and the team is smaller.

    What “AI-Generated” Actually Means

    One nuance worth drawing sharply: “AI-generated” does not mean “AI-autonomous.” At Snap’s scale and in 2026’s tooling landscape, AI-generated code still requires human engineers to prompt, review, test, and approve it. The workflow isn’t engineers watching a robot build a product. It’s engineers functioning as directors and architects — writing specifications, evaluating outputs, catching edge cases, and steering system design — while AI agents handle the volume work of implementation. The 65% number represents the authorship share of code, not the supervision share. That distinction matters enormously when you start thinking about how to replicate the model.

    Small Squads, Big Output: How Snap’s Organizational Strategy Actually Works

    Diagram showing small core squad of 4 engineers surrounded by AI agent types: Code Generation, PR Review, Bug Triage, Test Coverage, Infrastructure — with velocity metrics showing 60% more PRs and 8-hour PR cycles

    Inside the memo and the subsequent investor context that emerged in the weeks following the announcement, the operational concept Snap keeps returning to is “small squads.” This is more than a headcount euphemism. It’s a specific thesis about how teams at software companies should be organized when AI tools are operating at their current capability level.

    The Small Squad Model: What It Looks Like in Practice

    A traditional Snap product squad might have included four to six engineers, a product manager, a designer, and potentially a data analyst — perhaps eight to ten people total driving a feature area. Under the small squad model, that same feature area might be staffed with two to three senior engineers and a product lead, with AI agents operating as persistent collaborators on code generation, PR review, bug triage, and test coverage.

    Industry benchmarks support the viability of this structure. Elite-tier teams using AI coding tools in 2026 are achieving 60% more pull requests per engineer, with PR cycle times under eight hours compared to multi-day turnarounds in non-AI workflows. Individual developers are reclaiming five to eight hours per week that were previously consumed by repetitive implementation work. When you stack those gains across a small, highly senior team, the throughput math competes credibly with a much larger junior-heavy squad.

    The Role of Spec-Driven Engineering

    One of the less-reported keys to making small squads actually work at scale is what engineers and consultants are calling spec-driven engineering. AI coding agents perform exponentially better when they receive precise, well-structured specifications rather than loose prompts. This means that in a true small-squad model, engineers are spending significantly more time upfront writing rigorous technical specs — defining inputs, outputs, edge cases, architecture constraints, and acceptance criteria — before AI agents begin generating code.

    This shift fundamentally changes who is valuable on an engineering team. The developer who was previously valued for writing 500 lines of feature code per day becomes less central. The developer who can architect a system clearly enough to write a specification that AI can execute reliably becomes irreplaceable. Snap’s decision to primarily target product managers and partnership roles in the April layoffs — rather than senior engineers — is consistent with this dynamic.

    AI Agents Across the Full SDLC

    Snap’s efficiency gains aren’t limited to code generation at the implementation layer. Across the software development lifecycle (SDLC), AI tools are compressing timelines at multiple stages. Teams using integrated AI workflows in 2026 report 47% faster pull request reviews and 62% faster bug triage. Test generation — historically one of the most time-consuming and lowest-prestige tasks in software engineering — has been largely handed to AI agents. Infrastructure configuration, documentation drafting, and even code refactoring are all areas where AI authorship has meaningfully replaced human hours. The small squad isn’t smaller because it’s doing less. It’s smaller because AI has absorbed the volume work, leaving the humans to do the high-judgment work.

    The Tool Stack Driving It All: Cursor, Claude Code, GitHub Copilot, and Windsurf

    Comparison chart of AI coding tools: Claude Code for architecture, Cursor for multi-file speed, GitHub Copilot for enterprise, Windsurf for agentic workflows — with PR throughput lift comparison bars

    Snap hasn’t publicly named every tool in its AI coding stack, but reporting and industry context make the likely composition reasonably clear. Understanding which tools drive the 65% figure — and how they differ — is critical for any team trying to replicate the model rather than just benchmark against it.

    Claude Code: The Architecture Leader

    As of early 2026, Claude Code (Anthropic’s coding-focused AI) has emerged as the market leader for complex, architectural-level coding tasks. Ninety-five percent of engineers using it report doing so weekly for at least half their work. Its strength is agentic pull requests — situations where the AI doesn’t just autocomplete a line but autonomously generates, tests, and submits a full PR based on a specification. For companies like Snap where the engineering team is doing complex, multi-system work on advertising infrastructure and consumer apps simultaneously, Claude Code’s ability to handle architectural changes without requiring constant human hand-holding makes it uniquely suited to the small-squad model.

    Cursor: The Throughput Engine

    Cursor reached $1 billion in annual recurring revenue in 2025 — a figure that would have seemed impossible for a developer tool a few years prior — and its growth trajectory has continued into 2026. Its edge is raw throughput on multi-file editing. Where some AI tools struggle with context across a large codebase, Cursor maintains coherence across multiple files simultaneously, making it particularly effective for refactoring sessions, cross-module feature work, and high-velocity iteration cycles. Enterprise teams report 60% more PRs per engineer per week when Cursor is the primary tool. At $40 per user per month for the Business tier, it’s also one of the better-value options at team scale — the ROI math tends to close quickly against the cost of a single additional engineering hire.

    GitHub Copilot: The Enterprise Default

    With 1.8 million developers and more than 50,000 organizations using it in 2026, GitHub Copilot remains the default AI coding tool for enterprises that need SOC 2 compliance, deep GitHub integration, and organization-wide governance from day one. Ninety percent of the Fortune 100 uses it. It’s not the highest-ceiling option in the stack — its autocomplete-focused design means it generates less autonomous output than Claude Code or Cursor — but for teams that need to start somewhere with low friction and auditable usage, Copilot is the practical foundation. Many high-performing teams run Copilot organization-wide as a baseline and use Cursor or Claude Code for more complex work.

    Windsurf: The Agentic Workflow Specialist

    Windsurf (formerly Codeium’s premium tier) has carved out a distinct position in 2026 as the tool best suited for agentic workflows — situations where you want an AI agent to complete an extended, multi-step engineering task with minimal interruption. This is particularly relevant for the kind of infrastructure work Snap is doing: setting up data pipeline configurations, managing deployment scripts, and handling the operational engineering tasks that are important but don’t require a senior engineer’s creative judgment. Teams using Windsurf in agentic mode report some of the most significant time savings on the infrastructure side of the SDLC.

    The Multi-Tool Reality

    The practical reality for most engineering teams is that no single tool wins across every use case. Best practice in 2026 involves selecting one to two primary coding agents paired with an analytics platform to track ROI, then layering specialist tools for specific workflow stages. The anti-pattern to avoid is tool proliferation — every engineer running a different AI tool with no standardization, no shared prompt libraries, and no common measurement framework. That approach produces anecdote rather than compound organizational learning.

    Infrastructure Beyond Code: Snap’s GPU and Data Processing Transformation

    The AI-generated code story at Snap doesn’t exist in isolation. It’s part of a broader engineering infrastructure transformation that has been running in parallel — and understanding both threads explains why Snap’s efficiency gains are structural rather than cosmetic.

    The NVIDIA cuDF Deployment

    Alongside its AI coding adoption, Snap deployed NVIDIA cuDF on Apache Spark via Google Cloud, using GPU acceleration to fundamentally change how its data infrastructure operates. The results are striking: 4x faster runtime for petabyte-scale data processing and 76% reduction in daily processing costs. The GPU requirement for A/B testing dropped from 5,500 concurrent units to 2,100 — a 62% reduction in compute footprint for the same analytical output.

    For context, Snap runs over 6,000 metrics per A/B test. The ability to process petabyte-scale datasets in hours rather than days isn’t just an infrastructure win; it directly enables the small-squad model. A team of four engineers running hundreds of product experiments needs to get results fast. When data processing takes days, you need more analysts to manage the pipeline. When it takes hours, you don’t.

    Why Infrastructure Efficiency Enables Headcount Efficiency

    This is the part of Snap’s story that tends to get separated from the AI coding narrative but belongs with it. The $500 million in annualized savings Snap is targeting comes from a combination of headcount reduction and infrastructure cost reduction running simultaneously. Engineering teams that are trying to replicate Snap’s model by only adopting AI coding tools — without also rethinking their data infrastructure, compute costs, and operational overhead — will capture only a fraction of the available efficiency.

    The real lesson from Snap isn’t “replace engineers with AI.” It’s “build an engineering organization where every layer — human, code, infrastructure, and data — is running at its most efficient configuration simultaneously.” The AI coding adoption is the most visible layer, but it’s one of four or five levers being pulled in concert.

    What the “AI Washing” Critics Get Right (and Wrong)

    The April announcement triggered an immediate and pointed debate in the tech industry. Critics — many of them engineers who had just watched colleagues receive termination notices — argued that Snap’s AI-generated code framing was “AI washing”: using AI’s momentum as a palatable narrative for what is ultimately a financial restructuring dressed up in technology language.

    The Strongest Version of the Criticism

    The critique has real merit in several areas. First, trackers noted that a significant portion of Snap’s April cuts targeted product managers and partnership roles — not software engineers. If 65% of code is AI-generated and the layoffs are primarily in non-engineering functions, the causal chain between “AI codes more” and “these specific people lose their jobs” is less direct than Spiegel’s memo implied.

    Second, the AI-washing concern is broader than Snap. Analysis of tech layoffs through mid-April 2026 found approximately 99,283 job cuts across the sector, with 47.9% attributed to AI based on public company statements — but those attributions were based on what executives said, not on verified productivity data. Block (formerly Square), under Jack Dorsey, attracted significant criticism in February 2026 when it cited “intelligence tools” to justify 4,000 layoffs, despite the company having over-hired significantly during the COVID boom and experiencing a 40% stock drop unrelated to AI productivity.

    Third, the quality risks in AI-generated code are real and documented. Research in 2026 found that AI-generated code produces 1.7 times more major bugs and carries a 2.74 times higher vulnerability rate than human-written code under equivalent conditions. Companies rushing to hit a headline AI-code percentage without robust review infrastructure are trading a headcount problem for a code quality problem — which tends to be more expensive to fix downstream.

    What the Critics Get Wrong

    That said, dismissing Snap’s transformation as pure financial theater ignores the substantive engineering reality. The productivity gains from AI coding tools are well-documented and measurable — not theoretical. GitHub’s own research has consistently shown 15–34% productivity improvements from Copilot at scale. Cursor data shows 60% more PRs per engineer per week. Claude Code’s adoption rate among professional engineers (95% weekly usage for half of all work) reflects genuine utility, not marketing.

    More importantly, the companies that dismiss the AI coding shift as hype are the ones most likely to find themselves at a serious competitive disadvantage within 18 months. Whether the specific framing around any given layoff announcement is honest or performative, the underlying productivity dynamics are real. Skepticism about the narrative is warranted. Skepticism about the technology is not.

    The Playbook for Replicating Snap’s Approach at Your Company

    4-phase AI adoption roadmap: Phase 1 Pilot weeks 1-4, Phase 2 Measure weeks 5-8, Phase 3 Scale weeks 9-16, Phase 4 Optimize weeks 17+

    Most engineering leaders reading about Snap’s 65% figure are not running a 5,000-person tech company with the capital to absorb $95–130 million in severance charges. The question isn’t how to replicate Snap’s restructuring. It’s how to replicate the capability that enabled it — an engineering organization genuinely running at higher output per person — regardless of your current team size or structure.

    Phase 1: The Constrained Pilot (Weeks 1–4)

    Start with one team, one tool, and a clearly defined measurement framework before touching anything else. Select a squad of three to five engineers who are already technically strong and open to changing their workflow. Deploy a single AI coding tool — Claude Code or Cursor for most teams; GitHub Copilot for organizations with strict compliance requirements. The goal in this phase is not productivity transformation. It’s baseline measurement. Track PR throughput, cycle time, and hours spent on implementation-level tasks before AI assistance. You need a before picture to measure against.

    Run this for four weeks with deliberate note-taking. What kinds of tasks is the AI handling well? Where does it slow the team down with bad suggestions or require extensive review? What does the code review burden look like on the output side? The answers to these questions will shape your Phase 2 deployment far more than any vendor benchmark can.

    Phase 2: Establish the Measurement Infrastructure (Weeks 5–8)

    Before scaling, build the measurement layer. This is the most commonly skipped step in AI coding deployments — and the most commonly regretted omission. You need visibility into:

    • AI code percentage — how much of merged code originated from AI suggestions
    • PR cycle time — time from first commit to merge
    • Code churn rate — how often newly written code is deleted or significantly rewritten within 30 days, a proxy for code quality
    • Bug introduction rate in AI-generated versus human-written code
    • Developer time savings — direct survey or time-tracking tool data

    The industry benchmark for code churn in AI-generated code is 5.7–7.1%, compared to 3–4% for experienced human developers. If your team’s AI-generated code churn is running higher, you have a prompt quality problem, a review process problem, or both — and you need to diagnose it before scaling the workflow to your full organization.

    Phase 3: Scaled Rollout with Governance (Weeks 9–16)

    Roll out across all engineering squads, but with a governance layer in place from day one. This includes: a standardized prompt library for common development patterns at your company; a code review protocol that specifically addresses AI-generated code (who reviews it, with what checklist, and what automatic rejection criteria look like for security-sensitive areas); and a shared Slack or Teams channel where engineers can share what’s working, what prompts are producing the best results for your specific codebase, and what AI is consistently getting wrong.

    The compound value in an organization-wide AI coding deployment isn’t just individual productivity gains. It’s institutional learning — each engineer’s discoveries about how to work effectively with AI feeding back into a shared knowledge base that makes the whole team faster. Organizations that skip governance typically have individual engineers who are power users and everyone else who barely uses the tools. The power users’ knowledge stays siloed, and the organization never achieves the multiplied output that Snap achieved.

    Phase 4: Multi-Agent Orchestration and the Senior-Shift (Weeks 17+)

    At the maturity end of AI coding adoption, teams stop thinking about AI as a tool individual engineers use and start thinking about AI as a layer of the engineering infrastructure. This is the multi-agent orchestration stage: code generation agents, PR review agents, test coverage agents, and infrastructure configuration agents running in concert, with human engineers serving as orchestrators rather than implementers. This is the operating model Snap is running at scale.

    Getting here requires a deliberate organizational shift. Senior engineers need to redirect a meaningful portion of their time toward writing better specifications, improving the prompts and context that AI agents receive, and building the evaluation frameworks that determine whether AI output is acceptable. This is harder to do — it requires a different kind of thinking than implementation-focused engineering — but it’s where the real productivity multiplication lives.

    Measuring What Matters: New Metrics for AI-Augmented Engineering Teams

    Traditional software engineering metrics break down badly in an AI-augmented environment. Lines of code per engineer is useless when AI can generate a thousand lines of adequate-but-not-great code in minutes. Pull requests per week can skyrocket while actual feature quality declines. Engineering leaders who try to evaluate their AI coding adoption using pre-AI KPIs will either declare false success or miss real problems.

    Metrics That Work in 2026

    AI code percentage with churn overlay: Track what percentage of merged code is AI-generated, but always view it alongside the churn rate. High AI percentage with low churn (under 5%) indicates effective integration. High AI percentage with high churn (above 7%) indicates quality problems that are generating rework overhead.

    PR cycle time: Sub-8-hour PR cycles are the benchmark for elite AI-augmented teams in 2026. If your cycle times aren’t improving meaningfully after 60 days of AI tool adoption, you have an adoption problem or a review-bottleneck problem, not a tool problem.

    Feature cycle time, end-to-end: Zoom out from PRs to full features. Track the time from specification finalization to production deployment. AI coding tools should compress this number. If they aren’t, the bottleneck has moved upstream to specification quality or downstream to QA and deployment — and that’s where your next investment should go.

    Specification completeness rate: In a spec-driven engineering environment, incomplete specs are the primary cause of poor AI output. Track how often engineering specifications have to be revised after an AI’s first pass at implementation reveals ambiguity. This is an indirect measure of your team’s spec-writing maturity — which is now a core engineering skill.

    Developer time-on-high-judgment-work: Survey engineers quarterly on what percentage of their weekly hours they’re spending on high-judgment tasks (system design, architecture decisions, complex debugging, stakeholder communication) versus low-judgment tasks (implementation, documentation, test writing). AI adoption should visibly shift this ratio. If engineers still report spending 60% of their time on implementation work after six months of AI tool deployment, adoption is shallow.

    The ROI Benchmark

    Industry data in 2026 puts the average ROI for AI coding tool adoption at 2.5–3.5x for well-run deployments, with top-quartile teams achieving 4–6x. At an industry-standard cost of $200–600 per developer per month for a multi-tool stack, a team of 20 engineers spending $4,000–$12,000 per month on AI tools should be returning $10,000–$72,000 per month in productive capacity. The break-even timeline at typical adoption rates runs 12–18 months. Companies that are still treating AI coding tools as a pilot-indefinitely experiment rather than a capital allocation decision are leaving measurable value on the table.

    The Talent Reality: Who Benefits and Who Gets Left Behind

    The human stakes of Snap’s AI coding shift extend well beyond the 1,000 people who received termination notices in April. The structural change in what makes an engineer valuable is unfolding across the entire industry, and it’s playing out at different speeds for different career stages.

    Senior Engineers: The Clear Winners (For Now)

    For senior engineers — those with strong system design skills, architectural judgment, and the ability to write precise technical specifications — the AI coding era is unambiguously good. Their comparative advantage over AI grows, not shrinks, as AI gets better at implementation. AI is excellent at writing code from a clear specification. It is not good at knowing whether the specification is the right one, whether the architecture serves the business need in three years, or whether a subtle edge case in a distributed system will cause a production incident. Those are senior-engineer skills, and they’re becoming more valuable as the implementation layer gets cheaper.

    Junior and Mid-Level Engineers: A More Complex Picture

    The picture is harder for junior and mid-level engineers. Research in 2026 projects 40–60% reductions in routine L0/L1 roles at companies moving aggressively toward AI-augmented teams. These are the roles where a developer primarily writes implementation code from a spec — precisely the function that AI now handles at high volume. The career ladder has a missing rung: the path from junior to senior used to run through years of implementation experience that built the contextual knowledge needed for architectural work. If AI absorbs the implementation work, junior developers get fewer of the repetitive reps that used to build that knowledge.

    This is a real and underappreciated problem. Companies that cut their junior pipelines to capture short-term efficiency gains may find themselves without a bench of senior engineers in four to five years. The best engineering organizations in 2026 are actively redesigning their junior developer programs to build architectural thinking and spec-writing skills from the beginning of a career, rather than treating those as skills that emerge naturally after years of implementation work.

    Product Managers and Non-Engineering Roles

    Snap’s April cuts fell heavily on product managers and partnership roles — not engineers. This tracks with a broader industry pattern: as small engineering squads gain the ability to ship more with less coordination overhead, the demand for intermediate coordination roles declines. The PMs who will thrive are the ones who write precise, testable product specifications that AI agents can act on directly. Those who add value primarily through facilitation and communication may find their role definition shifting under them faster than expected.

    Peer Pressure: How Atlassian, Pinterest, Duolingo, and Others Are Adapting

    Snap is not operating in isolation. The same forces are reshaping engineering teams across the tech industry, with different companies taking different approaches to the same underlying shift.

    Atlassian laid off approximately 1,600 employees — 10% of its workforce — in March 2026. Co-founder Scott Farquhar’s public framing was measured: he explicitly pushed back on the “AI replaces people” narrative, arguing that AI changes the efficiency of work rather than the mix of skills needed. But the financial reality is that improved productivity from AI tools does inherently reduce the number of people needed to accomplish the same output. The framing and the math are in some tension.

    Pinterest announced plans to cut 15% of its workforce in 2026, explicitly redirecting the cost savings toward AI product initiatives. Rather than framing the cuts as AI-driven, Pinterest positioned them as investment reallocation — a shift of capital from labor costs to AI tooling and infrastructure. The destination is the same; the narrative architecture is different.

    Duolingo has taken the most transparent approach: requiring managers to affirmatively demonstrate that AI cannot perform a function before approving a new hire. This is effectively a hiring-side version of Snap’s layoff-side policy. The headcount impact is the same — fewer people do equivalent work — but it arrives gradually through attrition and hiring restraint rather than through a single restructuring event. For engineering leaders managing organizations that don’t want to absorb the reputational and cultural cost of mass layoffs, Duolingo’s approach may be the more sustainable model.

    Across the sector, tech layoffs through mid-April 2026 totaled approximately 99,283 jobs, with nearly half attributed — accurately or not — to AI productivity gains. The pattern is clear: companies are using their AI coding productivity improvements to right-size their engineering organizations, whether they frame it that way or not.

    Implementation Risks: Code Quality, Security, and Organizational Debt

    Risk infographic showing AI coding risks: 1.7x more major bugs, 2.74x higher vulnerability rate in AI-generated code, and organizational risks from junior pipeline decline

    A comprehensive assessment of Snap’s AI coding model has to grapple honestly with its risks. Replicating the efficiency gains without a corresponding investment in risk mitigation is how organizations end up with a different, more expensive set of problems.

    Code Quality Degradation

    The 2026 research on AI-generated code quality is not uniformly positive. Studies measuring bug density and code churn consistently find that AI-generated code — particularly in environments where review processes haven’t been adapted for AI authorship — introduces more defects than well-written human code. The 1.7x major bug rate and 2.74x higher vulnerability rate cited in security research represent worst-case conditions (minimal review, poor specification quality), but they’re not hypothetical. They reflect what happens when organizations adopt AI coding tools without simultaneously upgrading their review infrastructure.

    The mitigation is straightforward but requires investment: dedicated AI code review checklists, automated security scanning on AI-generated code, and a culture where engineers are expected to own and understand every line of code in a PR regardless of who — or what — wrote it first. The review burden doesn’t disappear when AI writes the code. It shifts.

    Security and Compliance Risks

    AI coding tools generate code from training data that includes vast amounts of public code repositories — which means they can inadvertently reproduce patterns from vulnerable, deprecated, or license-restricted code. Organizations in regulated industries (finance, healthcare, enterprise SaaS with complex compliance requirements) need to treat AI-generated code as requiring a separate security review pass, not just a standard code review. This is particularly relevant for authentication logic, data handling, and API integration code — all areas where AI tools are confident but error rates are high.

    The Organizational Debt Problem

    Perhaps the most underappreciated risk in aggressive AI coding adoption is organizational debt: the long-term consequences of hollowing out your junior engineering pipeline faster than you can build a replacement path to experienced senior engineers. Snap has the scale and resources to absorb this risk in ways that most engineering organizations don’t. A 50-person engineering team that cuts its junior tier to achieve short-term efficiency may find itself in a hiring crisis in 2028 when it needs experienced engineers and has no internal bench to draw from.

    The responsible version of the Snap model includes a deliberate investment in reskilling — moving engineers who were doing implementation work into the specification-writing, architecture, and AI orchestration roles that the small-squad model actually needs. This is harder and slower than a layoff announcement, but it’s the approach that builds a sustainable engineering organization rather than a temporarily efficient one.

    Beyond the Headlines: Building the AI-Native Engineering Organization

    Snap’s April 2026 announcement will be studied in business schools for a decade. But the most important thing it signals isn’t about headcount or cost savings or stock prices. It’s about the pace at which the definition of an effective engineering organization is changing — and the widening gap between organizations that are actively adapting and those that are treating AI coding as an optional efficiency experiment.

    The Engineering Org You Need to Build

    The AI-native engineering organization isn’t the one that has adopted the most tools or cut the most headcount. It’s the one where:

    • Senior engineers spend the majority of their time on specification, architecture, and AI orchestration — not implementation
    • AI agents run continuously across the SDLC, not just in the code editor
    • Measurement infrastructure tracks AI code quality in real time, flagging churn and vulnerability risks before they reach production
    • Junior developers are being trained on spec-driven engineering from their first week, not learning it as a late-career skill
    • Infrastructure efficiency — compute, data, pipeline cost — is optimized in parallel with human efficiency, not as a separate initiative

    The Timeline That Matters

    Snap went from early AI coding adoption to 65% AI-generated code across its entire engineering organization within approximately two years. Given that the tools available in 2026 are substantially better than those available in 2024, the same transition should be achievable in 18 months or less for teams that start today with a deliberate strategy. For teams that haven’t started, the clock is running — and their competitors may already be several phases ahead.

    What to Do This Week

    If you’re an engineering leader who has read this far and is still uncertain about where to begin, here is the minimum viable action set:

    1. Pick one team and one tool. Start with GitHub Copilot if your organization needs compliance coverage from day one, or Cursor if you want maximum throughput on a team ready to move fast.
    2. Establish baseline metrics before launch. You cannot demonstrate ROI without a before picture. Measure PR cycle time, code churn, and developer hours on implementation tasks before the pilot begins.
    3. Add a code review protocol for AI output. Even if it’s lightweight to start, your team needs a shared understanding of how AI-generated code is evaluated differently from human-generated code.
    4. Talk to your senior engineers about spec-writing as a core skill. The shift toward specification-driven engineering is the most important cultural and capability change the AI coding era requires. Start that conversation now.
    5. Measure after 60 days and make a scaling decision. Don’t let a pilot run indefinitely without a decision point. Sixty days is enough time to see whether the productivity gains are real in your environment and whether you should accelerate adoption.

    Snap’s crucible moment was dramatic, public, and painful for many of the people involved. But the underlying message it sends to every engineering organization watching is straightforward: the teams that figure out how to work at 65% AI-generated code — or higher — will be operating at a cost and velocity profile that teams stuck at 10% or 20% simply cannot match indefinitely. The question isn’t whether this transition is coming. It’s whether you’re going to lead it or chase it.