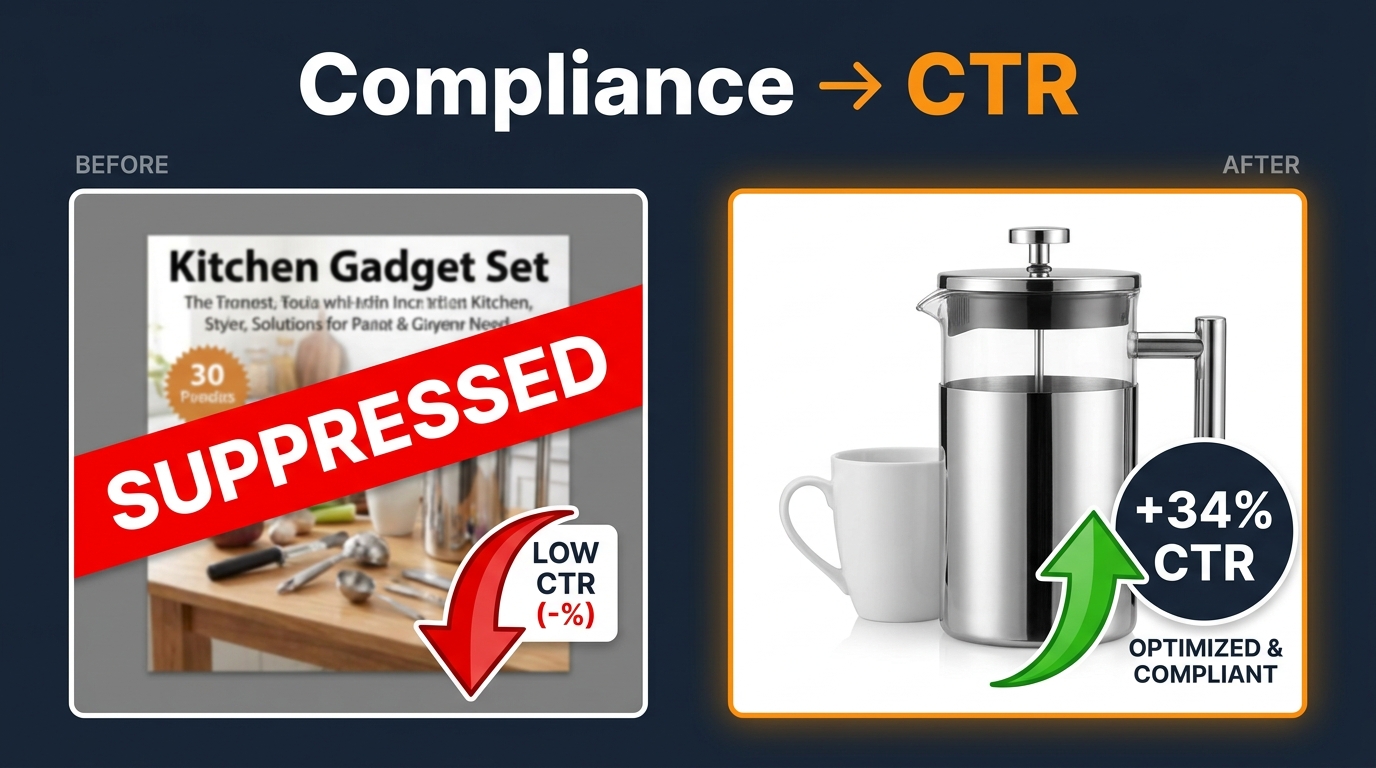
Tag: Amazon 2026

  • Amazon 2026 Image Specs: The Technical Compliance Guide Every Seller Needs Right Now

    Amazon 2026 Image Specs: The Technical Compliance Guide Every Seller Needs Right Now

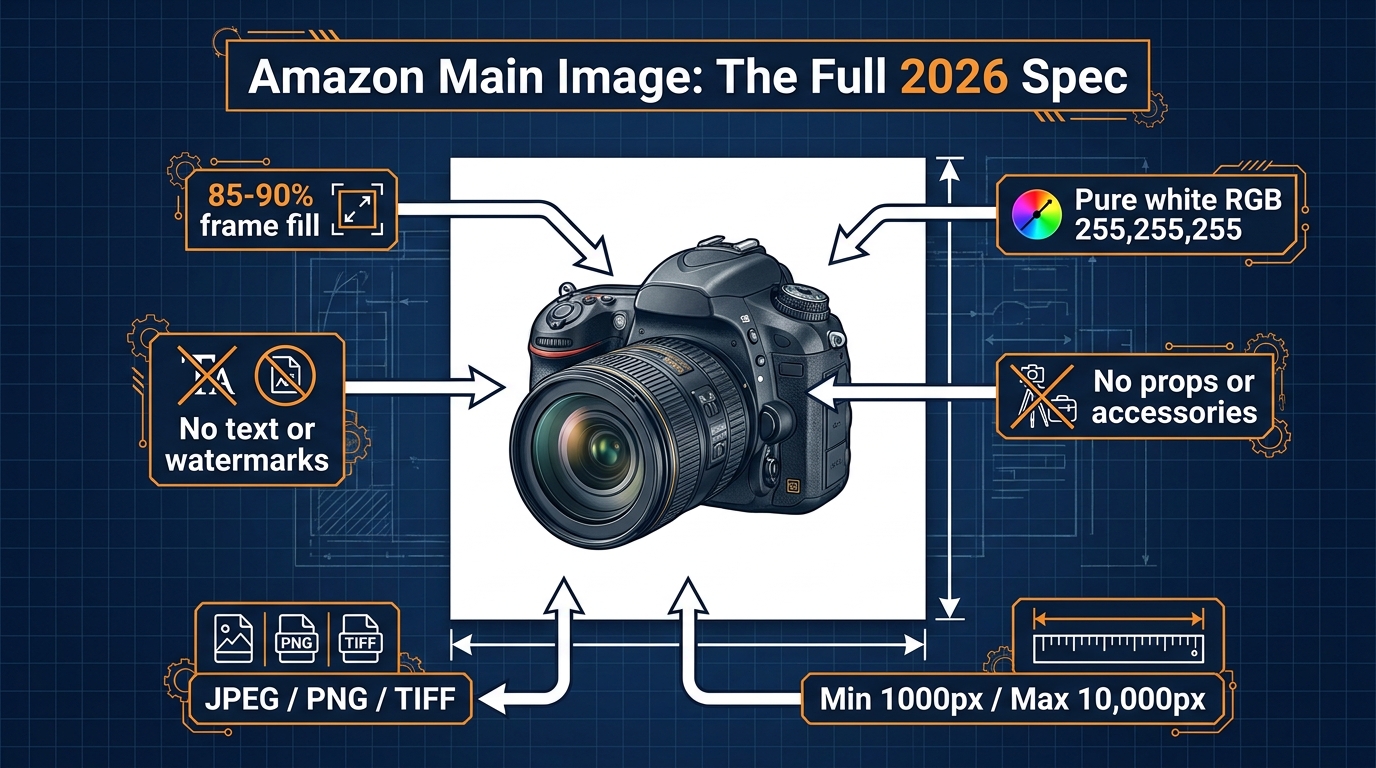
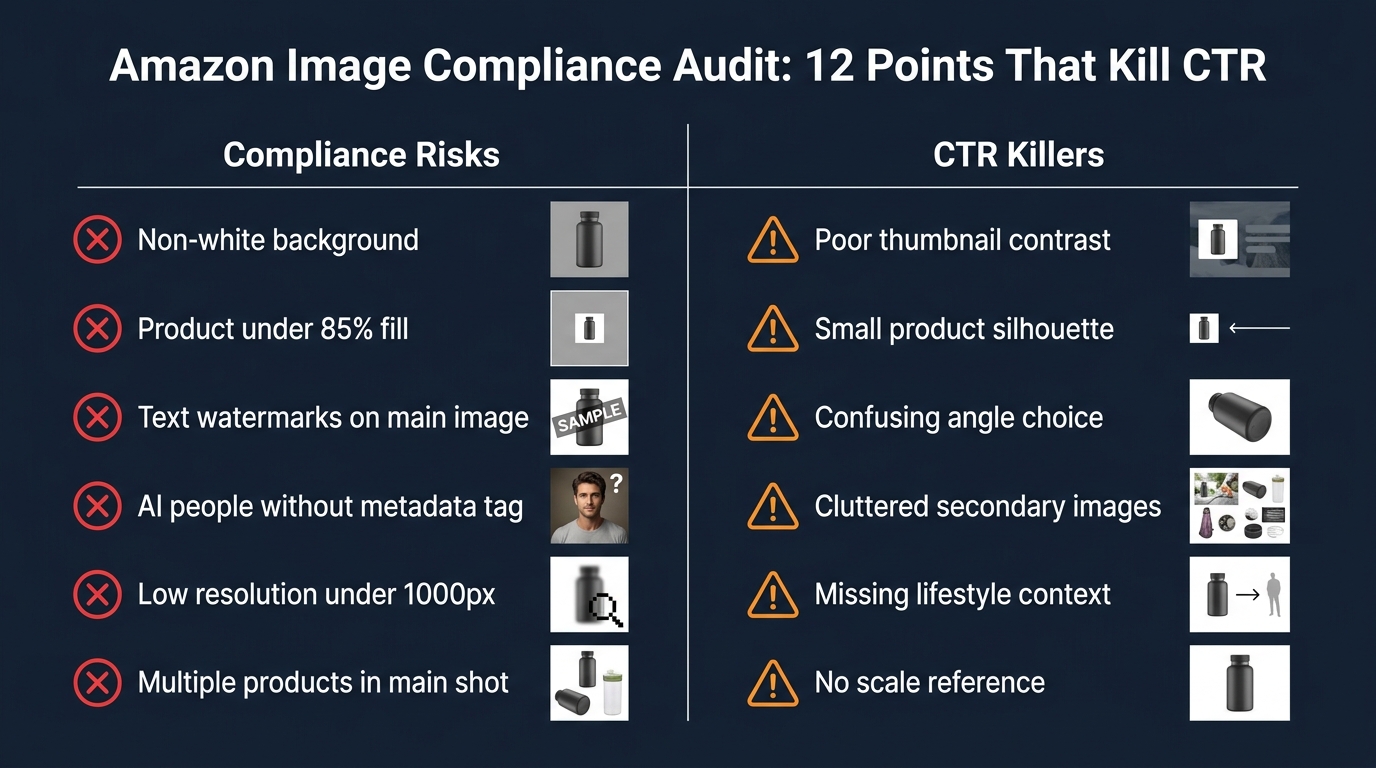
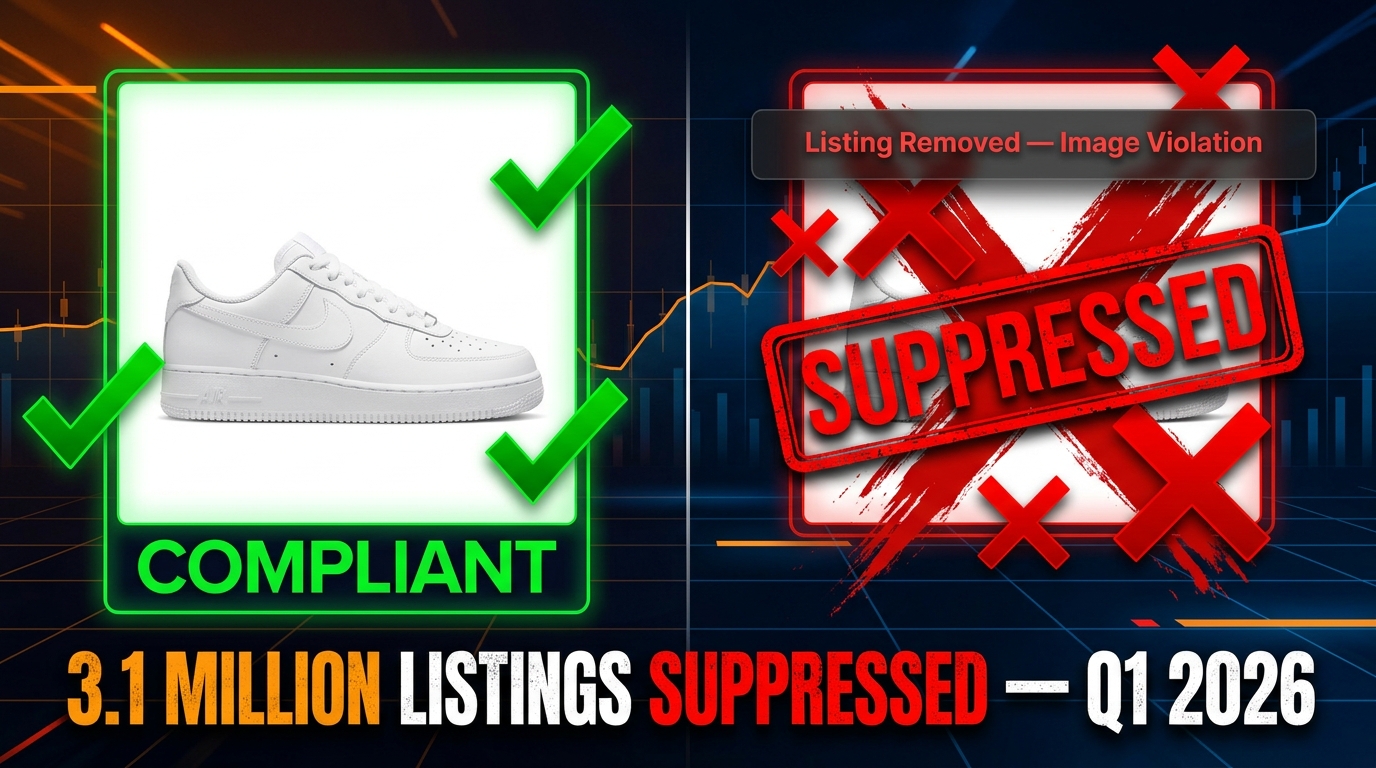
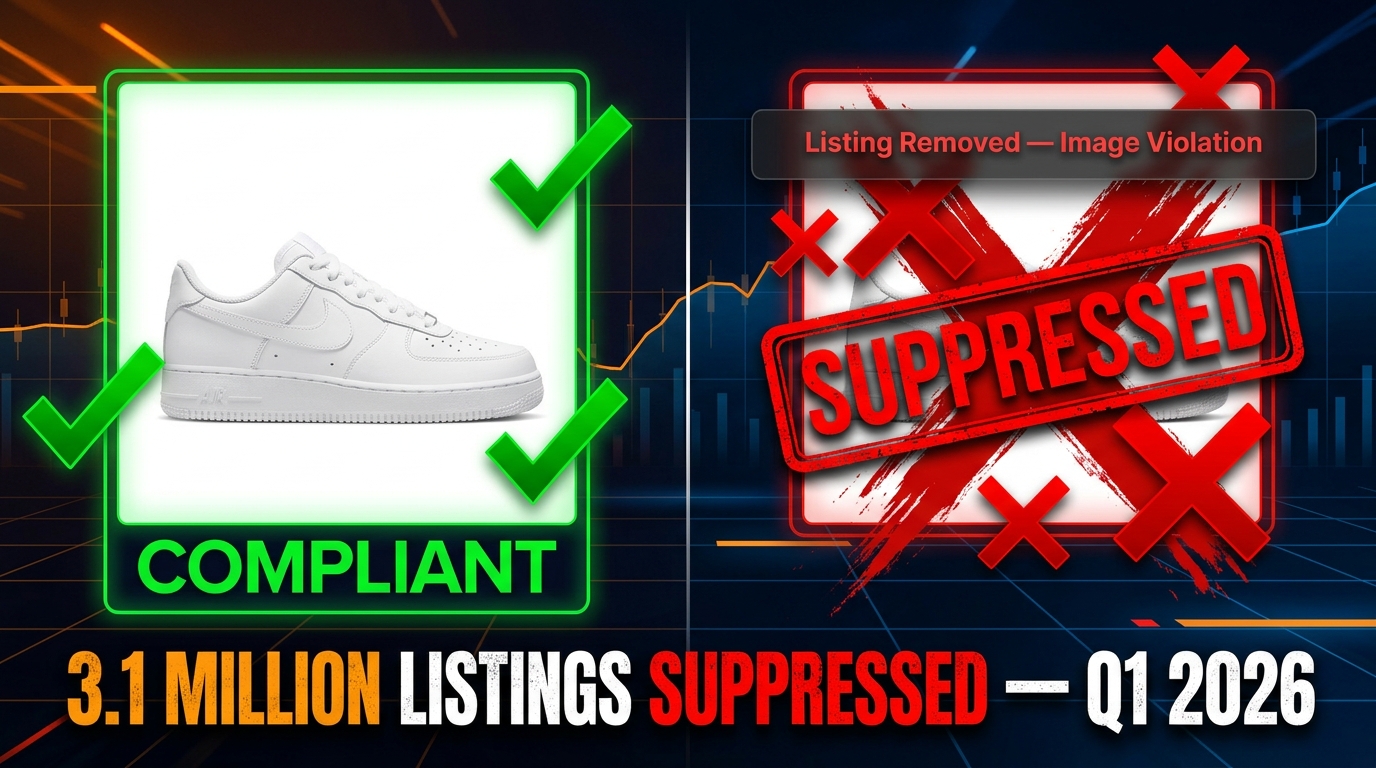
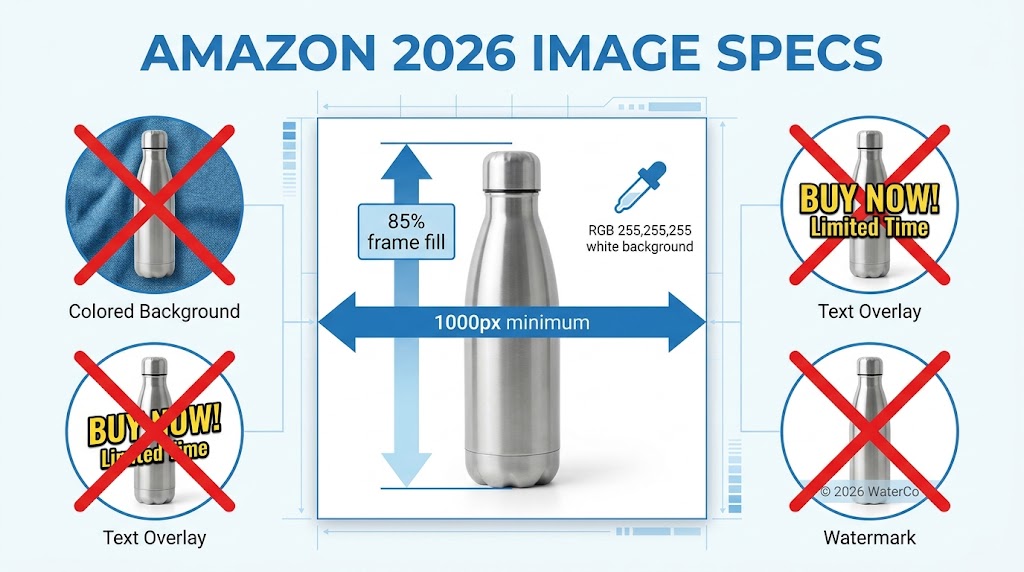
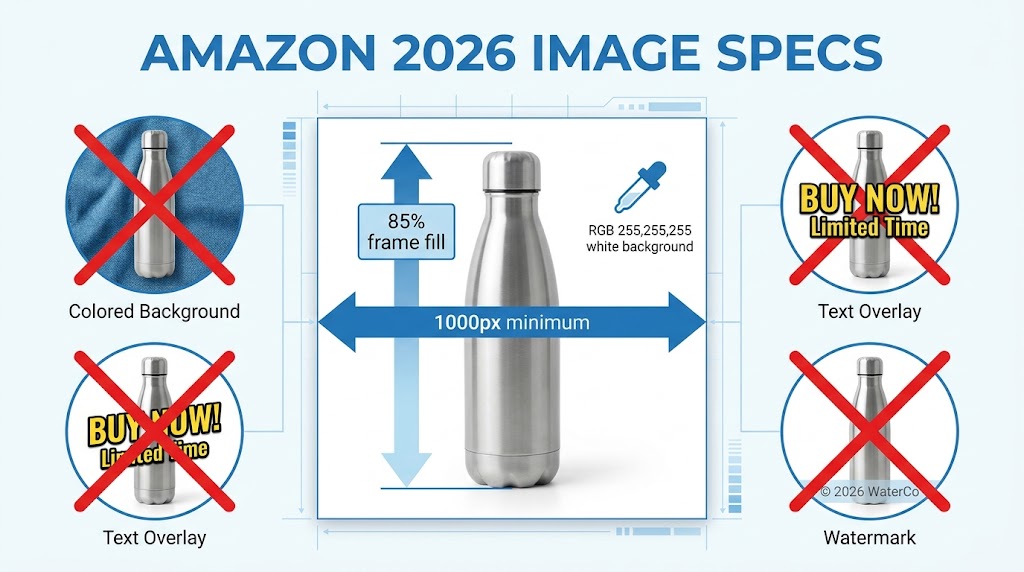
    Amazon 2026 Image Specs guide showing product photo compliance requirements with annotations

    Amazon updated and tightened its image policies at the start of 2026 — and the sellers who missed the memo are paying for it in suppressed listings, lost Buy Box eligibility, and declining click-through rates they can’t explain. If your listings went quiet and you’re not sure why, the answer is often sitting in your image files.

    This is not a broad overview of “why images matter.” You can find that anywhere. This is a technical compliance reference — the kind you save, share with your creative team, and run through every time you build or audit a listing. It covers every image type Amazon accepts, the exact pixel dimensions and file specifications for each, the enforcement mechanisms now active in 2026, and the category-specific exceptions that most sellers don’t know exist.

    More than 70% of Amazon traffic now originates from mobile devices. The way your product thumbnail renders on a 5-inch screen at 72 pixels per inch is now directly connected to your conversion rate and your algorithmic relevance score. A listing with a 3% CTR is signaling half the relevance of a competitor at 6% — and Amazon’s algorithm treats that signal as a ranking input, not just a vanity metric.

    Whether you’re launching a new product, auditing an existing catalog, or dealing with an active suppression you need to fix fast, this guide gives you everything you need — organized by image type, by enforcement rule, and by the technical specs that actually matter in 2026.

    The Main Image: What Amazon Actually Enforces in 2026

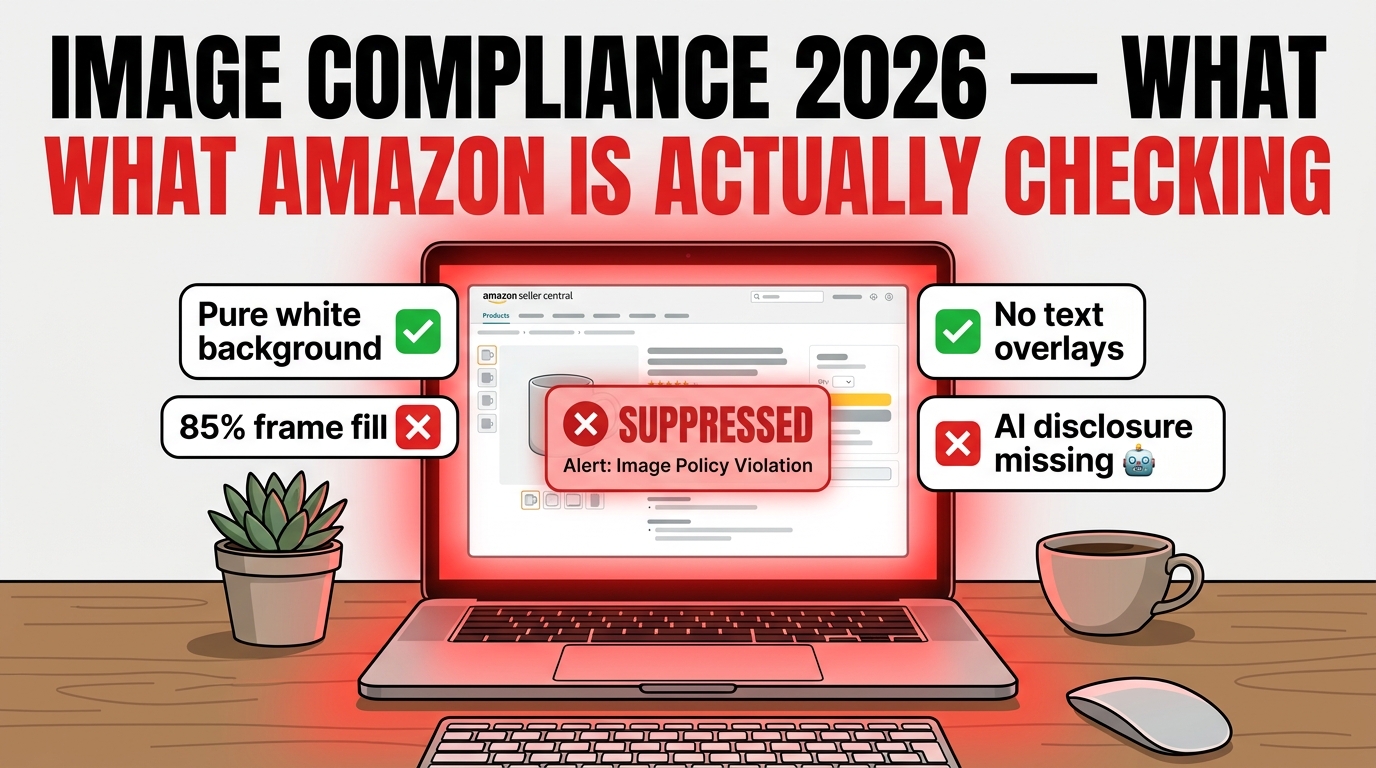
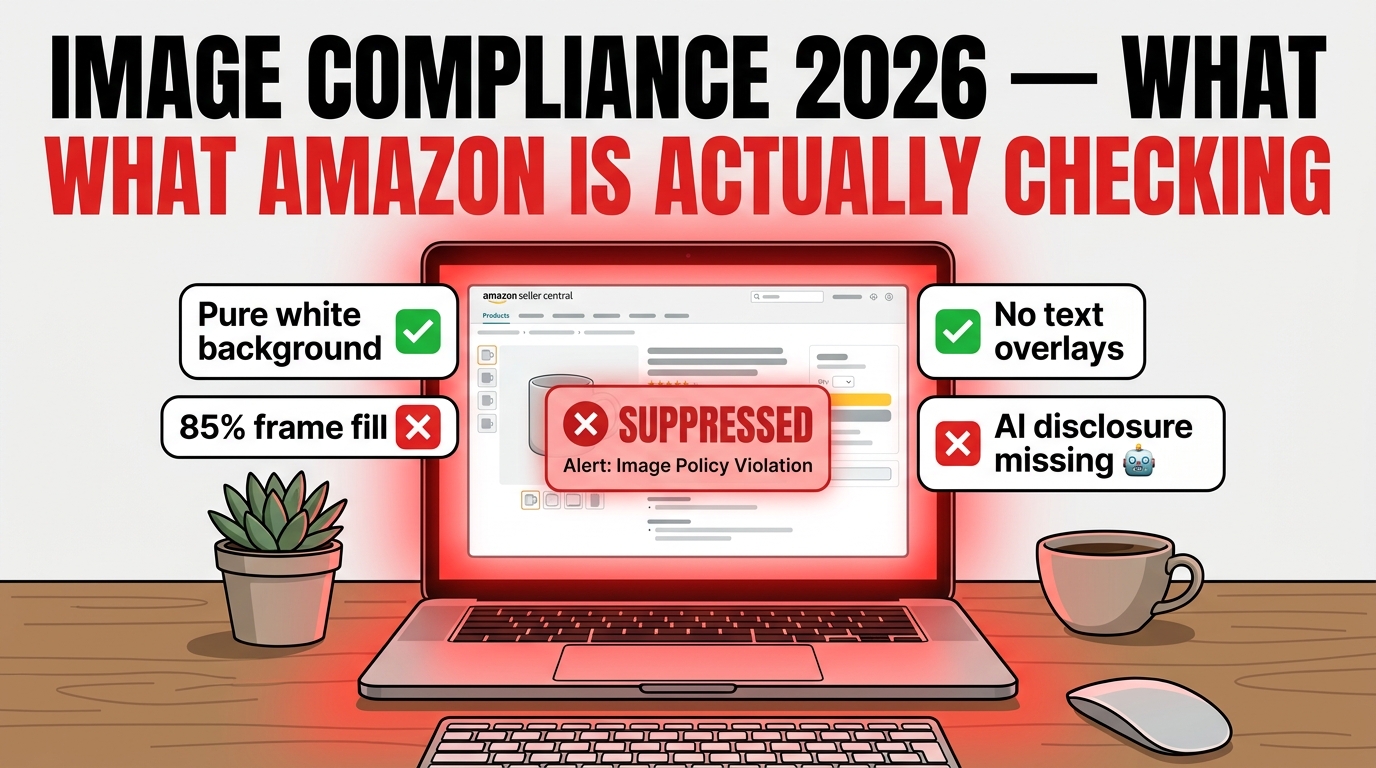
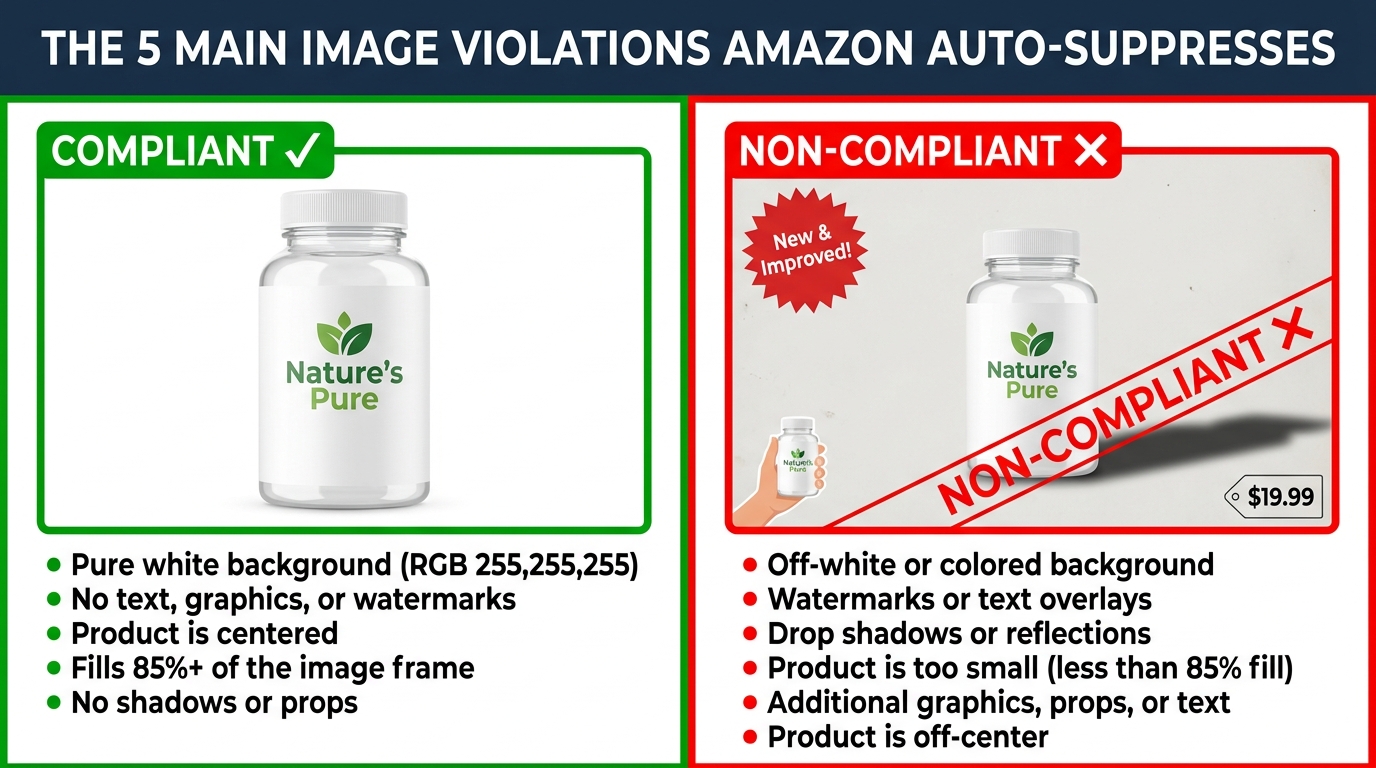
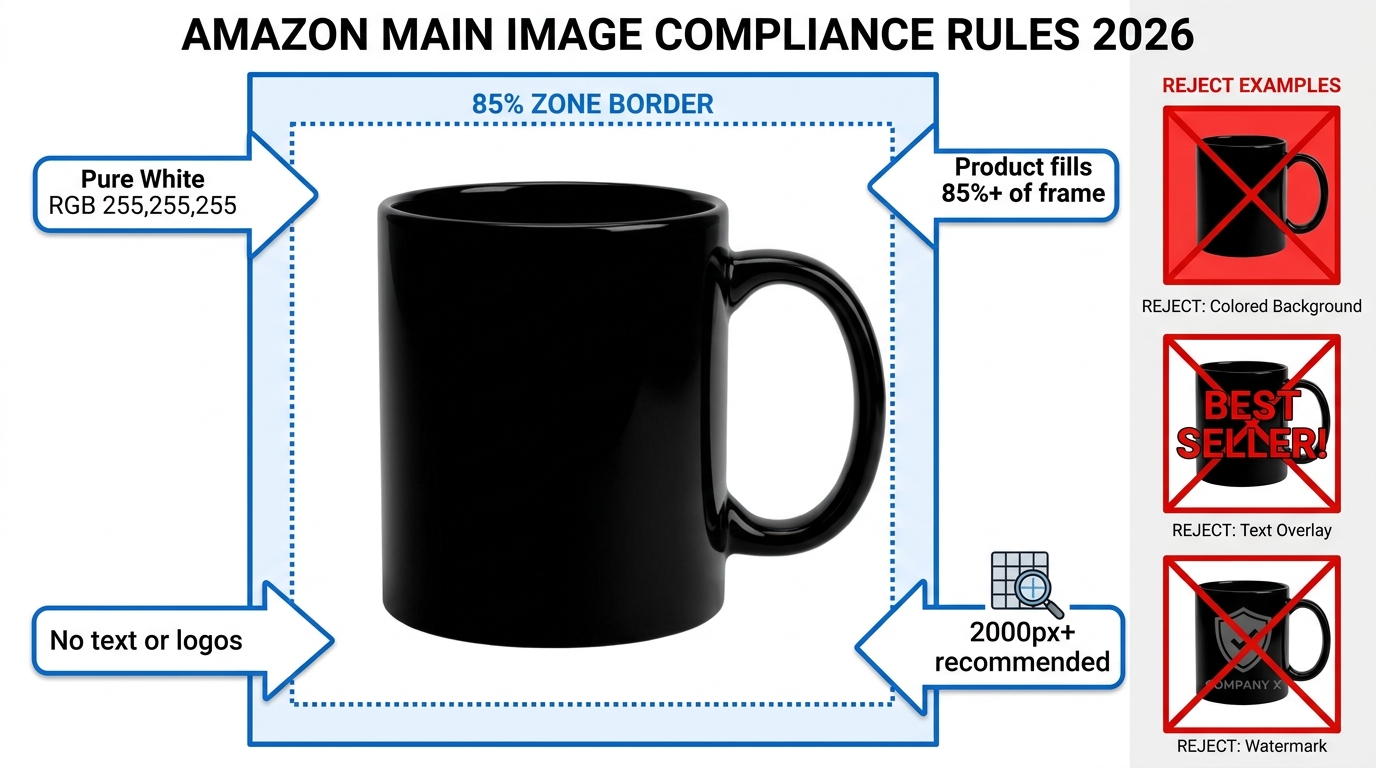
    Amazon main image compliance diagram showing 85% frame fill rule, white background requirement, and prohibited elements

    The main image is the one rule Amazon enforces with the least flexibility. It is the image that appears in search results and at the top of your product detail page. Everything else can be adjusted, tested, and optimized — but the main image operates within a non-negotiable technical framework. Here is exactly what that framework requires in 2026.

    Core Technical Requirements

    The background must be pure white — RGB 255, 255, 255. Not off-white. Not ivory. Not a near-white that looks fine on your monitor but reads as RGB 252 or 253 in an automated color check. Amazon’s compliance systems test for exact RGB values, and sellers have reported listings being flagged for backgrounds that appear visually identical to white on screen but fail the automated check. When processing images, use a proper color-managed workflow and verify the final file’s background values before upload.

    The product must fill at least 85% of the image frame. This is measured as the proportion of the image’s total area occupied by the product itself. Many sellers underestimate this requirement and end up with products floating in a sea of white space, which both fails the standard and makes the thumbnail look small and low-value in search results. Maximize your frame fill to the 85–100% range. The entire product must be visible — no cropping, no cutting off of edges.

    Resolution and File Format

    The minimum acceptable size is 1,000 pixels on the longest side. However, this minimum is a compliance floor — it is not a recommended target. Images at exactly 1,000 pixels meet the threshold for Amazon’s zoom function, but they produce mediocre zoom quality. The practical recommendation for 2026 is 2,000 pixels on the longest side or higher, which produces sharp zoom capability and better detail rendering on high-DPI mobile screens.

    JPEG (.jpg) is Amazon’s preferred format and should be your default choice. PNG, TIFF, and non-animated GIF files are also accepted. Avoid PNG for the main image if you have concerns about color accuracy — JPEG files with proper compression settings generally produce the most consistent results across different rendering environments. Animated GIFs are explicitly prohibited.

    What’s Prohibited — No Exceptions

    • Text of any kind — no product names, claims, promotional copy, callout labels, or size indicators
    • Logos or watermarks — including brand logos, photographer watermarks, or certification badges
    • Inset images or secondary product views within the main image frame
    • Props, accessories, or complementary products that are not included in the purchase
    • Colored, patterned, or textured backgrounds of any kind
    • Illustrations, renders, or mockups in place of actual product photography (for main images)
    • Multiple products in the frame when only a single unit is sold
    • Models or mannequins in most categories (exceptions exist for apparel)

    There are credible reports from seller forums that some top-volume sellers appear to escape enforcement of the props and 85% fill rules. Amazon has not officially acknowledged selective enforcement, and relying on such an assumption for your own listings is a risk strategy that has no upside.

    The White Background Trap: Why RGB 255 Is an Exact Specification

    This section gets its own treatment because it is the most common technical failure we see in newly suppressed listings, and the most invisible one. A background that looks white on a calibrated monitor may be outputting at RGB 253, 253, 253 — or even 250, 250, 250 after JPEG compression artifacts introduce variation at pixel level.

    How Automated Detection Works

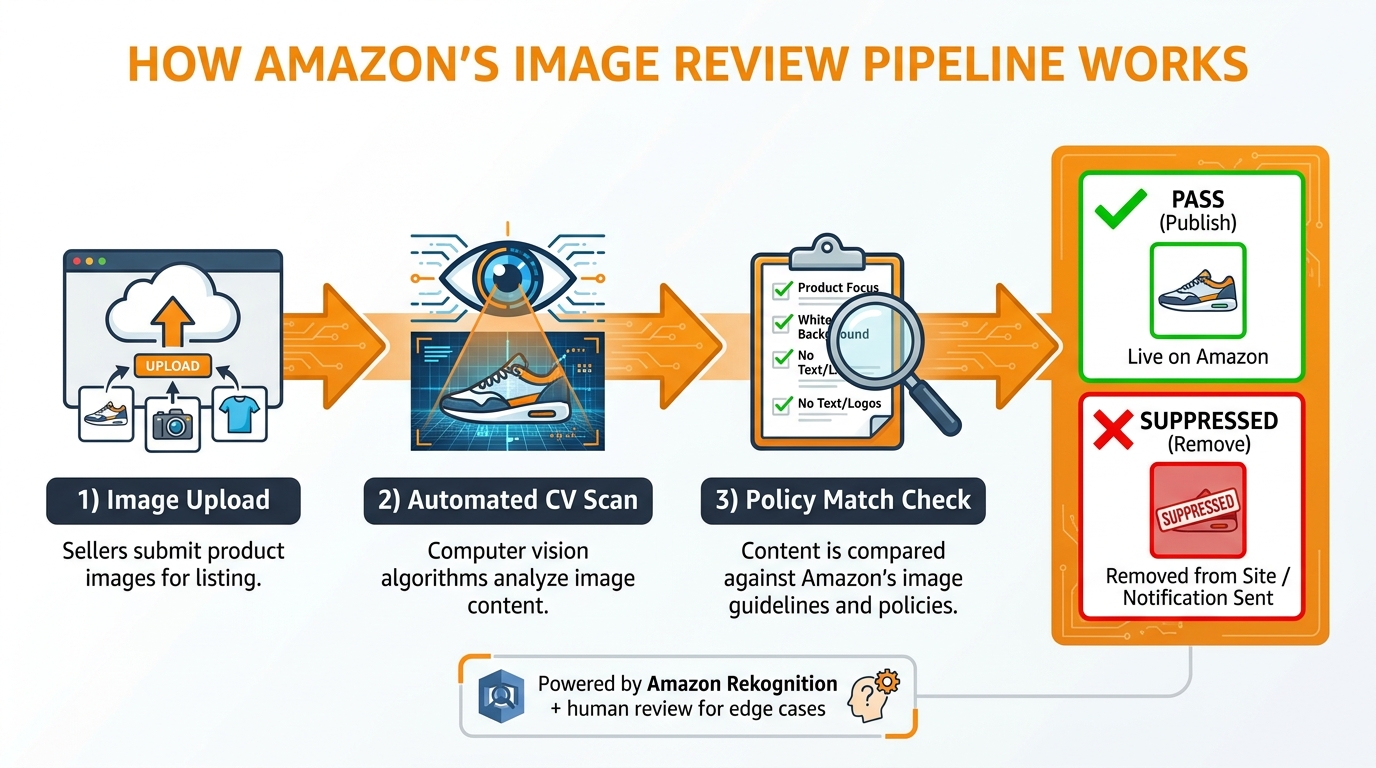
    Amazon uses automated image scanning to check compliance. The system samples pixel values from the background region of submitted images. If the sampled pixels fall outside the accepted range for pure white, the image can be flagged. This is not a subjective human review — it is a computational check, which means the margin for error is essentially zero.

    Common causes of white background failures include:

    • JPEG compression — JPEG is a lossy format. Even when your original file has a pure white background, saving at lower quality settings introduces compression artifacts that vary pixel values around edges and in flat regions. Save main images at maximum JPEG quality (quality 95–100) to minimize this.
    • Monitor color profiles — If your editing monitor is calibrated with a warm color profile (D50 instead of D65), what looks white on screen may not be white in the file. Use a properly calibrated display and check RGB values with an eyedropper tool before exporting.
    • Background removal tools — Many automated background removal tools (including popular AI-based ones) replace backgrounds with “near white” values rather than true RGB 255, 255, 255. Always fill the background manually with a pure white fill after running background removal.
    • Shadow rendering — Product photography that includes subtle drop shadows can introduce gray values around the base of the product. Clean shadows completely or use a pure white fill layer over any shadow regions.

    The Practical Fix

    After your image is edited, use the eyedropper/color picker tool in Photoshop, Affinity Photo, or any comparable editor to sample multiple points in the background region of your image. Every sample should read R: 255, G: 255, B: 255. If any area reads lower values, apply a white fill layer to that region and re-export. This takes 30 seconds and prevents a suppression event that could take days to resolve.

    Secondary Images: Getting Every Slot to Work for You

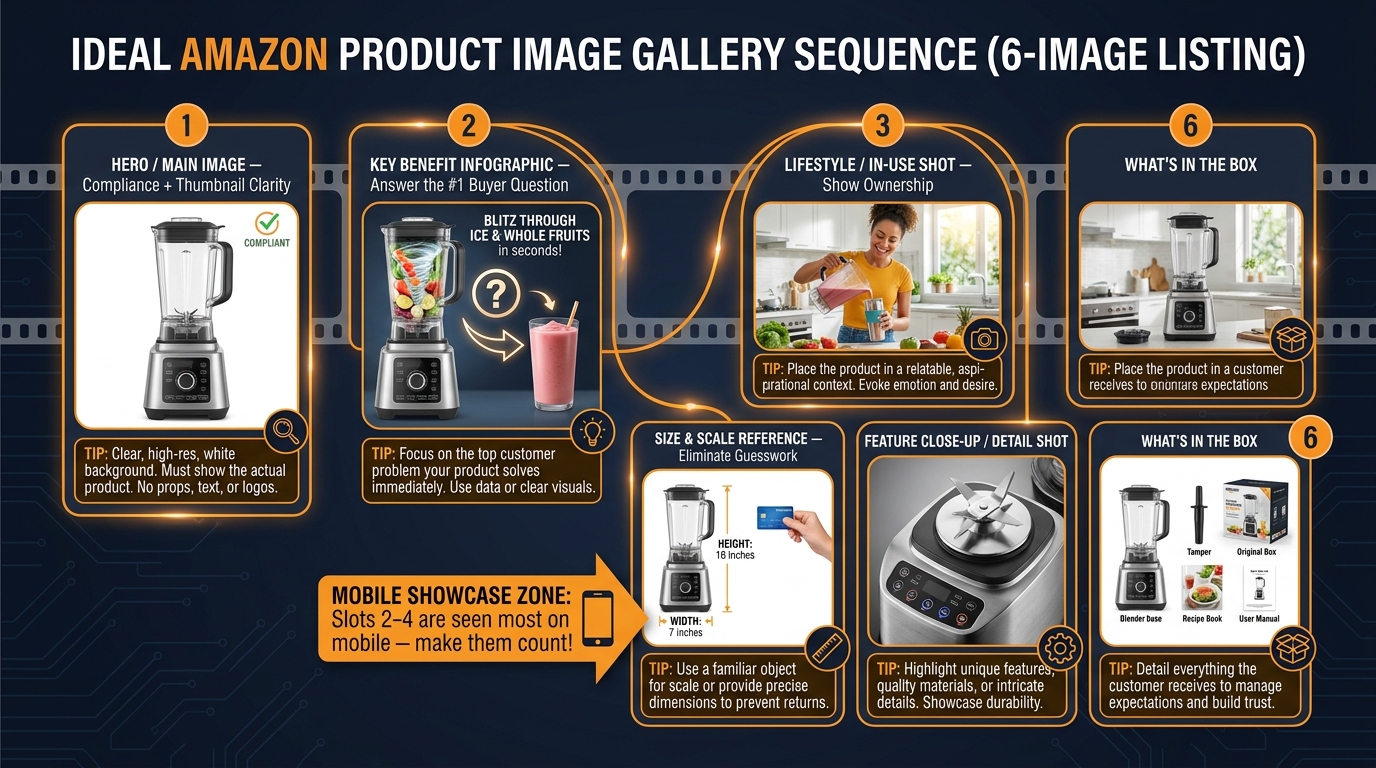
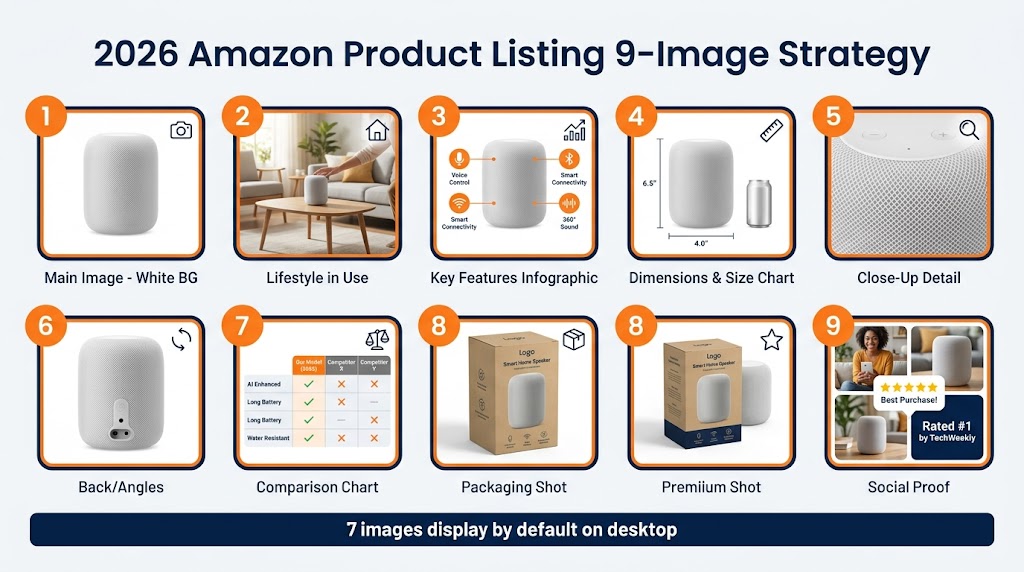
    Amazon 9-image slot strategy infographic showing recommended content for each listing image position

    Amazon allows up to nine images per listing. Seven display by default on desktop. On mobile, the image carousel typically shows fewer before the buyer has to swipe. This means the order of your secondary images matters almost as much as their content — the images a buyer sees without scrolling or swiping are doing the most conversion work.

    Unlike the main image, secondary images have almost no background restrictions. You can use lifestyle photography, infographics, close-ups, comparison charts, scale references, and packaging shots. The technical minimums still apply (1,000 pixels on the longest side, JPEG/PNG/TIFF/GIF format) but the creative freedom is wide.

    What Each Slot Should Do

    Think of your nine image slots as a visual sales sequence, not a photo gallery. Each image should answer a specific question a buyer would have at that stage of their decision process.

    Slot 2 — Lifestyle image: Show the product being used in a realistic context. A camping chair on a campsite. A kitchen tool mid-use. A skincare product on a bathroom counter. The goal is to help the buyer visualize ownership — not to show features, but to trigger the mental image of them already having the product.

    Slot 3 — Feature infographic: Overlay key features, materials, or benefits on a product image or clean background. Use callout lines, icons, and brief labels. Address the top 2–3 questions buyers typically have before purchasing. Keep text minimal and legible at mobile thumbnail sizes.

    Slot 4 — Size/dimension reference: Show actual measurements with a size chart or comparison object (hand, coin, ruler). Sizing confusion is one of the top drivers of returns. A clear scale reference reduces return rates and improves review scores over time.

    Slot 5 — Close-up detail: Highlight material quality, texture, construction, or any detail that differentiates your product. Buyers who are debating between two similar products will often make the decision based on perceived quality, and a sharp close-up that shows good craftsmanship converts better than any bullet point.

    Slots 6 and 7 — Additional angles, back of product, or secondary lifestyle: Show the product from different angles or in a different use-case scenario. If your product has a back, underside, or interior view that’s relevant to buyers, use these slots.

    Slot 8 — Packaging or “what’s in the box” shot: Particularly valuable for gift purchases, items with multiple components, or products where packaging quality matters. Buyers buying as gifts want to see how it arrives.

    Slot 9 — Social proof, comparison, or brand story: Use this slot for a comparison chart against a competitor feature set, a visual showing compatibility (works with X, Y, Z), or a brief brand story graphic if your brand positioning is a selling point.

    Mobile-Optimization for Secondary Images

    Text that reads fine on a desktop screen at full resolution may become illegible on a mobile thumbnail. Design all secondary images at 2,000 pixels or higher and test how they render as thumbnails. If the text in your infographic requires zooming to read, it is not doing its job at the stage where most buyers are making first-contact decisions.

    A+ Content Image Dimensions: The Complete Module-by-Module Breakdown

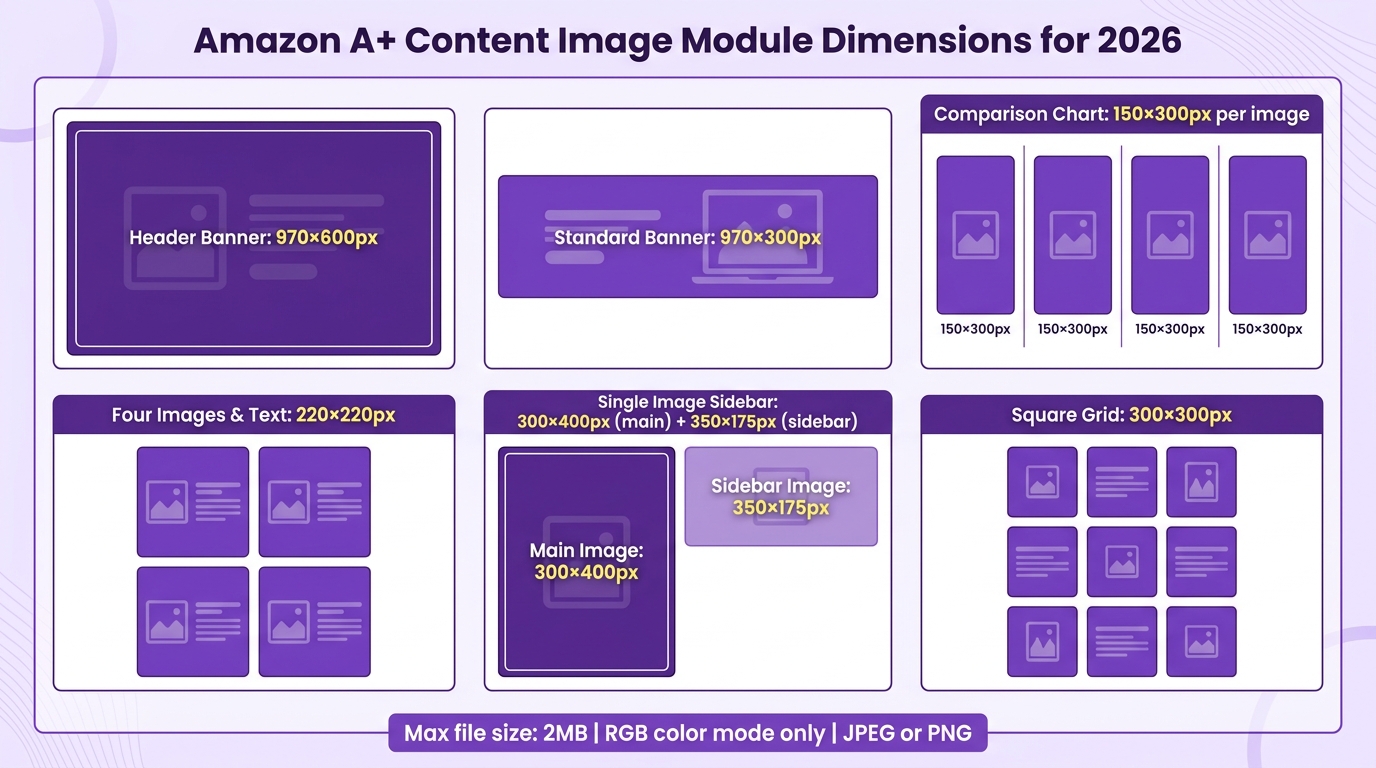
    Amazon A+ Content image module dimensions chart for 2026 showing pixel specifications for each module type

    A+ Content (formerly Enhanced Brand Content) is available to Brand Registry members and is one of the most impactful — and most technically misunderstood — features on the platform. Every A+ module has its own image dimension specification. Uploading the wrong size doesn’t simply look bad; in many modules it will be cropped automatically, cutting off content you intended buyers to see.

    Standard A+ Module Dimensions

    Here are the current 2026 specifications for each major module type:

    • Header with text banner: 970 × 600 pixels — This is the largest format module, typically used at the top of the A+ section. It is the closest thing A+ has to a hero banner and should carry your strongest visual.
    • Standard image banner: 970 × 300 pixels — Used for full-width image strips between text sections. Effective for brand imagery and environmental lifestyle shots.
    • Comparison chart images: 150 × 300 pixels per product — Used in the product comparison table module. Small size means simple, clean product-only images work best here.
    • Four images and text module: 220 × 220 pixels — Square thumbnails used alongside text descriptions. Product icons, benefit icons, or tight product close-ups work well at this scale.
    • Four-image quadrant: 153 × 153 pixels — The smallest image format in standard A+. Keep content extremely simple at this size.
    • Single image and sidebar: Main image 300 × 400 pixels, sidebar 350 × 175 pixels — A flexible layout for combining a product visual with supporting text or benefit callouts.
    • Standard three images and text: 300 × 300 pixels each — Three equal-size images displayed side by side with text below. Use for a three-step process, three key benefits, or three use cases.

    Technical Specifications Across All A+ Modules

    Regardless of module type, the following technical requirements apply to all A+ content images in 2026:

    • File formats: JPEG (preferred) or PNG
    • Maximum file size: 2 MB per image
    • Color mode: RGB only — CMYK files will be rejected
    • Minimum resolution: 72 DPI (300 DPI recommended for print-quality sharpness)
    • Animations: Prohibited — static images only in standard A+
    • Pricing, promotional copy, or availability claims: Prohibited in A+ content images

    Premium A+ Content

    Premium A+ (available to Brand Registry members who meet certain criteria) allows larger image modules, video integration, interactive hotspot images, and carousel formats. The larger image modules support widths up to 1,500 pixels for HD-quality rendering in the expanded banner format. If you have access to Premium A+ and aren’t using it, the conversion uplift from the richer media formats is consistently meaningful, particularly for complex or considered purchases where buyers spend time on the detail page before deciding.

    Video Specifications for Amazon Listings

    Video now appears in the main image carousel on product detail pages, making it effectively another “image slot” — but one that requires a completely different set of technical specifications. Many sellers treat product video as an afterthought. In 2026, with conversion rates under pressure from increased competition, video is a meaningful differentiator that most sellers still underuse.

    Product Detail Page Video

    For video uploaded directly to a product listing (appearing in the main image carousel and Buy Box area), the current specifications are:

    • Format: MP4 or MOV
    • Maximum file size: 5 GB
    • Minimum resolution: 1,280 × 720 pixels (720p); 1,920 × 1,080 pixels (1080p) strongly recommended
    • Aspect ratio: 16:9 preferred
    • Length: No fixed maximum for product detail page videos
    • Thumbnail: JPEG or PNG, must match video aspect ratio and resolution, maximum 5 MB

    The thumbnail image you select for your video is effectively treated as an additional product image in the carousel. Choose a frame or create a custom thumbnail that communicates the video’s value proposition — not just a freeze-frame of the video’s first second.

    Sponsored Video Ad Specifications

    If you’re running Sponsored Brand Video or Sponsored Display Video ads, the specifications differ from organic listing video:

    • Format: MP4
    • Maximum file size: 500 MB
    • Length: 6–45 seconds (the “6-second rule” — your video should communicate the core value proposition within the first 6 seconds, as this is when most non-engaged viewers exit)
    • Minimum resolution: 1,920 × 1,080 pixels
    • Aspect ratio: 16:9
    • Frame rate: 23.976–30 fps
    • Audio: 44.1 kHz stereo or mono, 96 kbps minimum
    • Codec: H.264

    Amazon’s ad review process checks video ads for audio quality, visual clarity, and content policy compliance before they go live. Factor in a review period of 24–72 hours for new video ad creatives.

    Mobile-First Thinking: How Thumbnails Are Costing You CTR

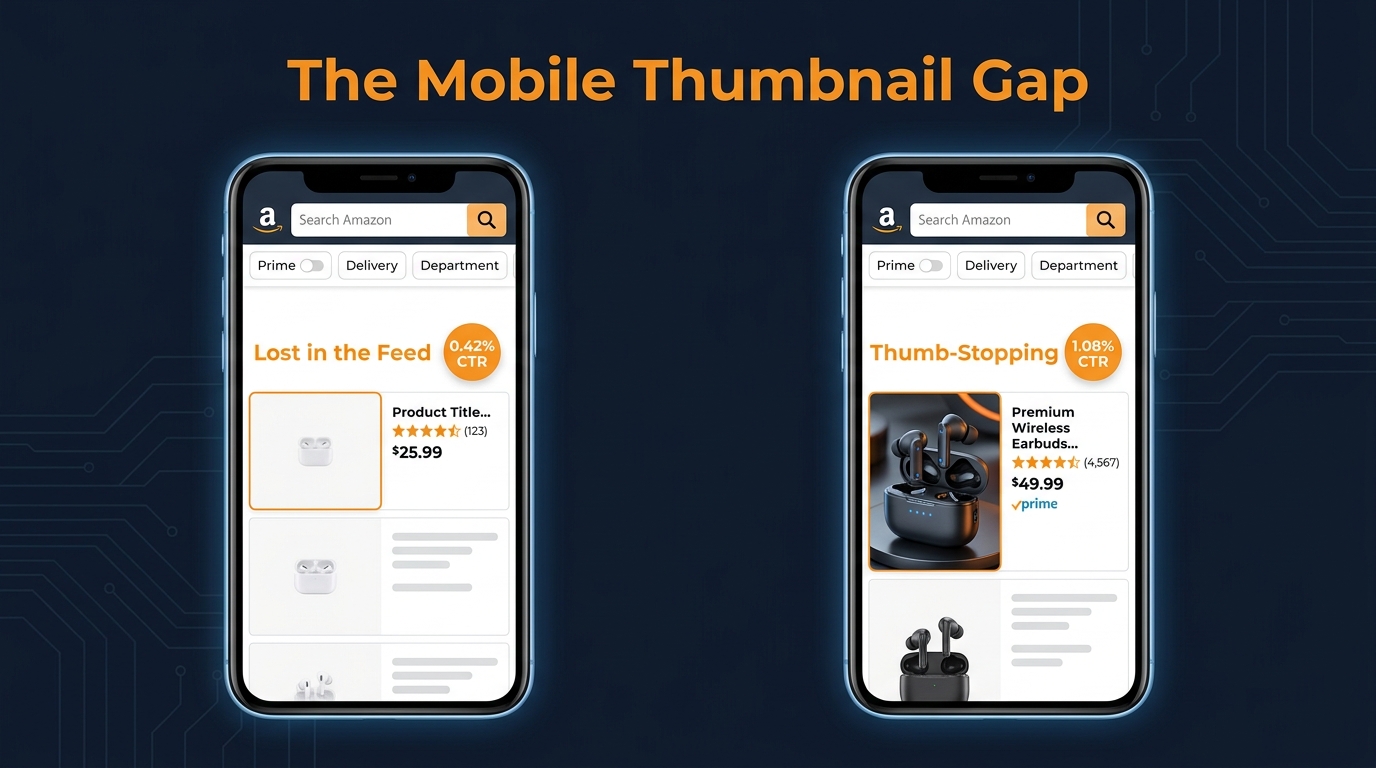
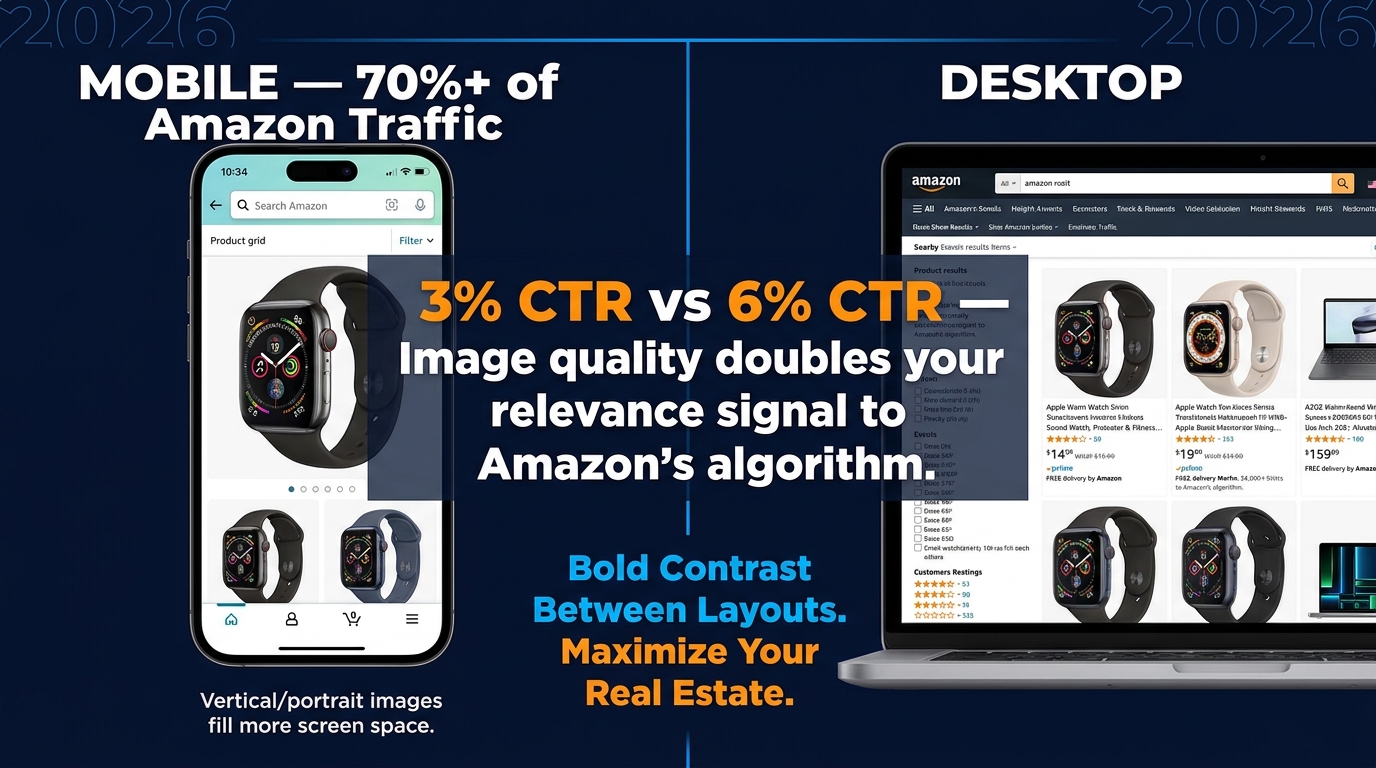
    Mobile vs desktop Amazon thumbnail comparison showing how image orientation affects CTR and listing visibility

    Over 70% of Amazon’s traffic in 2026 comes from mobile devices. Yet most product photography is still planned, shot, and reviewed on desktop monitors — which means most sellers are optimizing for the minority of their audience. The implications for image strategy are significant and still underappreciated.

    Vertical vs. Horizontal Image Composition

    Amazon’s standard image format is square (1:1 aspect ratio). On desktop, this square thumbnail is rendered at a relatively small size alongside other search results. On mobile, the same square thumbnail fills a much larger proportion of the screen, particularly in the Amazon app’s grid view.

    Within that square frame, how you compose your product matters for mobile visibility. Products with a vertical orientation (taller than wide) naturally fill the square frame in a way that appears larger and more dominant at thumbnail scale. Products with a horizontal orientation have more white space at top and bottom within the square frame, making them appear smaller and less impactful in the mobile grid.

    Where you have any control over the product’s orientation in the main image — particularly for items that can be photographed from multiple angles — test vertical compositions. They render more impressively in the mobile environment where most of your buyers are making first-impression decisions.

    The CTR-Algorithm Feedback Loop

    This is the mechanism that makes image quality a ranking issue, not just a conversion issue. When your main image generates a below-average click-through rate — because it looks small, unclear, or uncompelling at thumbnail scale — Amazon’s algorithm interprets that low CTR as a relevance signal. A listing getting 3% CTR against a competitor at 6% is, in Amazon’s model, half as relevant for that keyword. This suppresses ranking, which reduces impressions, which further reduces CTR, compounding the problem.

    Image optimization is therefore not just a conversion rate optimization exercise. It is a ranking signal that affects organic visibility in ways that can’t be fixed with additional advertising spend.

    Checking Your Images in Mobile Context

    Before publishing any listing images, view them in the Amazon Seller app on a physical mobile device — not a browser window simulating mobile size. Check:

    • Does the product look appropriately large in the thumbnail?
    • Can you see the key product detail that differentiates it from competitors?
    • Does the image feel clean and professional, or cluttered?
    • For secondary images: can you read any infographic text without zooming?

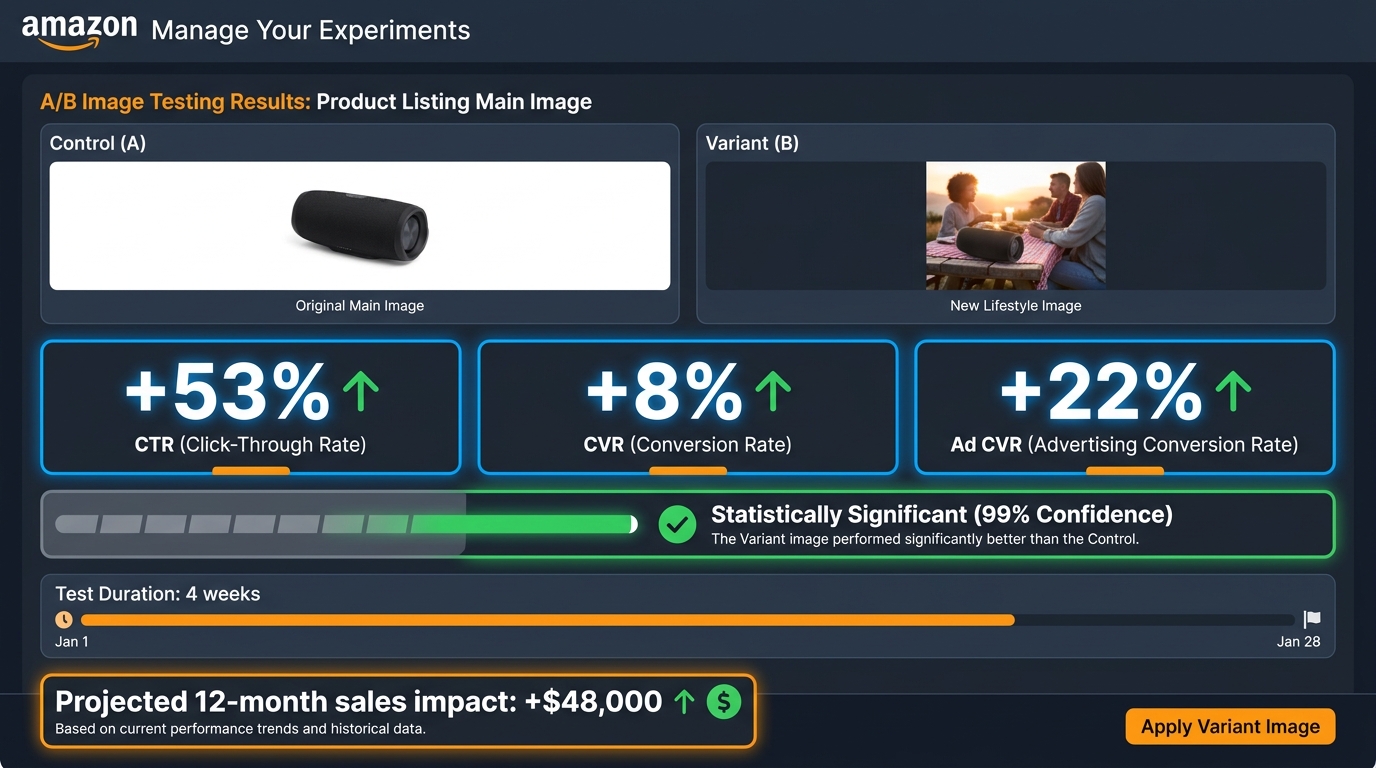
    If you’re uncertain, Amazon’s Manage My Experiments feature (for Brand Registry members) allows you to A/B test main images directly within the platform and measure actual CTR and conversion impact from real traffic.

    Amazon’s Image Overwrite and Suppression Enforcement in 2026

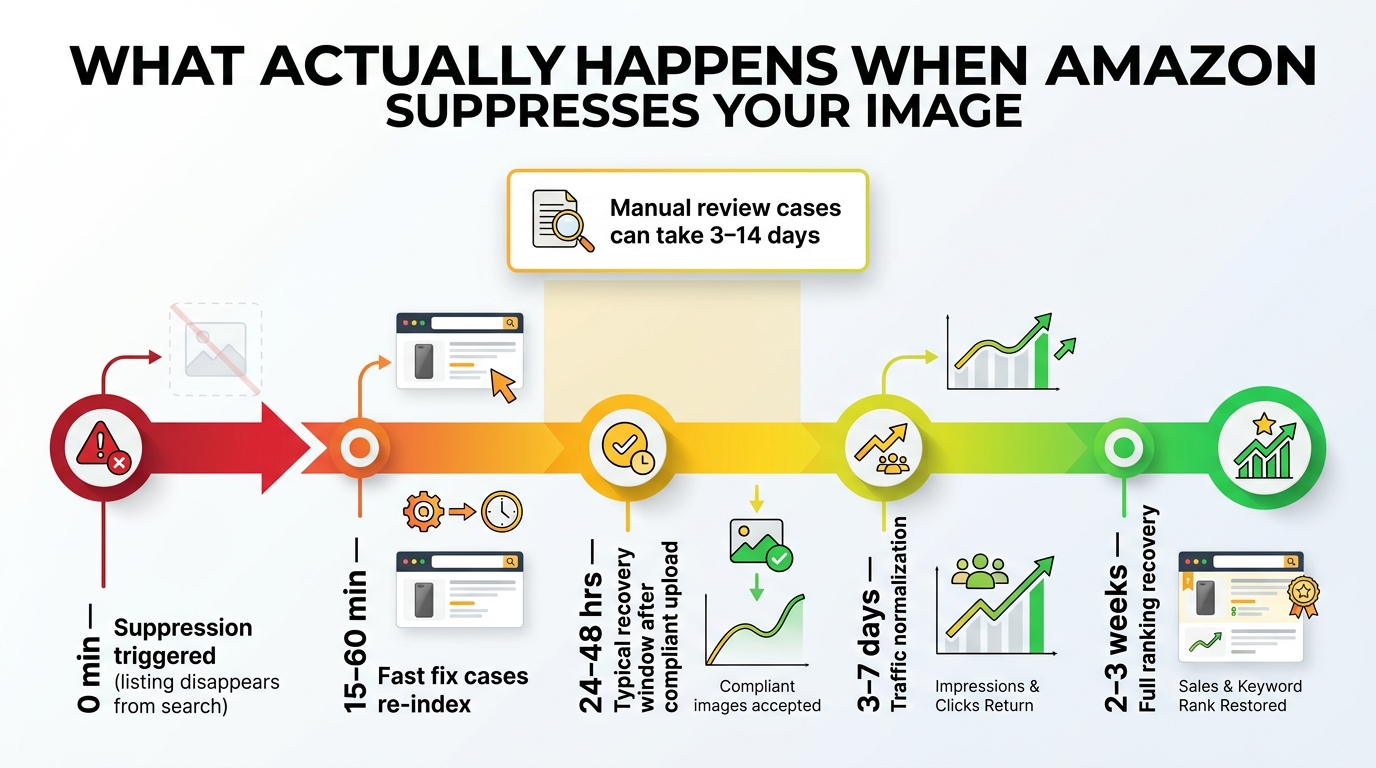
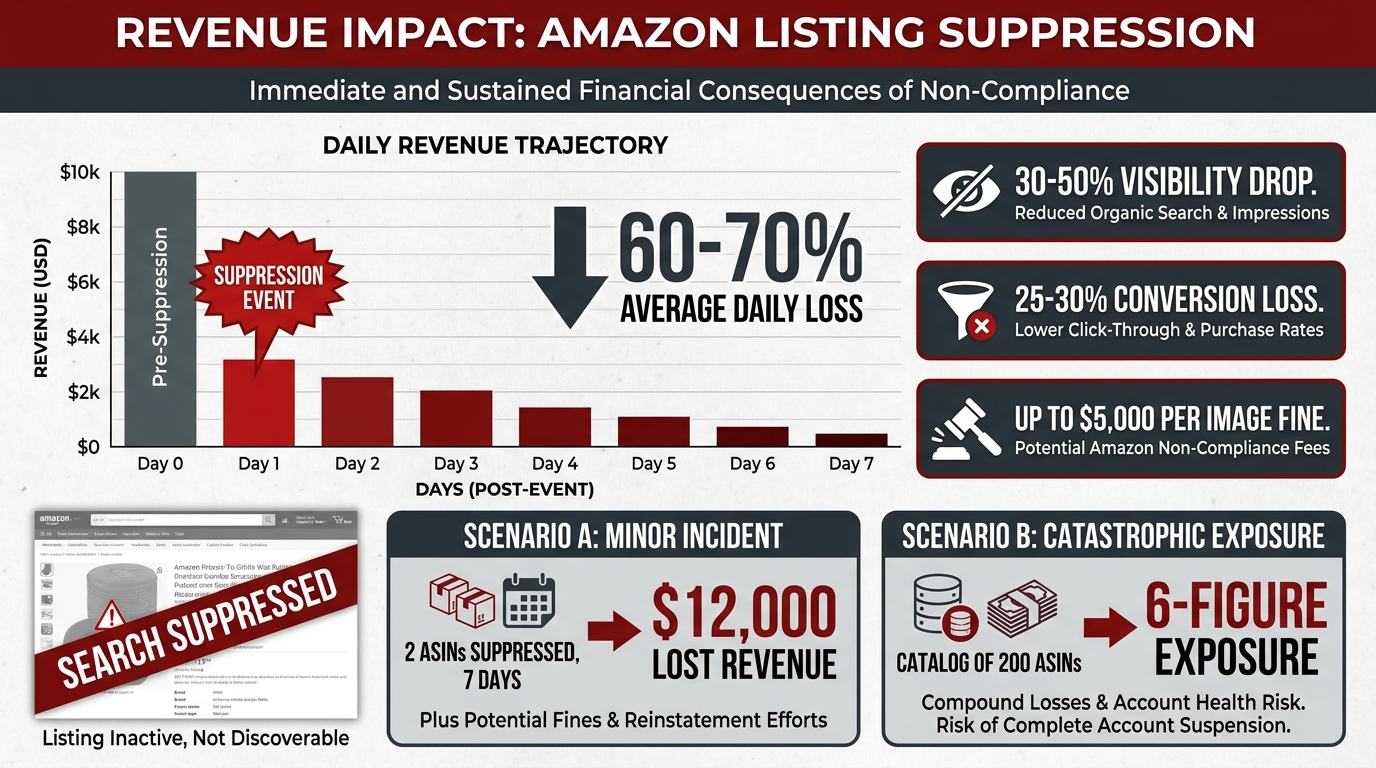
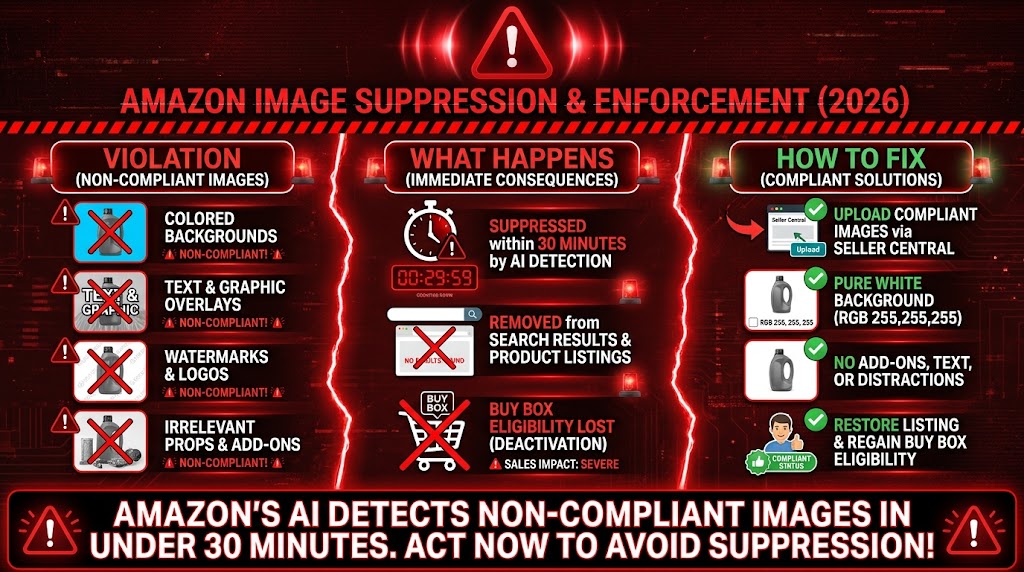
    Amazon image suppression and enforcement warning infographic showing violations and how to fix suppressed listings in 2026

    Two enforcement mechanisms now active in 2026 have caught sellers off guard who weren’t monitoring policy communications: automated listing suppression and the image overwrite policy. Understanding both is essential to maintaining listing health across your catalog.

    Automated Suppression

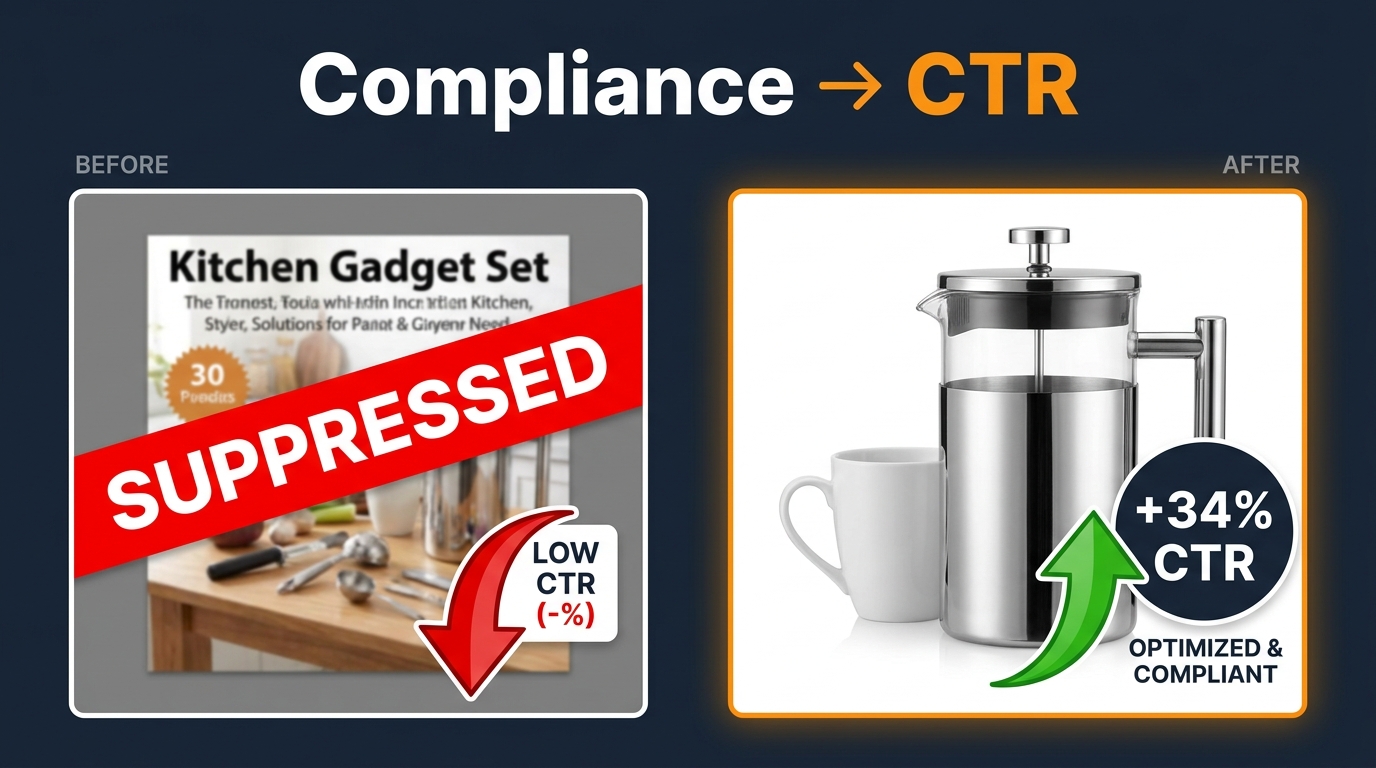
    Amazon’s compliance system actively scans listing images for policy violations and can suppress a listing — removing it from search results — without manual review or prior warning. The suppression can happen fast. Sellers have reported non-compliant images being detected and listings being pulled from search within 30 minutes of upload in some cases, particularly in categories like supplements where enforcement is known to be aggressive.

    Common triggers for automated suppression include:

    • Main image background failing the white background check
    • Promotional text (e.g., “Best Seller,” “50% Off,” “FDA Approved,” “#1 Choice”) in the main image
    • Digital badges, ribbons, or “award” overlays on the main image
    • Product fills less than the frame minimum
    • Missing required images (some categories require specific image types to be present)

    To check for active suppression, go to Seller Central → Inventory → Manage Inventory and look for listings flagged with a “Suppressed” status. The platform will typically display the specific reason for suppression in the listing’s status details.

    The Image Overwrite Policy

    This is the enforcement change that has most alarmed Brand Registry sellers in 2026. Amazon has expanded its policy to allow — and in some cases perform automatically — the replacement of a brand owner’s product images with images contributed by other sellers or sourced by Amazon itself, if Amazon deems those images to be higher quality or if required image types are missing from the listing.

    Yes, this means a brand-registered seller can upload their product images and find them replaced by a competitor’s contribution. Amazon’s stated reasoning is that better images improve the customer experience regardless of source — but the practical result is that brand owners who don’t proactively maintain high-quality, complete image sets are ceding control of their visual presentation.

    The protective response is straightforward: maintain a complete, high-quality image set in all available slots, ensure all images meet or exceed Amazon’s technical standards, and monitor your listing images regularly. A brand with a robust, professional image set gives Amazon no reason to replace its visuals with an alternative.

    Appealing a Suppression

    There is no complex appeals process for image suppression in most cases. The fix is to upload compliant images. Navigate to the suppressed listing, replace the non-compliant image with a compliant version, and re-submit. Processing time varies but typically resolves within a few hours if the replacement image passes automated checks. If suppression persists after uploading compliant images, open a Seller Central support case with the specific ASIN and suppression reason for manual review.

    AI-Generated Images: What’s Allowed and What Gets You Removed

    AI-generated product photography has become accessible enough in 2026 that it’s a standard tool in many sellers’ workflows. Amazon’s policy position on AI images is more nuanced than the binary “allowed or banned” framing often seen in seller communities — and understanding the actual rules prevents expensive mistakes.

    Where AI Images Are Permitted

    Amazon does not prohibit AI-generated or AI-enhanced images as a category. The key standard is accuracy: images must not mislead buyers about a product’s appearance, size, condition, features, or functionality. An AI-generated lifestyle background placed behind an accurate product photo is generally fine. An AI-generated product image that makes a low-quality item look significantly better than it actually is violates policy and creates return and review problems regardless of whether Amazon catches it first.

    For secondary images — lifestyle shots, infographics, environmental backgrounds — AI generation tools offer genuine efficiency gains for sellers who can’t afford full photography productions for every SKU. The product itself still needs to be represented accurately.

    For the main image, Amazon requires actual product photography — no renders, no illustrations, and no AI-generated product representations that stand in for real product photos. The main image must show the actual product.

    Disclosure Requirements

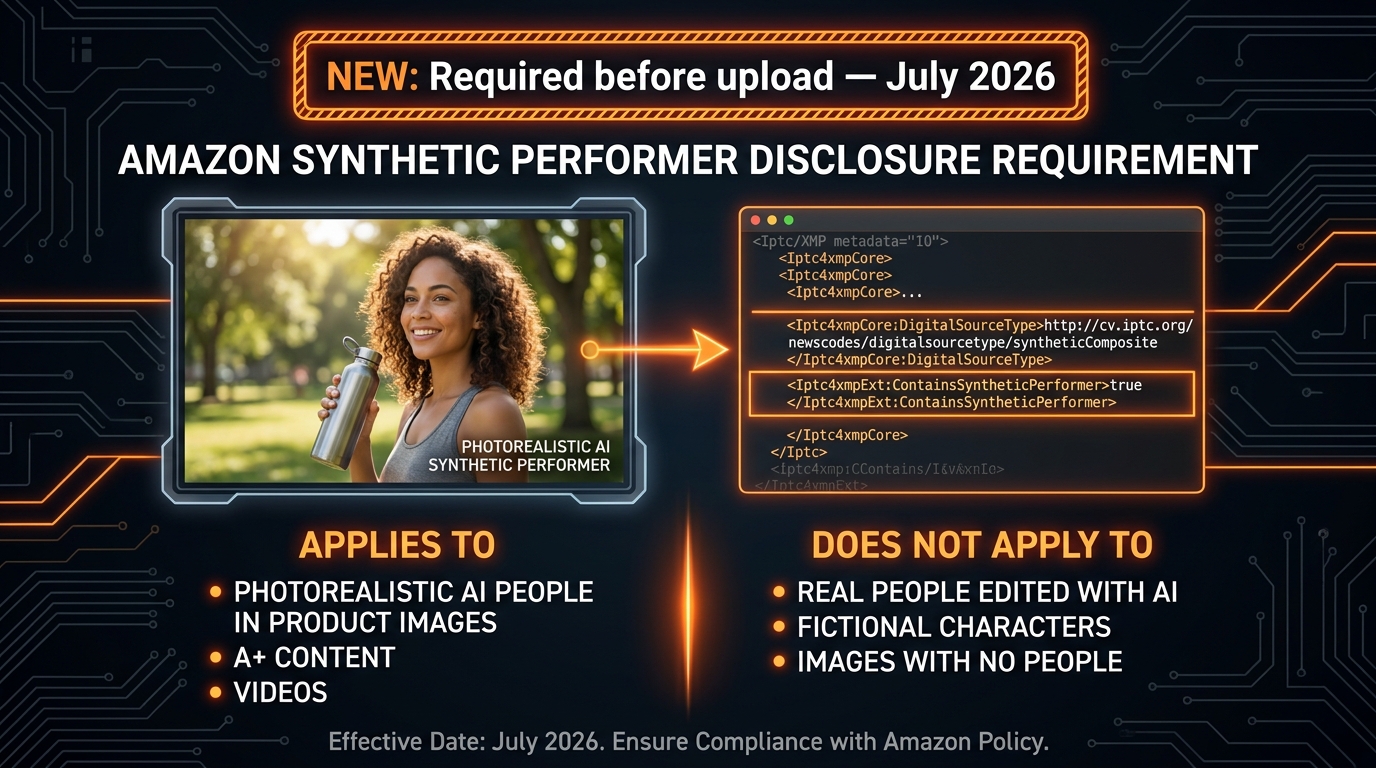
    Amazon’s 2026 policy requires disclosure of AI-generated content. For product listings, this primarily applies to AI-generated text and AI-generated cover images in KDP (Kindle Direct Publishing). For standard product listings, the practical disclosure requirement is less clearly defined in Seller Central policy documentation — but the accuracy standard remains the governing rule regardless of how an image was created.

    Separately, several U.S. states have enacted or will enact AI content labeling laws in 2026 that may apply to marketing images. New York’s SB8420A (effective June 2026) requires labeling of AI-generated human likenesses in marketing images sold to New York consumers. California’s SB 942 (effective August 2026) mandates AI watermarking on AI-generated content sold to California consumers. Sellers using AI-generated lifestyle images featuring human models should monitor these state-level requirements independently of Amazon’s own policies.

    Amazon Nova Canvas

    Amazon’s own AI image generation tool, Nova Canvas, now includes a virtual try-on feature that allows sellers to upload a product image and generate visualizations of the item in use — clothing items on models, furniture in room settings. These AI-generated visualizations, generated through Amazon’s own tooling, operate within Amazon’s own content standards. For sellers interested in AI-assisted imagery, using Amazon’s native tools creates a cleaner compliance path than third-party AI generators whose outputs may introduce unexpected issues.

    Category-Specific Rules and Exceptions

    Amazon’s image policy has a standard framework and then a layer of category-specific rules that override or supplement it. The standard rules discussed throughout this guide apply broadly, but these category exceptions matter.

    Apparel and Clothing

    Apparel main images may show products on a human model (standing, not hovering or crouching) or displayed on a hanger or laid flat. White backgrounds are still required. Child clothing must be shown either as a flat lay or on an invisible mannequin — never on a child model. The model-or-flat-lay decision affects your CTR: most A/B testing data from apparel sellers indicates that model shots outperform flat lays significantly for tops, dresses, and outerwear.

    Jewelry and Watches

    Jewelry main images may use a mannequin (hand, neck stand) but not a human model for the main image. Amazon specifically notes that zoom functionality may be disabled for handmade or certain fine jewelry items. If zoom is disabled for your category, this affects the calculus on resolution — the minimum 1,000-pixel spec becomes the de facto effective size since buyers can’t zoom in regardless.

    Shoes and Footwear

    Footwear main images should show the pair (not a single shoe) on a pure white background. Amazon also offers a virtual try-on AR feature for footwear in the U.S. and Canada that allows buyers to visualize shoes on their feet via the Amazon app. Participating in this feature requires meeting additional image quality and angle requirements specified in Seller Central for footwear sellers.

    Consumables, Supplements, and Food Products

    These categories face heightened enforcement attention in 2026. Supplements in particular are subject to stricter automated checks for text overlays, health claims, and badges on the main image. Sellers in this category should assume a zero-tolerance approach and avoid any text or graphic elements on the main image, even packaging text that extends to the edges of the product and appears in the photo naturally.

    3D Renders

    3D product renders are explicitly allowed in secondary image slots across most categories. They are not permitted for main images. This distinction is important for sellers of products that are difficult to photograph accurately — electronics, complex mechanical items, multi-component systems — where 3D renders can communicate assembly and function more clearly than standard photography.

    The 2026 Image Audit: A Step-by-Step Compliance Checklist

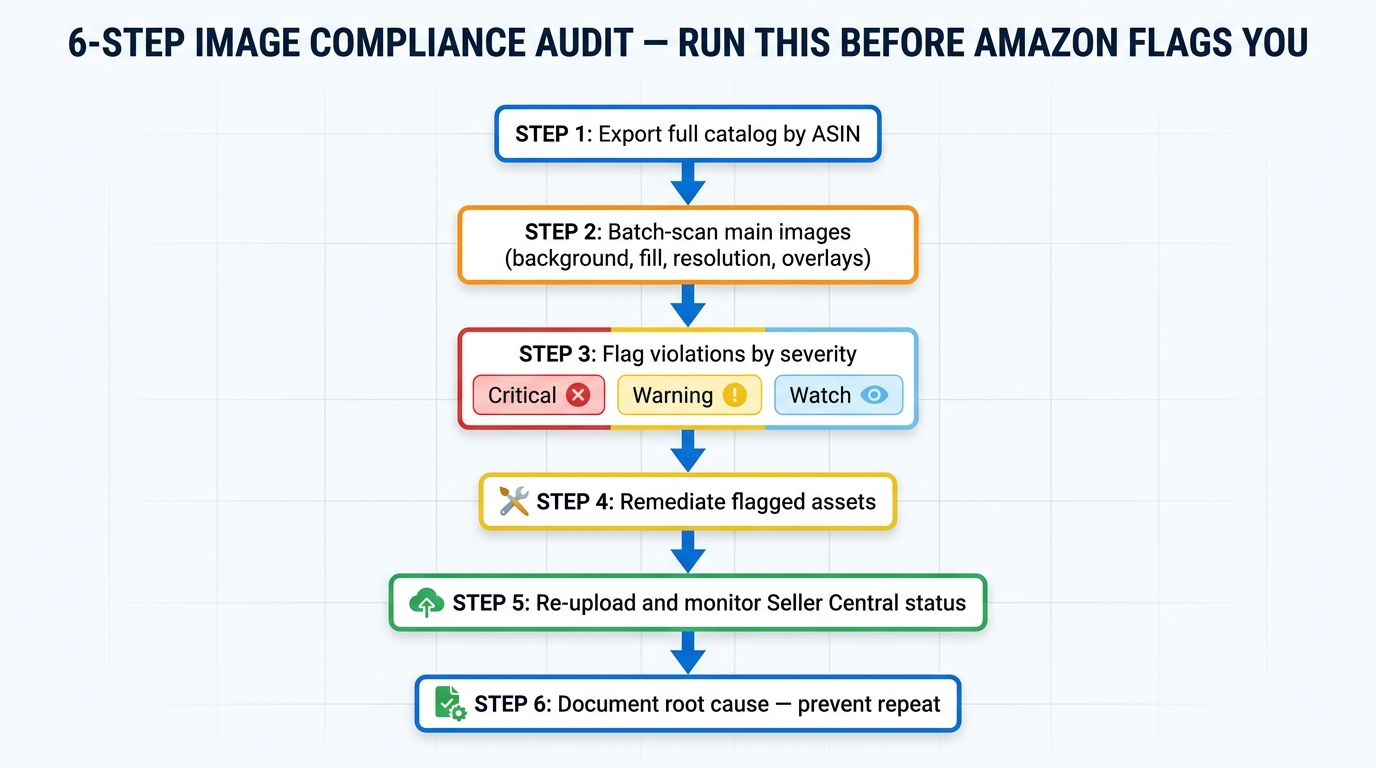
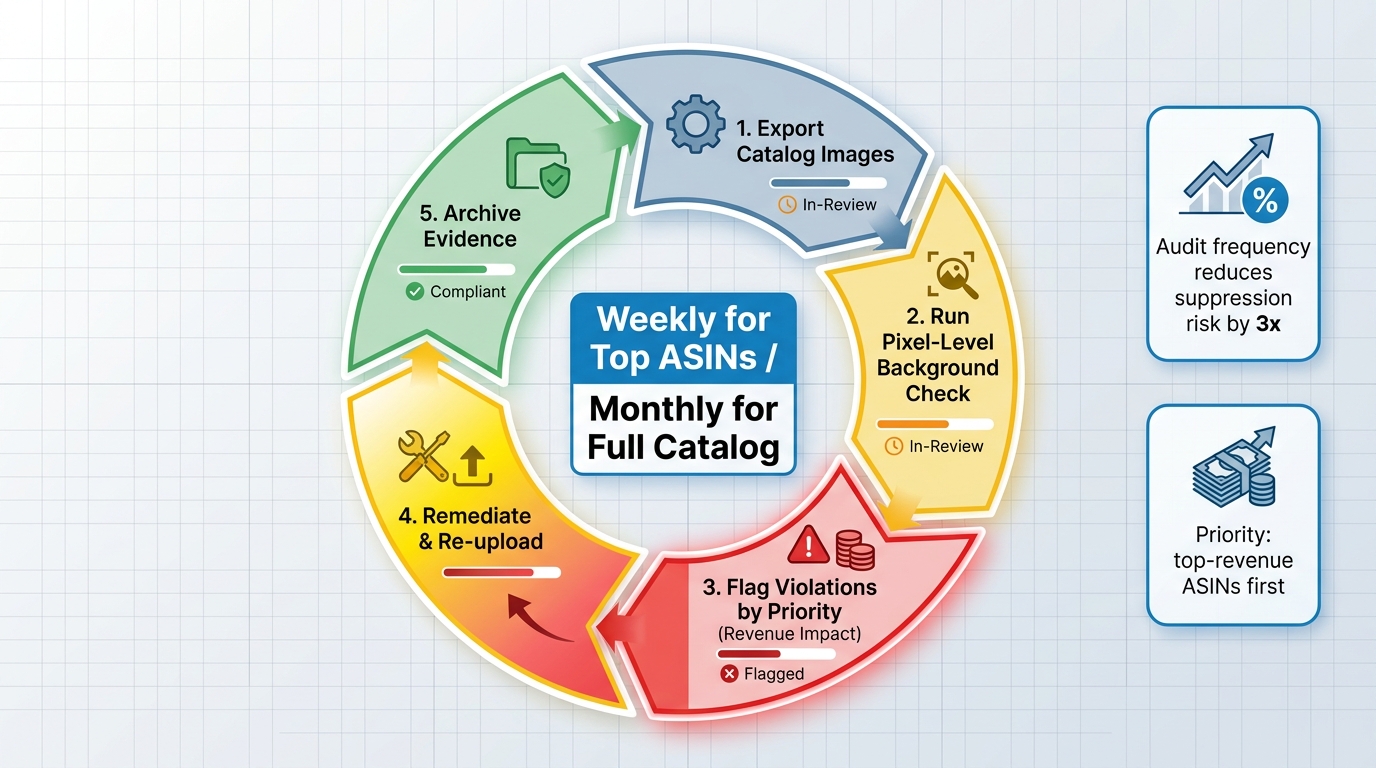
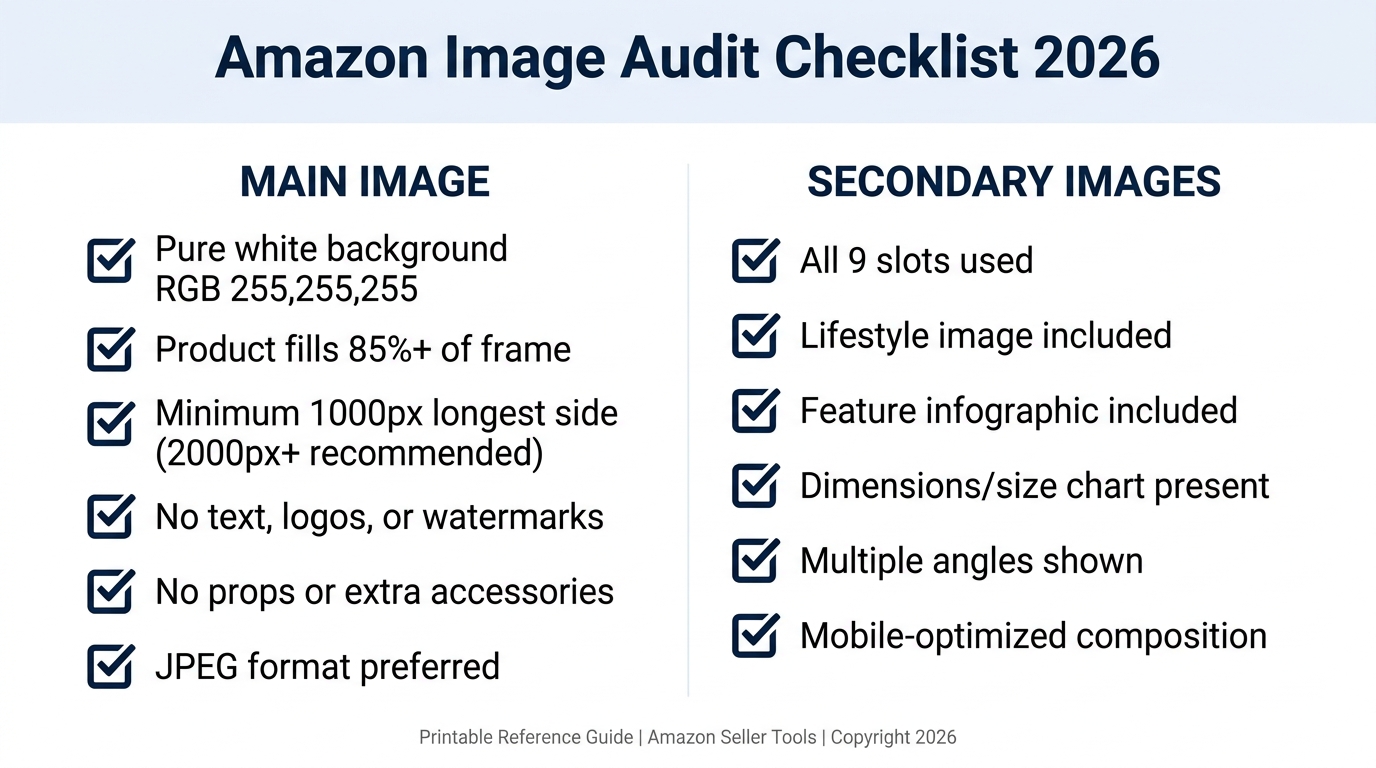
    Amazon image audit checklist for 2026 showing main image and secondary image compliance criteria

    Running a systematic image audit across your catalog is one of the highest-return activities available to established Amazon sellers. Even well-maintained listings develop compliance drift over time as policy updates occur, as new competitors reset buyer expectations for image quality, and as mobile rendering evolves. Here is a structured process for auditing your catalog’s image health.

    Step 1: Pull Your Suppression Report

    Before auditing subjective quality, address any active compliance failures. In Seller Central, go to Inventory → Manage Inventory → Suppressed. Document every suppressed listing with its suppression reason. These are your priority-one fixes — suppressed listings are generating zero organic impressions and zero sales.

    Step 2: Main Image Technical Check

    For each listing, download the current main image and verify:

    • Background pixel values — use the color picker in your editor to sample at least 5 background regions. All should read R:255, G:255, B:255
    • Image dimensions — confirm the longest side is at least 1,000 pixels (2,000+ preferred)
    • Product frame fill — estimate what percentage of the total image area the product occupies. Below 85% requires a reshoot or reframe
    • Prohibited elements — check for any text, logos, watermarks, props, multiple products, or non-white background elements
    • File format — confirm JPEG or accepted alternative (PNG, TIFF, non-animated GIF)

    Step 3: Secondary Image Content Audit

    For each listing, assess whether your secondary images cover the core bases:

    • Is there a lifestyle image showing the product in realistic use?
    • Is there an infographic addressing the top 2–3 buyer questions?
    • Is there a size or dimension reference?
    • Is there a close-up showing material quality or key details?
    • Are you using all available slots, or are some empty?
    • Is the infographic text legible at mobile thumbnail scale?

    Step 4: A+ Content Image Dimension Check

    If you have A+ content on your listings, open each A+ template and confirm that the images in each module match the required dimensions for that module type. Check specifically for any auto-cropping that Amazon may have applied to images uploaded at non-standard sizes — this is a silent quality degrader that many sellers don’t notice until they look at the live listing on a device.

    Step 5: Mobile Rendering Review

    View the live listing on a mobile device — specifically the Amazon app on a smartphone, not a mobile-simulated browser view. For each listing, assess:

    • Does the main image thumbnail communicate the product clearly at small scale?
    • Does the product appear to occupy a large enough portion of the thumbnail?
    • Do the secondary images read well when tapped and viewed in the carousel?

    Step 6: Competitive Benchmarking

    Search for your target keywords on mobile and look at the top 10 results. How does your main image compare in visual impact to the best-performing competitors? If the gap is significant, that gap is costing you CTR, and CTR is connected to ranking. This competitive benchmark review should happen at least quarterly — buyer expectations and competitive image quality both drift over time.

    Prioritizing Your Audit Findings

    After auditing your catalog, prioritize fixes in this order: (1) active suppressions, (2) non-compliant main images on high-revenue ASINs, (3) low-quality or incomplete secondary images on high-revenue ASINs, (4) A+ content dimension corrections, (5) mobile optimization across the full catalog. Focus your investment where your revenue is most concentrated first — a 1% CTR improvement on a high-volume ASIN generates more absolute value than perfect compliance on a low-traffic product.

    From Compliance to Conversion: Building an Image System That Scales

    The technical specifications covered in this guide are the foundation — they keep you in the marketplace and ensure your listings aren’t suppressed. But the difference between a compliant listing and a high-converting listing is the layer above technical compliance: composition, visual hierarchy, storytelling, and buyer psychology.

    Build a Style Guide for Your Image Set

    If you sell multiple products, inconsistent image styling across your catalog dilutes brand recognition and makes your storefront look fragmented. Develop a simple image style guide that defines: background and color palette for lifestyle images, font choices and sizes for infographic overlays, photography tone (warm/neutral/cool), and consistent angle conventions for main images across your product line. This guide doesn’t need to be elaborate — a single reference document with examples is enough to brief photographers and designers consistently.

    Build a Testing Habit Into Your Process

    For Brand Registry members, Manage My Experiments is one of the most actionable tools on the platform. You can run controlled A/B tests on main images, A+ content, product titles, and other listing elements with real traffic and statistically measured outcomes. Most sellers do not use this feature nearly as often as they should. A main image test running for 4–6 weeks on a reasonable-volume ASIN gives you directional data that can permanently improve your click-through rate and conversion rate for that product.

    The Real ROI of Professional Photography

    Professional product photography has upfront costs — typically several hundred to several thousand dollars depending on the number of SKUs, the complexity of the shoot, and the style of photography required. This investment is frequently framed as a cost rather than a conversion asset, which leads sellers to defer it. But when you consider that a listing’s images directly determine its click-through rate, and that CTR affects both conversion and organic ranking, the financial return on high-quality photography in a well-merchandised listing is typically measured in months, not years.

    If full professional photography is not currently accessible, a partial investment approach works: prioritize professional photography for your top 5–10 highest-revenue ASINs first, and use that investment to benchmark the quality level you want to achieve across your catalog over time.

    Watch for Policy Updates

    Amazon’s image policy evolves. The changes that hit sellers hard in early 2026 — stricter background checks, more aggressive suppression automation, the image overwrite expansion — were documented in Seller Central policy updates that many sellers didn’t see until the impact was already felt. Set a recurring task to review the Amazon Seller Central news section and image policy documentation at least once per quarter. The five minutes it takes to stay current is a fraction of the time it takes to recover from a suppression event caused by a policy change you missed.

    Conclusion: The Sellers Who Win on Image Are Playing a Different Game

    Amazon’s image requirements in 2026 are tighter, the enforcement is more automated, and the competitive bar for image quality has risen alongside the platform’s maturation. Sellers who treat image compliance as a checkbox and image quality as an optional upgrade are operating at a structural disadvantage that compounds over time.

    The sellers who consistently outperform on Amazon understand that their images are their storefront. In the absence of physical presence, a buyer’s entire perception of a product’s quality, value, and relevance is built from images — and the 6 seconds they spend with those images in a search result decides whether your product gets a click or a scroll-past.

    Here is a consolidated set of actionable takeaways from everything covered in this guide:

    • Verify RGB 255, 255, 255 for every main image background — not visually, but with an eyedropper tool in your editing software
    • Shoot at 2,000+ pixels on the longest side — the 1,000-pixel minimum is a compliance floor, not a quality target
    • Use all 9 image slots — every empty slot is a missed opportunity to answer a buyer question and prevent an objection
    • Build secondary images as a visual sales sequence — lifestyle, features, size, close-up, angles, packaging, comparison
    • Design for mobile first — over 70% of your buyers are on smartphones; check your thumbnails on an actual device
    • Match A+ module dimensions exactly — use the module-by-module specifications to prevent auto-cropping
    • Monitor for suppression actively — check your Manage Inventory suppression queue regularly, not only when sales drop
    • Run A/B image tests on your highest-revenue ASINs using Manage My Experiments — real data beats assumptions every time
    • Keep AI-generated images accurate — use them where they help efficiency in secondary slots, but never at the expense of accurate product representation
    • Check policy updates quarterly — the enforcement landscape changes, and staying ahead of it is a competitive advantage in itself

    The technical specifications in this guide reflect Amazon’s documented standards as of 2026. Where Amazon’s own documentation and Seller Central resources are updated, those sources should be treated as authoritative over any third-party reference, including this one. Build a habit of going back to the source — and build an image system that doesn’t have to scramble to catch up when the rules change.

  • Sponsored Products Video Ads in 2026: The Seller’s Creative & Campaign Execution Guide

    Sponsored Products Video Ads in 2026: The Seller’s Creative & Campaign Execution Guide

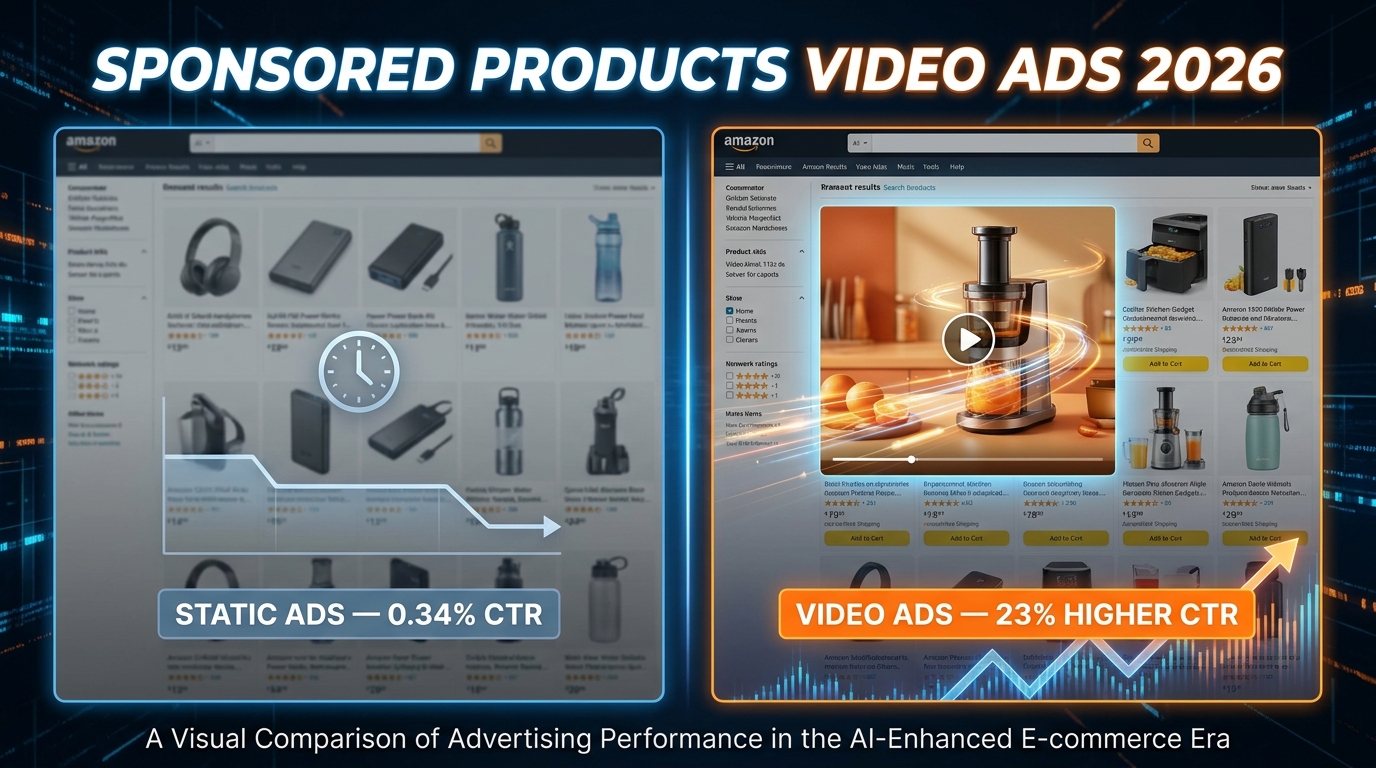
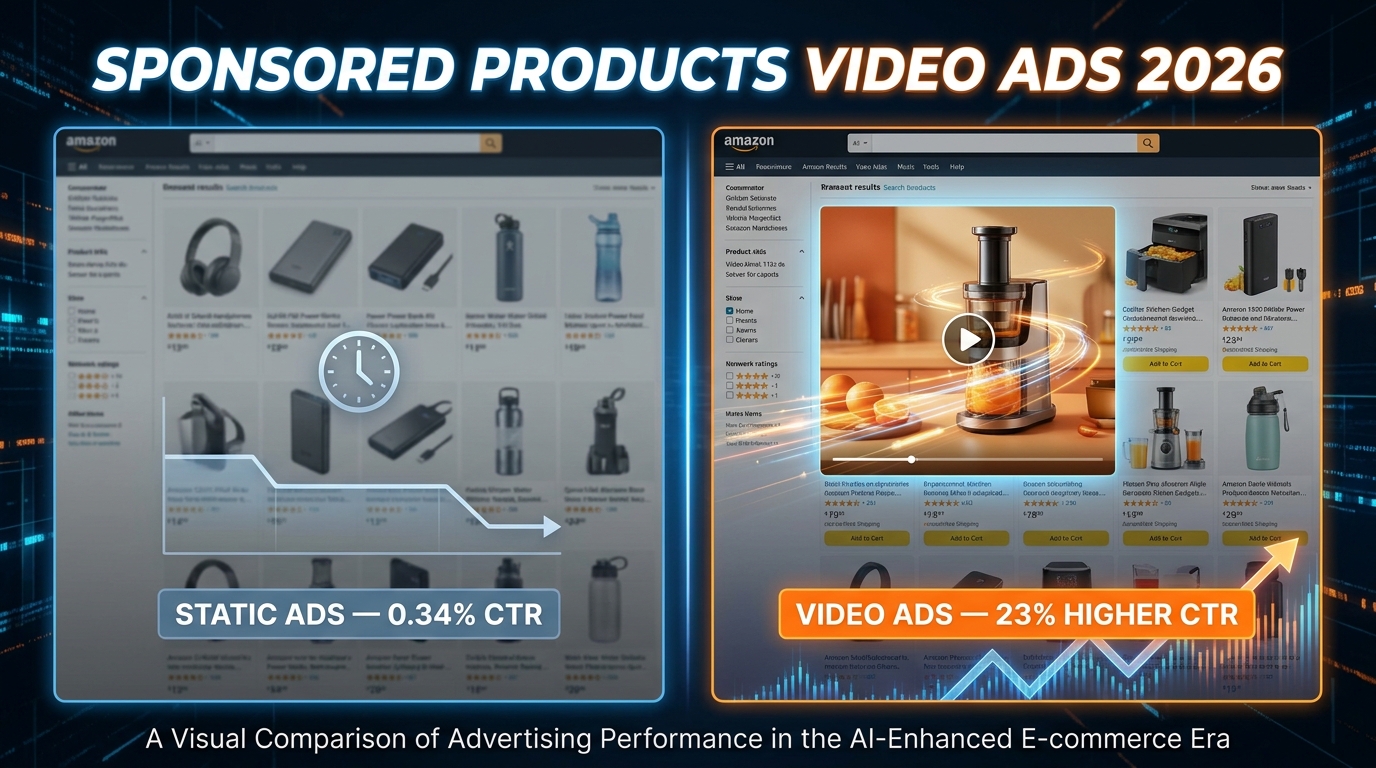
    Sponsored Products Video Ads 2026 — static ads vs video ads CTR comparison

    For most of Amazon’s advertising history, the word “video” and the words “Sponsored Products” lived in completely different conversations. Video was for brand storytelling — the eye-catching banner at the top of the search results page that brand-registered sellers used for awareness campaigns. Sponsored Products were the workhorse: static, efficient, and responsible for the majority of ad revenue across the platform. The two formats coexisted but never truly merged.

    That changed in 2026. Amazon officially rolled out Sponsored Products Video Ads (SPV) in Q1 of this year, inserting autoplay video directly into the search results grid — the very same placement where static product images have always competed for attention. This isn’t a cosmetic update. It’s a structural change to how Amazon’s search engine results page (SERP) works, and it has significant implications for every seller who runs PPC campaigns.

    The timing is not accidental. Amazon is responding to a documented shift in shopper behavior. TikTok Shop, YouTube Shopping, and Instagram’s shoppable video features have conditioned a generation of buyers to expect motion when they browse. Static images are increasingly invisible to a scroll-trained eye. Amazon’s answer is to bring the feed-like discovery experience into its own search grid — and it’s doing it through the most conversion-focused ad type it has ever offered.

    This guide is built specifically for sellers who are past the “what is it?” stage and want to know how to actually execute. We’ll cover the technical specs, the creative psychology, the campaign architecture, the bid mechanics, and the specific pitfalls that will bleed your budget if you’re not paying attention.

    What Sponsored Products Video Ads Actually Are (And What They’re Not)

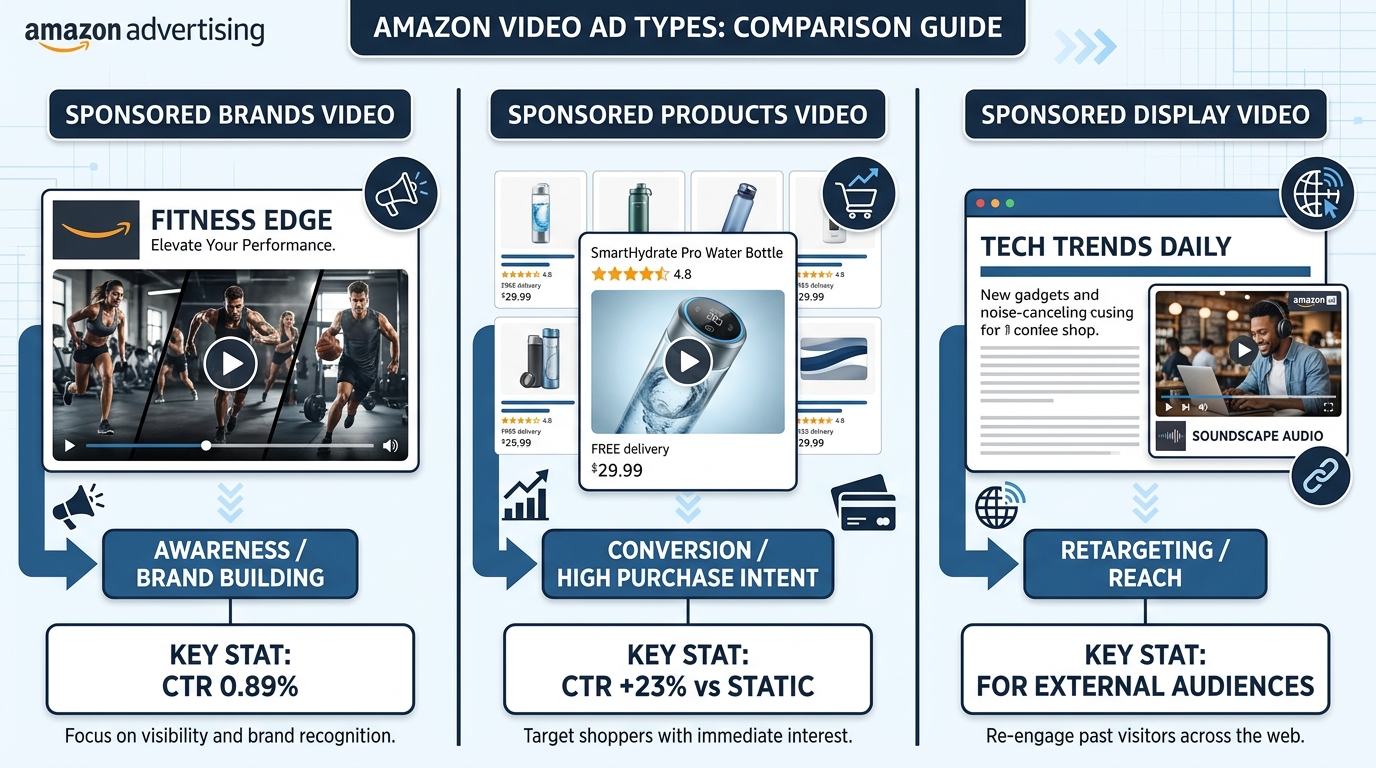
    Three Amazon video ad types compared — Sponsored Brands Video, Sponsored Products Video, Sponsored Display Video

    Confusion about Amazon’s video ad ecosystem is widespread, and it matters because getting the terminology wrong leads to choosing the wrong format for the wrong goal. Let’s clarify exactly what Sponsored Products Video Ads are and how they fit alongside Amazon’s other video placements.

    Sponsored Products Video (SPV): The Conversion Engine

    Sponsored Products Video Ads are video assets attached directly to individual ASIN campaigns inside the standard Sponsored Products framework. They appear inside the search results grid — not in a banner above it, not in a sidebar — in the same placement where static product images have always competed. When a shopper scrolls through Amazon search results, the video autoplays silently, displaying your product in motion.

    Key characteristics of SPV:

    • Placement: Within the organic-looking search grid (mid-page and in-feed), mobile and desktop search results, enhanced mobile app surfaces
    • Autoplay behavior: Muted, silent autoplay — your video must work without sound
    • Targeting: All standard Sponsored Products targeting options apply — auto campaigns, manual keyword targeting (broad/phrase/exact), and ASIN product targeting
    • Eligibility: Available to all sellers, including those without Brand Registry — this is a major differentiator
    • Billing: Standard CPC model, same auction mechanics as static Sponsored Products
    • Videos per ASIN: Up to 5 short feature videos per ASIN, with shoppers able to tap between clips using clickable thumbnails

    How It Differs From Sponsored Brands Video (SBV)

    Sponsored Brands Video is a fundamentally different product. SBV ads sit at the top of search — above all organic listings — and require Brand Registry enrollment. They’re designed to tell a brand story with headline text, a logo, and a product card below the video. SBV is a brand-building and awareness tool that happens to convert reasonably well. Its average CTR is 0.89%, which is strong, but its conversion rate (1–3%) trails SPV’s conversion-focused placement.

    SPV, by contrast, lands a shopper directly on the product detail page when clicked. There’s no brand story interlude. The click intent is almost always purchase-ready, which is why conversion rates for SPV trend toward the 2–5% range (with top performers significantly higher). SPV also isn’t limited to brand-registered sellers, meaning even newer accounts can use it immediately.

    Sponsored Display Video: The Retargeting Layer

    Sponsored Display Video is Amazon’s off-Amazon retargeting product. It serves video to shoppers who have previously viewed your product page, browsed similar categories, or visited your Amazon Storefront — both on Amazon and across external websites and apps. If SPV is about winning the moment of search, Sponsored Display Video is about re-engaging shoppers who were almost buyers but didn’t convert. Think of them as operating at different stages of the purchase funnel, not competing with each other.

    The strategic takeaway: SPV wins at point-of-purchase; SBV builds brand equity; Sponsored Display Video handles retargeting. All three can work simultaneously in a sophisticated account, but they solve different problems.

    The 2026 Performance Benchmarks: What the Data Actually Says

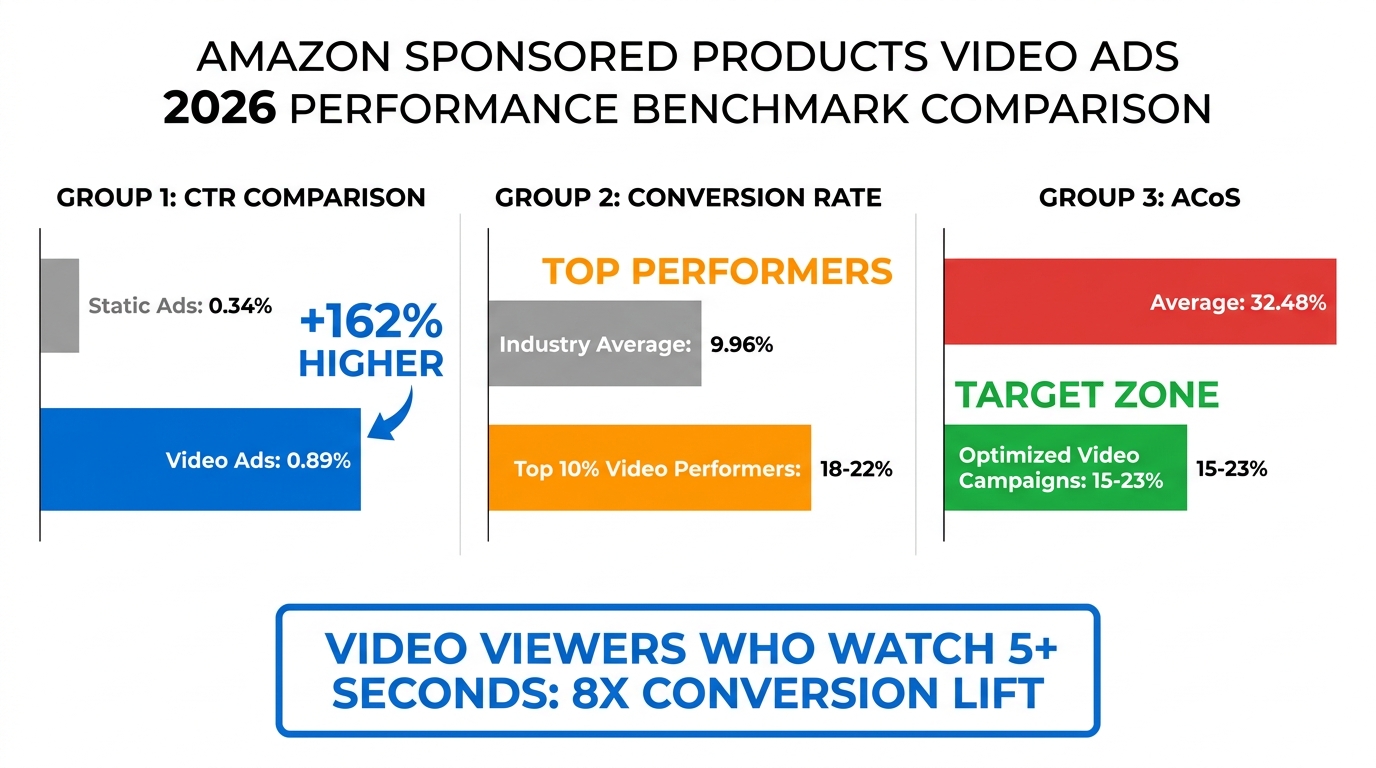
    Amazon Sponsored Products Video Ads 2026 performance benchmarks — CTR, CVR, and ACoS comparison chart

    Before you can set meaningful targets for an SPV campaign, you need an accurate read on what the format is actually delivering in 2026. The numbers here are real, but they come with important context that most summaries gloss over.

    Click-Through Rate (CTR)

    Static Sponsored Products ads average a CTR of 0.34% across the platform (Stormy.ai, 2026). Sponsored Products Video Ads, in Q1 2026 beta tests, posted 23% higher CTR than static image equivalents — putting average SPV CTR in the range of 0.42–0.60% when controlling for category and price point. Sponsored Brands Video, for comparison, averages 0.89% CTR, but it occupies the premium top-of-search placement rather than the mid-grid position where SPV competes.

    The 23% lift is meaningful, but it’s an average across all SPV campaigns. The actual variance is enormous. Product categories where motion naturally demonstrates value — kitchen appliances, fitness equipment, personal care devices, cleaning tools, anything with a before/after story — see dramatically higher CTR lifts. Categories with low differentiation or commodity products (bulk paper, plain phone cables) see smaller gains.

    Conversion Rate (CVR)

    The more interesting number is CVR. The overall Amazon platform conversion rate averages around 9.96% (SequenceCommerce, 2026), which is already 7–8x higher than typical e-commerce. SPV campaigns average 10.2–11.5% CVR across all categories. Top-performing campaigns — typically in consumables, home goods, and personal care — achieve 18–22% CVR.

    The critical variable is engagement depth. Shoppers who watch a Sponsored Products Video for more than 5 seconds convert at roughly 8x the rate of those who don’t engage with the video at all. This is the number that should drive your entire creative strategy: your goal isn’t just to stop the scroll. It’s to hold attention past the 5-second mark.

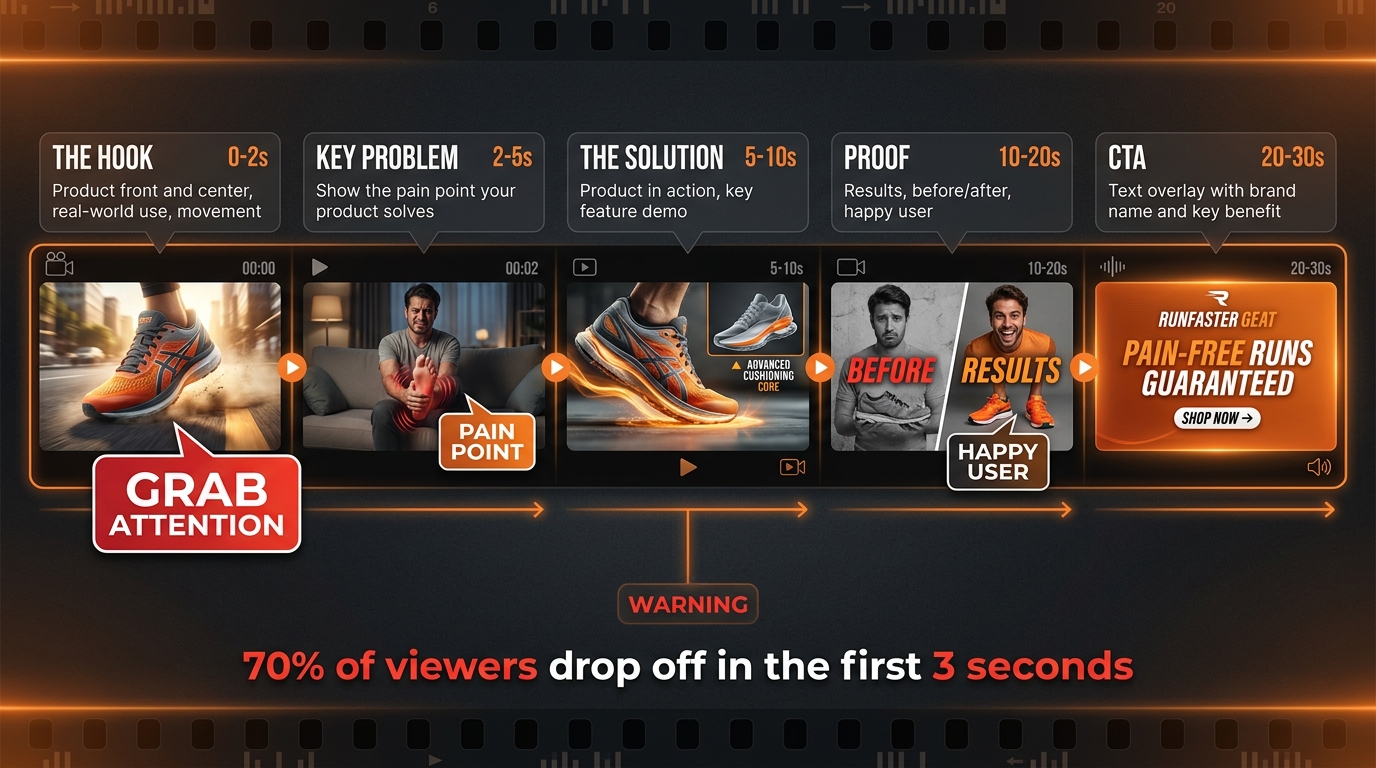
    There’s a counterweight here: 70% of viewers drop off within the first 3 seconds (SellerMetrics, 2026). The gap between “scroll past” and “5-second viewer” is the creative problem that separates winning SPV campaigns from wasted spend.

    ACoS Benchmarks

    Average ACoS for Sponsored Products campaigns sits at approximately 32.48%. Well-optimized SPV campaigns target 15–23% ACoS, which requires both strong creative (high CTR) and targeted keyword selection (high CVR). Sellers who launch SPV without adjusting their keyword targeting or creative strategy often see ACoS spike initially — especially in the first 2–4 weeks while the algorithm gathers engagement signal data.

    Category-Level Variance

    Performance varies significantly by category. Consumables and repeat-purchase categories average CVR above 15%. Electronics hover around 5% due to longer consideration cycles. Health and personal care, kitchen and dining, and pet supplies all trend above the platform average. If you’re in a low-CVR category, SPV can still be worthwhile, but your creative needs to work harder on trust-building rather than impulse response.

    Price Point Effect

    Amazon’s 2026 data shows a clear inverse relationship between price and conversion rate across all ad types: products priced below $25 convert at 12.5%, $25–$50 at 10.2%, $50–$100 at 8.7%, and above $100 at 6.4%. SPV doesn’t eliminate this dynamic — it compresses the gap by using video to handle objections before the click — but it doesn’t reverse it. Higher-priced products benefit from SPV’s storytelling capacity but need longer, more detailed videos to move the needle.

    Technical Specs and Creative Requirements for SPV in 2026

    Getting rejected during the ad review process is an expensive delay. Amazon’s moderation team applies strict standards to video assets, and understanding the technical requirements before production begins saves time and budget. Here’s exactly what you need to know.

    Video Specifications

    • File format: MP4 or MOV
    • Codec: H.264 (primary recommendation); H.265 also accepted
    • Resolution: Minimum 1280×720px; recommended 1920×1080px; 4K (3840×2160px) accepted
    • Aspect ratio: 16:9 horizontal (standard); 9:16 vertical now available in 2026 for mobile-first placements
    • Frame rate: Minimum 15 fps; recommended 23–30 fps
    • File size: Maximum 500MB
    • Duration: Minimum 7 seconds; no hard maximum — recommended sweet spot is 15–30 seconds
    • Audio: Not required; videos autoplay muted — your creative must work in silent mode
    • Bitrate: Approximately 2 Mbps recommended

    Creative Policy Requirements

    Amazon’s content guidelines for SPV are more exacting than for static images. Common rejection reasons include:

    • Black bars (letterboxing/pillarboxing): Videos must fill the frame completely. Any black bars are an automatic rejection.
    • Unsubstantiated claims: Health claims (“cures,” “proven to”), performance superlatives (“best,” “#1”), or comparative claims without clear evidence will be flagged.
    • External logos or competitor branding: Any identifiable competitor branding in frame violates policy.
    • Low production quality: Excessively shaky footage, poor lighting, or obviously degraded resolution can result in rejection even if specs are met.
    • Ending on a static frame: Videos that freeze on a still image at the end are typically rejected — your final frame should still be in motion or loop back to the beginning.

    The Multi-Video Feature: 5 Assets Per ASIN

    The most significant technical addition in 2026 is the ability to upload up to 5 short feature videos per ASIN. Amazon displays up to 3 thumbnail previews beneath the main video slot, allowing shoppers to tap between clips without leaving the search results page. Each video can focus on a different product feature, use case, or customer segment.

    This changes the creative strategy substantially. Rather than trying to cram every product benefit into a single 30-second video, you can build a library of targeted short clips — one addressing portability, one demonstrating durability, one showing the setup process, one featuring real-world use. Amazon’s algorithm selects which thumbnail appears based on relevance signals tied to the search query. A search for “waterproof” might surface your durability clip; “easy assembly” might surface your setup video.

    Vertical Video for Mobile (9:16)

    Amazon’s 2026 rollout of 9:16 vertical format for SPV deserves attention from any seller whose analytics show high mobile traffic (which is most sellers — mobile accounts for over 60% of Amazon browse traffic). Vertical video fills the phone screen natively, eliminating the visual “shrink” effect of horizontal video on a mobile display. Early data suggests 2–3x higher CTR for vertical format vs. horizontal on mobile placements. If your production workflow can accommodate it, shoot vertical-first and crop for 16:9 as a secondary deliverable.

    Creative Psychology: Building a Video That Earns the 5-Second Watch

    Anatomy of a perfect Amazon Sponsored Products video ad — 5-frame storyboard from hook to CTA

    The 70% drop-off rate in the first 3 seconds is the single most important data point in this entire guide. It means most of the people who see your video ad don’t watch it long enough to receive the message. And the 8x conversion lift for viewers who reach 5 seconds tells you exactly what’s at stake in those first few seconds. This is a creative execution problem disguised as a data problem.

    Frame One: Product Must Be Visible Immediately

    Amazon’s own guidelines specify that the product should appear within the first 1–2 seconds. This isn’t a suggestion — it’s a direct performance driver. Videos that open with a branded intro card, a scenic establishing shot, or an abstract visual teaser perform measurably worse than videos that lead with the product itself. Remember: the shopper is already on Amazon with purchase intent. They don’t need brand awareness; they need product confidence. Give them the product immediately.

    The best-performing first frames show the product in motion — being held, being used, being operated — not just sitting on a table. Motion is what makes the viewer stop scrolling in the first place.

    The Hook Mechanics: Four Approaches That Work

    Beyond leading with the product, your first 3 seconds need an additional “hook” layer that creates a reason to keep watching. Four hook types have demonstrated consistent performance:

    1. The Problem Statement: Show the problem your product solves visually, before you show the solution. A foot pain product that opens with someone wincing while walking is more arresting than a product sitting in a box. The viewer thinks, “I know that feeling.” That emotional match earns the continued watch.
    2. The Transformation Hook: A rapid before/after visual cut (dirty sink → spotless sink; tangled cord → organized desk) creates curiosity about the mechanism. The viewer watches to understand how the transformation happens.
    3. The “How Does That Work?” Hook: Show the mechanism of your product operating in a way that’s slightly surprising or satisfying. Satisfying mechanical motions, precise fits, or unexpected product behaviors exploit the brain’s natural attention to novelty.
    4. The Question Overlay: A text overlay posing a direct question (“Tired of your blender leaking?”) combined with matching visuals creates cognitive engagement — the viewer’s brain automatically seeks the answer by continuing to watch.

    The Silent Video Rule

    Because SPV autoplays muted, sound is effectively optional. Text overlays are not optional. Every key message in your video — the problem, the benefit, the product name, the primary feature — should be communicated through text on screen, not through narration or product voiceover. Assume every viewer is watching in a quiet library or on a bus with no earphones. If your video requires audio to make sense, you’ve lost the sale before the 5-second mark.

    Text overlays should be brief (3–5 words maximum per frame), high-contrast against the background, and timed to appear as the relevant visual element enters frame. Don’t front-load all your text in the first 2 seconds — distribute it across the video timeline to give viewers a reason to keep watching.

    Creative Frameworks That Consistently Underperform

    The data also tells us what doesn’t work. Several creative approaches that perform well on YouTube or social media translate poorly to SPV’s context:

    • Talking-head testimonials as the lead: A person speaking to camera (even without audio) reads as a social ad, not a product search result. Shoppers are in “product evaluation” mode, not “content consumption” mode. Open with product, transition to testimonial if needed later.
    • Brand story openers: Your brand’s founding story is interesting to existing customers. To a first-time searcher on Amazon, it’s dead time in a format where dead time costs conversions.
    • Lifestyle-first content: Beautiful cinematography of people in aspirational settings, with the product appearing at the 8-second mark, loses most viewers before they ever see the product. Amazon’s internal data shows product demos outperform lifestyle content 3-to-1 on SPV placements.
    • Long list videos: Videos that cycle through 10+ product features without narrative structure result in viewers absorbing none of them. Focus each video on one or two features maximum.

    Leveraging the 5-Video System Strategically

    The multi-video asset capability isn’t just a technical convenience — it’s a segmentation tool. Different shoppers search with different intents, and your 5 videos can each speak to a distinct buying motivation:

    • Video 1 (Primary): The “conversion” video — product in action, primary benefit, direct and fast
    • Video 2: Feature deep-dive — demonstrates the most asked-about feature in detail
    • Video 3: Use-case scenario — shows the product in the specific context your best customers use it
    • Video 4: Social proof / review highlight — real customer moments, unboxing, or before/after results
    • Video 5: Differentiation — a direct, factual comparison showing what makes your product different from alternatives (without naming competitors)

    Amazon’s algorithm will surface the most relevant thumbnail based on search query signals. A shopper searching a more specific long-tail phrase is more likely to see a feature-specific video than a shopper doing a broad category search.

    Campaign Architecture: Where Video Fits in Your Targeting Framework

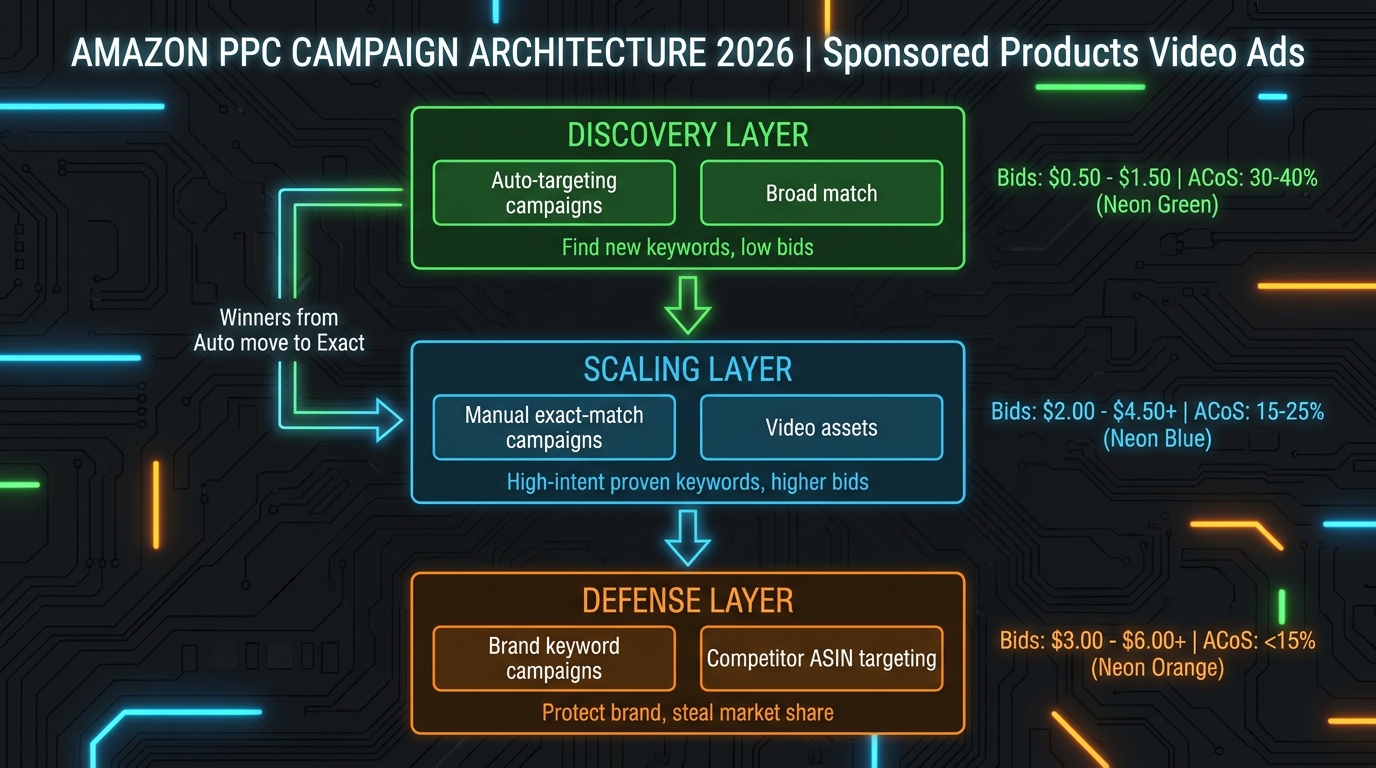
    Amazon Sponsored Products Video Ads 2026 campaign architecture — discovery, scaling, and defense layers

    One of the most practical advantages of SPV is that you don’t need to create a separate campaign type. Video assets are added directly to existing Sponsored Products campaigns within Amazon Ads console. This means your existing campaign structure, keyword lists, and bid logic can stay intact — SPV is an enhancement layer, not a parallel system. That said, the way you deploy video across your campaign tiers matters significantly.

    The Three-Layer Campaign Architecture

    A well-structured Sponsored Products account in 2026 typically operates across three functional tiers, and video should be deployed differently in each:

    Layer 1 — Discovery (Auto Campaigns): Automatic targeting campaigns are your keyword mining tool. Amazon’s algorithm matches your product against relevant searches, and you harvest converting search terms to promote to manual campaigns. SPV should be active here, but your video brief for discovery campaigns should be your most “universal” asset — the primary conversion video that appeals to the broadest interpretation of your product. Don’t over-invest video production effort on discovery campaigns; save the feature-specific videos for where you have keyword control.

    Layer 2 — Scaling (Manual Exact Match): Your proven high-intent keywords live here. These are terms you know convert, you’ve confirmed they match buyer intent, and you’re willing to bid aggressively to win them. This is where SPV earns its keep. Allocate your best-performing video here — the one with the highest 5-second engagement rate from your discovery data. Apply video-specific placement adjustments to prioritize video delivery over static ads for these keywords.

    Layer 3 — Defense (Brand + Competitor ASIN Targeting): Branded keyword campaigns protect your existing customer base; competitor ASIN targeting lets you appear on rival product detail pages. For brand defense, your video doesn’t need to sell hard — it needs to reinforce recognition and quality for shoppers who already know you. For competitor ASIN targeting, a differentiation-focused video (Video 5 in the 5-video system above) is highly effective here.

    Keyword Strategy for SPV Campaigns

    Video doesn’t change the fundamental logic of keyword selection, but it does change the ROI calculus for certain keyword types:

    • Informational long-tail keywords (“how to store food without plastic,” “best insulated water bottle for hiking”) benefit disproportionately from video because the query implies a shopper early in the consideration phase. A video that directly addresses the query’s implicit question converts better than a static image that doesn’t “answer” anything.
    • Category head terms (“water bottle,” “kitchen knife”) are extremely competitive. Adding video to your bids on these terms increases your effective quality score and may improve placement without requiring a proportional bid increase.
    • Branded competitor terms require a different video — one that leads with your product’s clear differentiator from the competition without violating Amazon’s comparative advertising policy.

    One important structural note: negative keyword hygiene becomes more critical with SPV. Because video serves as a quality signal to the algorithm, impressions on irrelevant searches can dilute your engagement rate data. A shopper who searches an irrelevant term and scrolls past your video without engaging is a data point that tells Amazon your video doesn’t resonate — even if the mismatch is purely about keyword relevance, not creative quality. Add aggressive negatives early.

    Bid Strategy and Placement Modifiers: Getting Video in Front of the Right Shoppers

    Amazon’s bidding system for Sponsored Products gives you three core strategies: dynamic bids (up and down), dynamic bids (down only), and fixed bids. With SPV, the choice of bid strategy interacts with placement modifiers in important ways.

    Dynamic vs. Fixed Bids for Video Campaigns

    Dynamic bids (up and down) allow Amazon to raise your bid by up to 100% when it predicts a high conversion probability, and lower it when probability is low. For SPV campaigns, this is generally the recommended starting point for new campaigns, because the video engagement signal is new data that Amazon is still learning. Letting the algorithm adjust gives it room to find the conversion patterns unique to your video creative.

    Dynamic bids (down only) are useful once a campaign has 30+ days of video engagement data and you’ve identified the specific keywords and placements that convert. This protects your ACoS ceiling while still allowing Amazon to reduce spend when intent signals are weak.

    Fixed bids give maximum control for exact-match campaigns on proven keywords. They’re most appropriate in Layer 2 campaigns where you have specific ranking goals and don’t want Amazon adjusting bids based on conversion probability scores that may not fully account for your video’s engagement contribution.

    Video Placement Bid Adjustments

    Amazon introduced video-specific bid adjustments for Sponsored Products in 2026, allowing sellers to apply a percentage increase specifically when video is eligible to serve (versus the fallback static image). This is a critical lever most sellers haven’t yet discovered. If you upload a video and your campaign has a +0% video placement modifier, Amazon will serve the video or the static image based purely on which it predicts will perform better. By increasing the video bid modifier to +20–40%, you tell the system to prioritize video delivery — meaning you’re paying slightly more per click, but you’re getting the higher-engagement format consistently.

    Set the video placement modifier aggressively (40–60%) during the first 30 days to accelerate data collection. Once you have enough video engagement data to see clear performance patterns, reduce the modifier to a level that maintains video priority without over-bidding relative to your ACoS targets.

    Top-of-Search vs. Rest-of-Search Placement

    Sponsored Products can appear at the top of search results or within the mid-page grid. The conventional wisdom is that top-of-search placement costs more but converts better. With SPV, this dynamic shifts slightly: mid-page video placement captures shoppers who are still scrolling and comparing — a more consideration-phase moment — while top-of-search video captures early-session intent. Test both with separate placement modifier settings and evaluate ACoS independently. Don’t assume the performance hierarchy of static ads applies equally to video.

    ACoS Control: Where Sellers Bleed Budget on SPV Campaigns

    The most common failure mode for newly launched SPV campaigns isn’t creative quality — it’s budget management during the data collection phase. Video campaigns have a higher implicit cost structure than static campaigns, because the algorithm is learning new signals (video engagement metrics) that don’t exist for static ads. Here’s where the money leaks.

    The First-30-Days Tax

    In the initial month of a SPV campaign, expect ACoS to run 10–15 percentage points higher than your static campaign benchmarks for the same keywords. This is not evidence that video isn’t working — it’s the cost of signal acquisition. The algorithm is learning which queries, placements, and audience behaviors correlate with video engagement that converts. Cutting spend or pausing campaigns in the first 30 days destroys the data-gathering process and resets the learning curve.

    Set a conservative weekly budget cap for the first month (roughly 20–30% higher than your equivalent static campaign spend) and commit to not adjusting bids downward for at least 3 weeks. Track video engagement rate in your campaign reports alongside the standard CTR and CVR metrics.

    Keyword Concentration Risk

    A common mistake is launching SPV campaigns with the same broad keyword list you use for static campaigns. Video has higher CPCs in competitive categories because you’re competing against other sellers who are also now bidding with video-quality multipliers. Running 200 keywords in a single SPV campaign dilutes your budget across too many low-volume terms and prevents any single keyword from accumulating enough data to optimize.

    Start SPV with a focused list of 20–40 high-intent, proven-converting keywords. Once you’ve established performance baselines, expand. This is the opposite of the “spray and pray” approach that works well for static campaigns but burns video budgets.

    The Engagement Rate Metric You Need to Track

    Standard Amazon campaign reports don’t show video engagement metrics (watch time, 5-second rate) by default. You need to access these through the Amazon Ads console’s video-specific report section. Pull these reports weekly during the campaign’s first 90 days. The engagement rate at the 3-second and 5-second marks tells you whether your creative is working. If you have strong CTR but low 5-second engagement, your hook is getting the click but the video isn’t building purchase intent — meaning you’re paying for low-quality traffic. Fix the creative before scaling spend.

    Negative ASIN Targeting for Video Campaigns

    When running SPV with ASIN product targeting (appearing on competitor product pages), you’re visible to shoppers who are explicitly considering an alternative. The conversion intent is real, but the ACoS can be punishing if you’re targeting hundreds of competitor ASINs blindly. Prioritize competitor ASINs with similar price points (within 20% of yours) and similar review counts. Products significantly cheaper or more established than yours will drain spend with low conversion rates regardless of how good your video is.

    Sponsored Products Video vs. Sponsored Brands Video: A Strategic Comparison

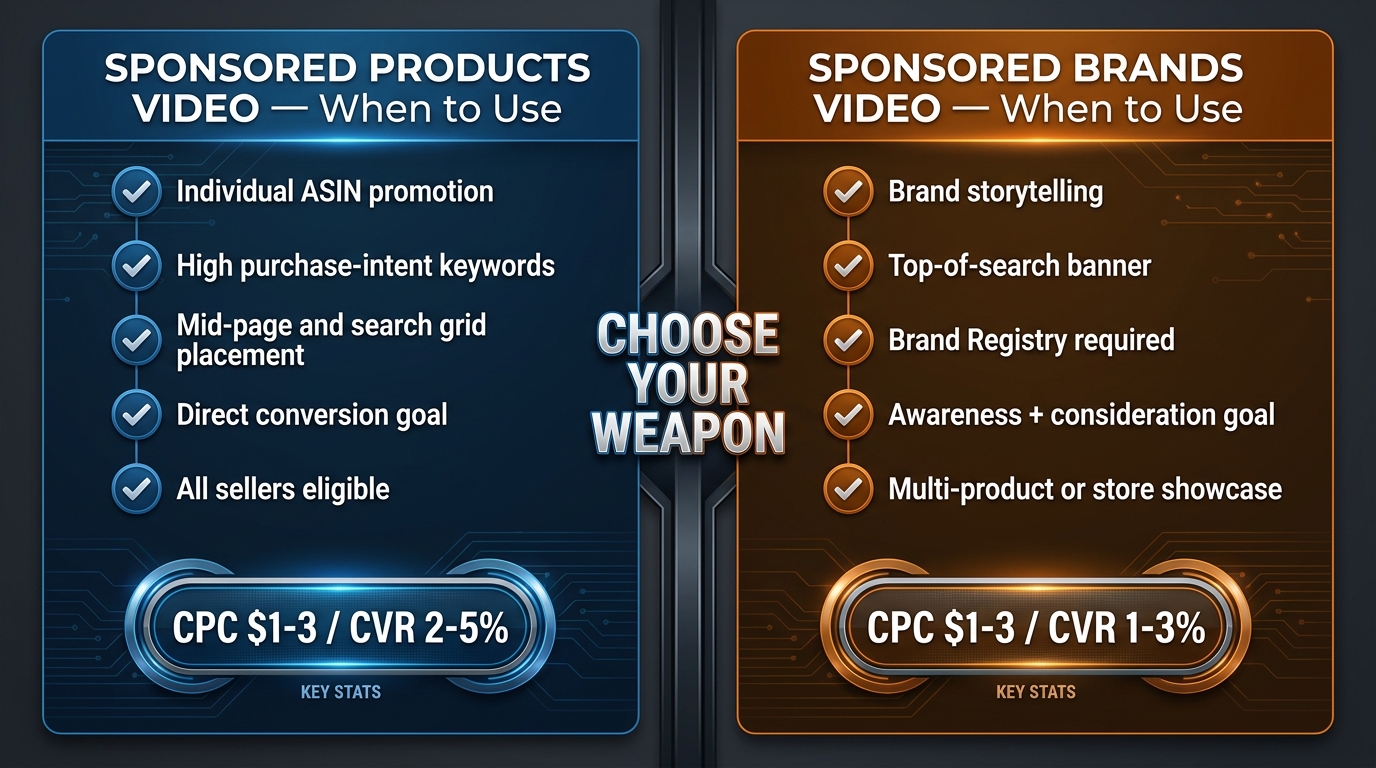
    Sponsored Products Video vs Sponsored Brands Video — strategic comparison and when to use each format

    If you’re brand-registered and running both SPV and Sponsored Brands Video (SBV), the question of how to allocate creative effort and budget between them is real and consequential. They’re not interchangeable — they’re genuinely different tools for different jobs.

    Where They Compete for Budget

    Both SPV and SBV serve video in search results. For brand-registered sellers with limited production budgets, the temptation is to use the same video asset for both. Resist this. The creative requirements for each placement are meaningfully different, and a video optimized for one will underperform in the other.

    SBV sits at the top of search, where shoppers see it before any products. The shopping mindset at that moment is “I’m about to start evaluating options.” The appropriate video for this moment has more time to set context, introduce the brand, and show the product range. SBV can be 30–45 seconds and use a slightly more cinematic opening.

    SPV appears in the mid-grid, where shoppers are already in evaluation mode — they’ve been scanning products and comparing. The appropriate video here is faster, more direct, and more focused on differentiating your specific ASIN from the others in view. SPV should rarely exceed 20–25 seconds and needs to lead with the product benefit, not brand story.

    Budget Allocation Between SPV and SBV

    A practical starting framework for brand-registered sellers running both:

    • Allocate 60–70% of video ad budget to SPV for established products with strong organic rankings and proven keyword sets. SPV operates at lower-funnel, higher-intent moments and generally delivers better direct ROAS on mature products.
    • Allocate 30–40% to SBV for new product launches, seasonal campaigns, or brand-building around category keywords where you want top-of-search presence before shoppers form strong alternatives preferences.

    This ratio flips for newer brands entering competitive categories: more SBV early to establish category awareness, transitioning to SPV-heavy allocation as the brand builds organic presence.

    Creative Repurposing: What Works and What Doesn’t

    If you must use one video for both formats, SPV requirements should drive the creative brief. A well-crafted SPV video (product-forward, fast hook, text overlays for silent viewing) will adapt to SBV with minor edits. The reverse is less true — an SBV video built around brand storytelling will lose viewers in SPV’s context before delivering its payload.

    Measuring What Actually Matters: The Right Metrics for SPV

    Amazon gives you a lot of data. Not all of it is equally useful for evaluating SPV performance. Here’s a disciplined approach to measurement that focuses on actionable signals rather than vanity numbers.

    The Metrics That Drive Creative Decisions

    5-Second Engagement Rate: The percentage of shoppers who watch at least 5 seconds of your video. This is the single most predictive metric for downstream purchase intent. Below 30% engagement rate: your hook is failing. Above 50%: your hook is strong, focus on the post-hook content. Pull this from the video campaign report section of Amazon Ads.

    Video Completion Rate (VCR): For 15–30 second videos, a completion rate above 25% indicates strong creative resonance. Below 15% suggests pacing problems in the video’s middle section. Map your pacing edits to the drop-off timeline data that Amazon provides in video reports.

    CTR relative to static baseline: Don’t evaluate your SPV CTR in isolation — compare it to your static campaign CTR for the same keywords. If SPV CTR is not at least 15% higher than static for the same keywords, either the creative needs work or the keywords are a poor match for the video’s messaging.

    The Metrics That Drive Campaign Decisions

    ACoS by keyword with video data overlay: Keywords where video engagement is high but ACoS is still elevated often indicate a listing problem — shoppers are engaging with the ad but finding something on the product detail page that kills the purchase. This diagnosis is impossible without looking at the keyword-level engagement data alongside CVR. It’s one of SPV’s most valuable hidden benefits: it forces you to see exactly where in the funnel the purchase breaks down.

    New-to-Brand rate: Amazon Ads provides New-to-Brand (NTB) data for Sponsored Products campaigns. SPV’s search-grid placement makes it more effective at reaching net-new customers than repeat-purchase retargeting. Track your NTB rate for SPV campaigns separately — a high NTB rate at acceptable ACoS means SPV is genuinely expanding your customer base, not just recycling existing demand.

    Organic rank correlation: Sales velocity generated by SPV contributes to organic ranking signals. After 60 days of running SPV on specific keywords, pull your organic rank position for those keywords and compare to a pre-campaign baseline. This is the “bonus ROI” of video campaigns — the paid ad is building the organic equity that eventually reduces your need for paid spend on that keyword.

    Weekly Review Cadence

    SPV campaigns require a weekly review structure during the first 90 days. The standard bi-weekly or monthly review cadence used for mature static campaigns is too slow for a format where creative performance is the primary variable. Structure your weekly review around three questions:

    1. Is the 5-second engagement rate above 30%? If not, what’s the hypothesis for why it’s failing?
    2. Are any keywords generating clicks with zero or near-zero engagement on the video? (This suggests a keyword-creative mismatch and is a candidate for negative listing.)
    3. Is ACoS trending down from the baseline established in week 1? If not, where in the funnel is the leak?

    Who Should Launch SPV Now — and Who Should Wait

    Not every seller is equally positioned to benefit from SPV at launch. There’s a meaningful difference between sellers for whom SPV is an immediate priority and sellers who need prerequisites in place first.

    Launch Now If:

    • You already have video assets created for other platforms (YouTube ads, social media) that can be adapted to SPV specs
    • Your product has a clear visual benefit story — it does something that’s more compelling when shown than described
    • You’re in a category with high scroll-and-compare behavior (kitchen, fitness, beauty, outdoor, pet)
    • Your main static image is strong and your listings are already optimized — SPV amplifies a good listing; it can’t rescue a weak one
    • You have budget tolerance for a 30–60 day learning period before expecting optimized ACoS

    Build Prerequisites First If:

    • You have no video production capability and no budget for even basic smartphone-quality content
    • Your product detail page has under 4.0 stars or fewer than 25 reviews — video will drive traffic to a page that doesn’t convert
    • Your static Sponsored Products campaigns have never achieved ACoS below 40% — the fundamental conversion problem is in the listing or pricing, not the ad format
    • You’re in a category where purchase decisions are almost entirely price-driven (commodity goods) — video adds cost without a clear differentiation benefit

    The Production Minimum Viable Bar

    A question sellers frequently ask: does SPV require professional videography? The honest answer is that it requires intentional videography, which is different from expensive videography. A 20-second video shot on a modern smartphone in good lighting, with proper stabilization (a tripod costs under $30), a clean background, and well-designed text overlays will outperform a professionally shot video that doesn’t follow the hook-product-benefit-proof structure. The creative strategy matters more than the production budget at most price points. Categories above $150 may benefit from elevated production quality, but for the majority of Amazon product categories, execution of the creative brief is the differentiator.

    What Comes Next: The SPV Feature Roadmap

    Amazon rarely announces its ad product roadmap publicly, but based on current beta testing signals and the trajectory of the feature rollout, several developments are likely to arrive or fully roll out before the end of 2026:

    Interactive Video Elements

    Amazon has been testing “pause ads” on Prime Video — non-intrusive overlay ads that appear when a viewer pauses content, with a direct “Add to Cart” button. Similar interactive elements are being piloted for SPV, including in-video cart add overlays that allow shoppers to add a product to cart without clicking through to the product detail page. Early internal data suggests a 3.5x brand favorability lift for these formats. When this feature reaches general availability, it fundamentally changes SPV’s purchase funnel by eliminating the click barrier entirely.

    AI-Assisted Video Creation

    Amazon’s AI creative tools, already deployed for image optimization, are being extended to video. Within the Amazon Ads console, sellers will reportedly be able to generate short video clips from existing product images and A+ content — effectively creating an SPV-ready video without a production budget. This is already in limited beta and is expected to reach broader availability by late 2026. For sellers with no current video assets, this will reduce the barrier to entry significantly.

    Vertical Video Full Rollout

    The 9:16 vertical format for SPV is currently available in select placements. By Q4 2026, Amazon is expected to complete its rollout across all mobile SPV placements. Sellers who prepare vertical video assets now — even simple ones — will have a meaningful advantage as vertical becomes the dominant mobile format.

    SPV Integration with Amazon DSP

    Amazon is also reportedly testing cross-channel continuity between SPV and its Demand-Side Platform (DSP). This would allow a shopper who engaged with a SPV ad (but didn’t convert) to be retargeted with related video content through DSP placements off Amazon. This kind of cross-channel video attribution would make SPV’s upper-funnel contribution measurable in ways that current reporting doesn’t support.

    Your 60-Day Launch Checklist for Sponsored Products Video Ads

    Translating research into action requires a concrete sequence. Here’s a practical 60-day roadmap for launching your first SPV campaign with the highest probability of a positive ROI outcome:

    Days 1–7: Production and Asset Preparation

    • Identify your top 3–5 ASINs by organic conversion rate — launch SPV on proven products first
    • Map the creative brief for Video 1 (primary conversion video) — define the hook type, key benefit to demonstrate, and text overlay copy
    • Shoot and edit Video 1 to spec: 1920×1080px, 16:9, 15–25 seconds, silent-mode functional, product visible by second 1
    • If mobile traffic is above 60%, also produce a 9:16 vertical version
    • Submit for Amazon review (allow 3–5 business days for approval)

    Days 8–14: Campaign Setup

    • Add the approved video to your top-performing existing Sponsored Products campaigns (Layer 2: proven exact-match keywords)
    • Set video placement bid modifier to +40% for the first 30 days
    • Choose “dynamic bids up and down” for new SPV campaigns
    • Pull your static campaign’s 90-day search term report and pre-populate 150+ negative keywords before launch
    • Set weekly budget cap at 125% of your equivalent static campaign spend

    Days 15–30: Data Collection (Do Not Optimize Yet)

    • Check video engagement reports weekly but resist making bid changes for the first 21 days
    • Note search terms generating clicks but zero video engagement — add these to a negative review list
    • Track ACoS baseline — expect it to be elevated; document rather than react

    Days 31–45: First Optimization Pass

    • Pull the full 30-day video engagement report. Identify keywords where 5-second engagement rate is below 20% — pause or negate these terms
    • Reduce video placement modifier to +20% for campaigns showing ACoS above target
    • Begin production of Video 2 (feature deep-dive) based on which product features have the highest search query volume in your term report
    • For auto campaigns, promote 3–5 converting search terms to a new exact-match campaign with SPV active

    Days 46–60: Scale and Diversify

    • Upload Video 2 and activate in the same campaigns as Video 1
    • Enable competitor ASIN targeting with a focused list of 10–20 directly competitive products
    • Set ACoS targets for 90 days: aim for within 5 percentage points of your static campaign benchmark
    • Begin planning Video 3 (use-case scenario) based on 60 days of search query data showing customer intent patterns

    The Bigger Picture: SPV as a Competitive Moat

    Step back from the tactical detail and consider the structural dynamic at play. Amazon’s search results page is undergoing a format shift — from a static grid to a hybrid feed with motion content. This shift is happening now, while the majority of sellers are still operating with all-static creative strategies. The adoption gap is real, and it’s temporary.

    In 12–18 months, Sponsored Products Video will be table stakes — something every category leader uses, and something that no longer confers first-mover advantage. The window where video gives you a measurable edge over non-video competitors (the 23% CTR lift, the lower effective CPC from quality score improvement, the 8x conversion lift for engaged viewers) is widest right now, while adoption is still below majority.

    This isn’t about chasing a shiny new feature. It’s about recognizing that the format of Amazon advertising is changing at the structural level, and aligning your creative and campaign strategy with where the platform is actually going — before your competitors do.

    The sellers who build a library of well-structured SPV assets now, who learn the creative frameworks that earn the 5-second watch, and who wire their campaign architecture to extract the maximum signal from video engagement data, will have a compounding advantage. The data they collect today will inform better creative tomorrow. The organic rank gains from video-driven sales velocity will reduce their paid spend requirements over time. And the creative production muscle they build now will be immediately applicable to every new video format Amazon introduces afterward.

    The Amazon SERP is becoming a feed. Every seller who treats it like a catalog is slowly disappearing. The question isn’t whether to use Sponsored Products Video Ads — it’s whether you move now or wait until the advantage is gone.

    Start with one product. Build one video. Launch one campaign. Collect 30 days of data. Then decide how aggressively to scale. The first video you produce will not be your best video — but it will generate data that makes every subsequent video better. That’s the compound return that early movers in this format are already building, and late movers will eventually have to catch up to.