Tag: MLOps

  • Why Most Self-Healing Automations Heal the Wrong Thing (And How to Design Ones That Don’t)

    Why Most Self-Healing Automations Heal the Wrong Thing (And How to Design Ones That Don’t)

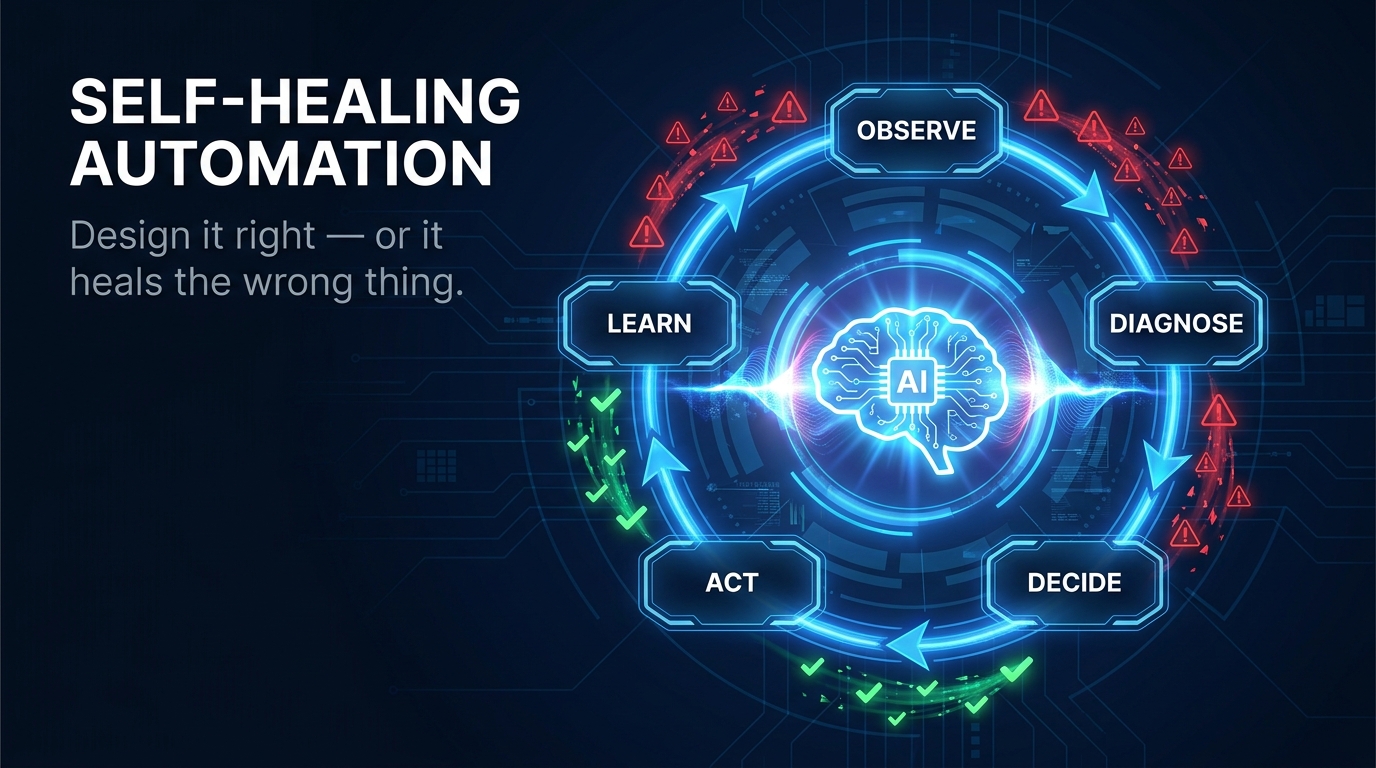
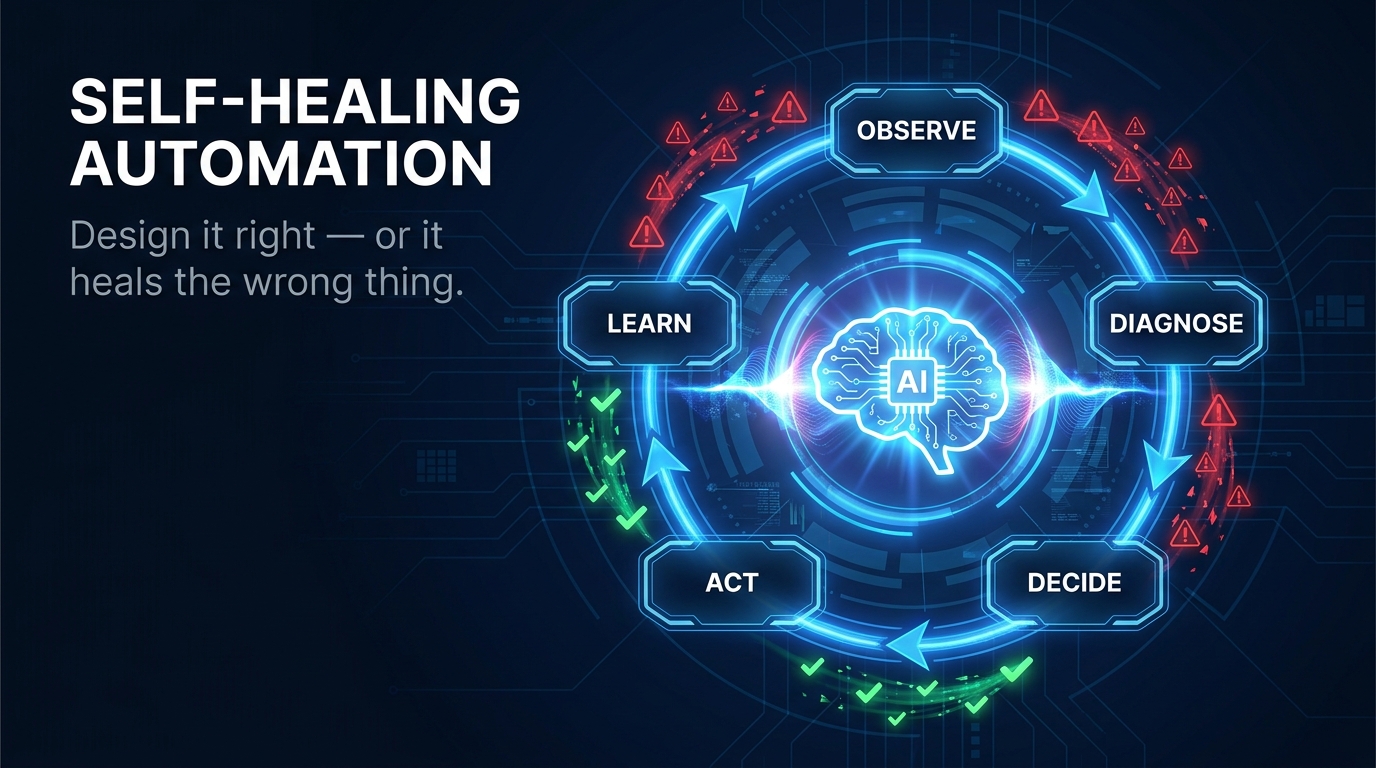
    Self-healing AI automation feedback loop diagram showing the OBSERVE, DIAGNOSE, DECIDE, ACT, LEARN cycle

    The pitch is compelling enough that almost everyone buys it the first time: build AI automation that can detect its own failures and fix them — without a human in the loop. You deploy it. Something breaks. The system, as advertised, “heals” itself. Your dashboard stays green. Everybody relaxes.

    Then, six weeks later, you discover that the automation has been quietly re-routing a class of transactions to a fallback path, and those transactions haven’t actually been completing. They’ve been disappearing. The system healed itself so efficiently that nobody noticed the underlying process was failing thousands of times a day.

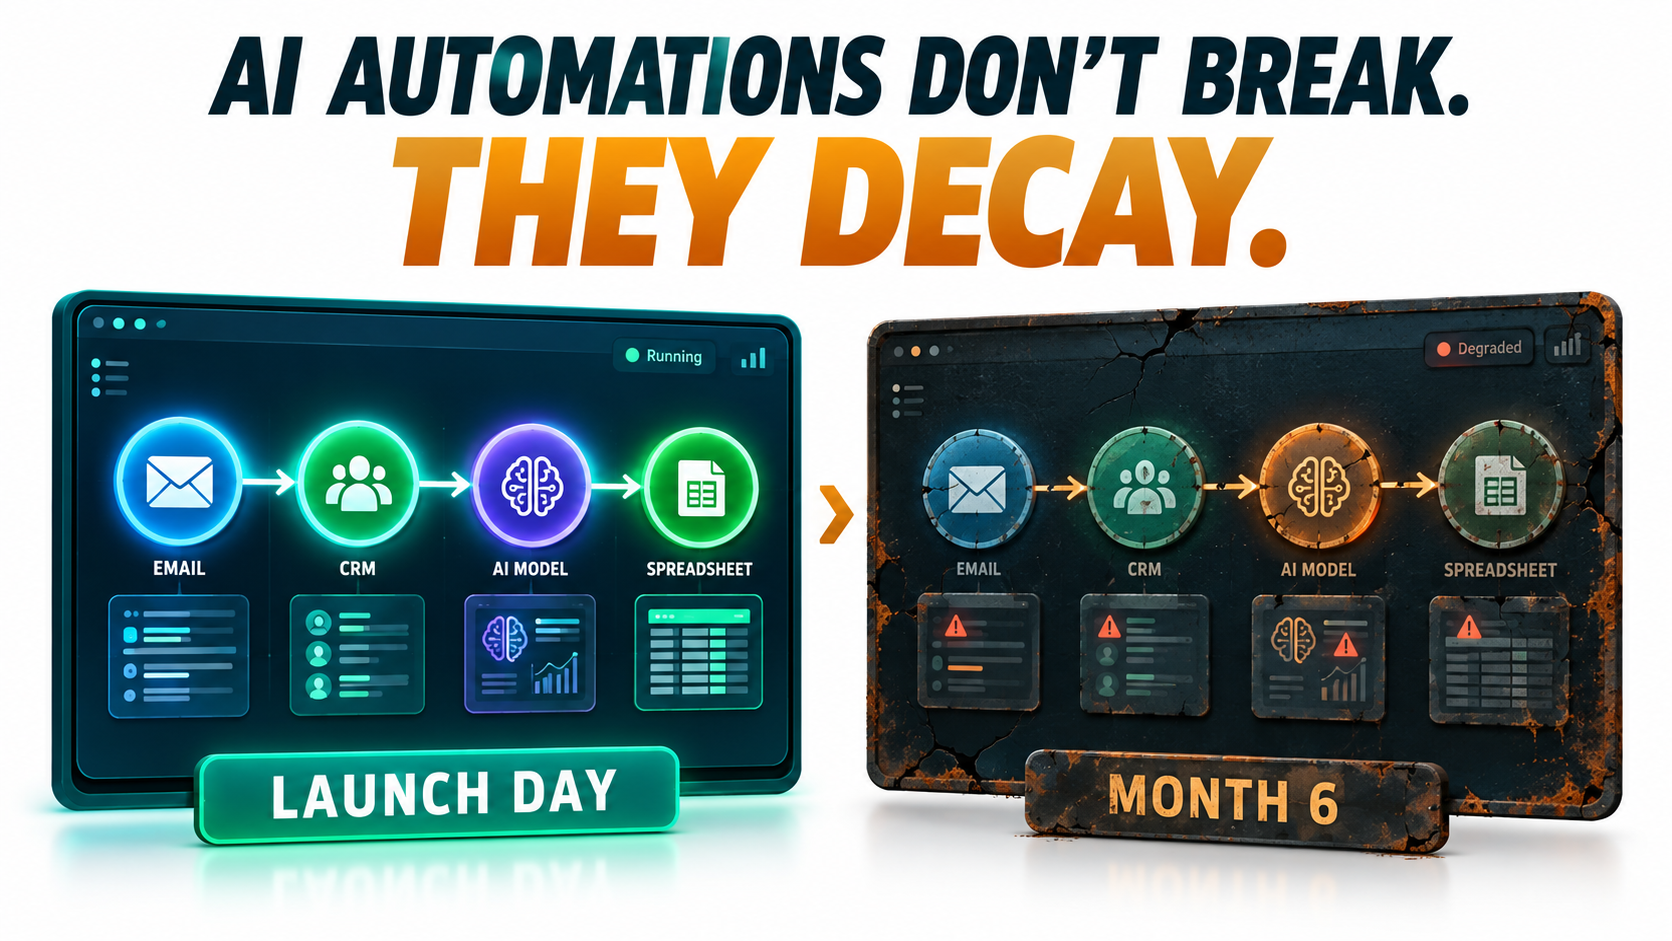
    This is the central paradox of self-healing AI automation in 2026: the systems that are best at recovering from failures are also the best at hiding them. A green dashboard built on top of an improperly designed self-healing layer is more dangerous than a red one, because at least a red dashboard prompts someone to look.

    This post is not an argument against self-healing automation — it genuinely works, it genuinely reduces downtime, and teams that implement it well report detection accuracy improvements from 67% to 94%, and auto-resolution rates reaching 80% of all production incidents. But “implementing it well” requires understanding what self-healing is actually supposed to fix, how the feedback loop should be structured, and — critically — which failure modes it will make worse if you design it carelessly.

    Here is the full architecture: the failure taxonomy, the control loop, the resilience layers, the governance model, and the anti-patterns that turn self-healing systems into sophisticated liability generators.

    The Five Failure Classes Self-Healing Must Actually Address

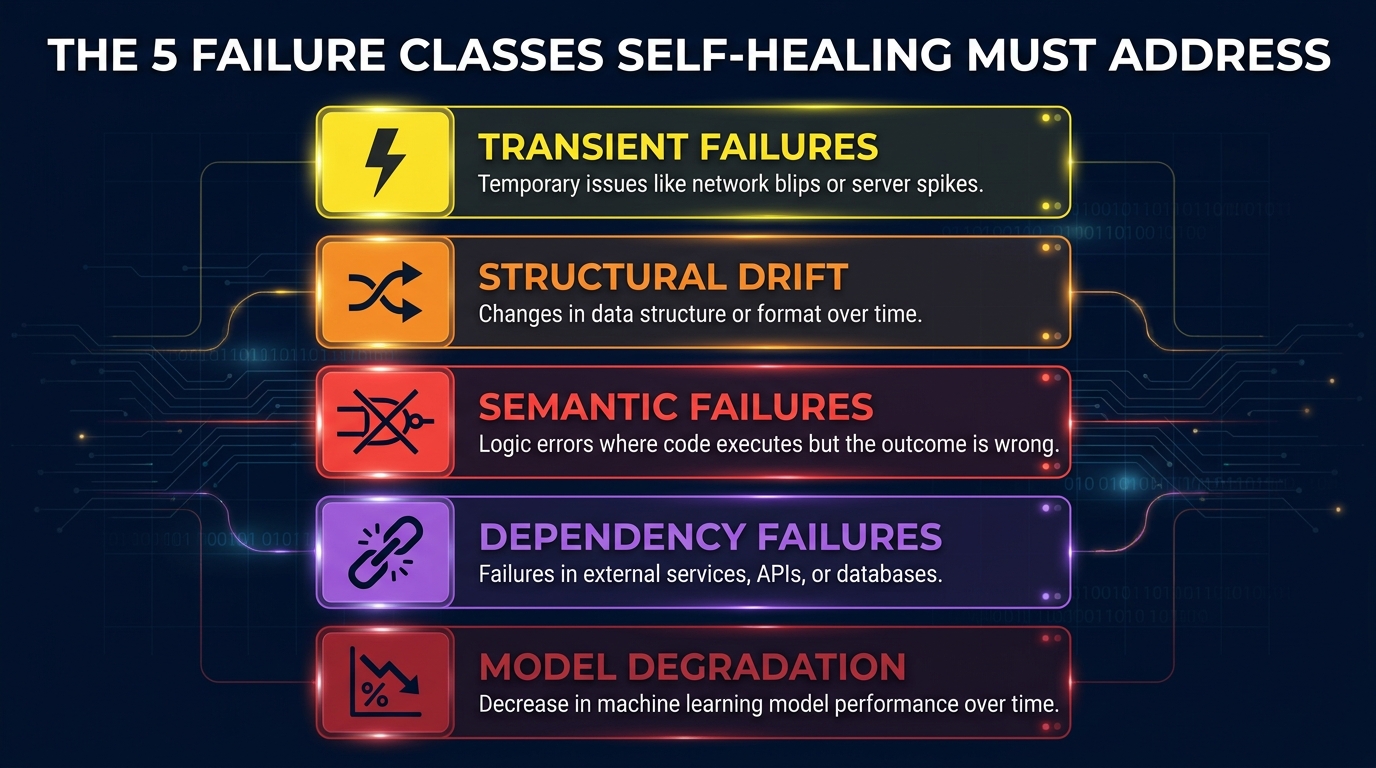
    Infographic showing the five failure classes that self-healing automation must address: transient, structural drift, semantic, dependency, and model degradation

    The first mistake most teams make is treating all automation failures as the same category of problem. They build a single “self-healing” mechanism — usually retry logic or a simple restart trigger — and apply it everywhere. This works for one type of failure. It makes four others worse.

    Before you design any self-healing system, you need a failure taxonomy. These are the five distinct classes your automation will encounter, and they require fundamentally different remediation strategies.

    1. Transient Failures

    These are the failures that resolve themselves if you wait. A network timeout. A downstream API rate-limit response. A temporary database lock. They’re caused by conditions that are inherently unstable and time-bound, and they account for a large percentage of what automation systems report as failures on a given day. Retry logic with exponential backoff is the correct and sufficient response. Applying anything more sophisticated — AI diagnosis, human escalation, re-routing logic — to transient failures is wasted complexity that slows your system down and pollutes your incident logs with noise.

    2. Structural Drift

    Structural drift is what happens when the environment the automation was built for has changed in a way that breaks the automation’s assumptions. In test automation, this is the classic locator problem: a UI element gets a new ID, and the test script can no longer find it. In RPA, it’s a desktop application that updated its layout. In data pipelines, it’s a source API that added required parameters. These failures are not transient — they will happen again every single run until someone fixes the underlying cause. Self-healing automation in this class means detecting the structural change, finding an alternative selector or mapping, applying the fix, and logging the change for human review. The AI component here is useful and well-established. Studies from RPA deployments report 70–90% reductions in UI-change-related failures when this class of healing is properly applied.

    3. Semantic Failures

    Semantic failures are the hardest class to automate remediation for, and the most dangerous to get wrong. This is when the automation runs successfully by every technical measure, but does the wrong thing. An AI classification model routes invoices to the wrong approval queue. A sentiment analysis step misreads a customer complaint as neutral. An extraction automation pulls the right field from the wrong version of a document. Semantic failures don’t throw errors. They produce outputs that look valid. The self-healing logic for this class must include output validation — comparing results against expected distributions, flagging statistical outliers, and routing to human review when confidence drops below a defined threshold. Attempting to auto-remediate semantic failures without human review is where systems create the kind of invisible damage described in this post’s opening paragraph.

    4. Dependency Failures

    These occur when a component your automation depends on — an upstream service, a third-party API, a data feed — fails independently of your system. The correct self-healing strategy here is circuit breaking: detecting that a dependency is unhealthy, stopping outbound requests to protect both your system and the failing dependency, and initiating a controlled degradation path. This might mean switching to a cached data source, queuing work for later processing, or switching to an alternative provider. The AI component in dependency failure remediation is primarily in predicting which dependencies are likely to fail before they do, based on latency trends and error rate patterns — so you can pre-warm alternatives rather than scrambling during an outage.

    5. Model Degradation

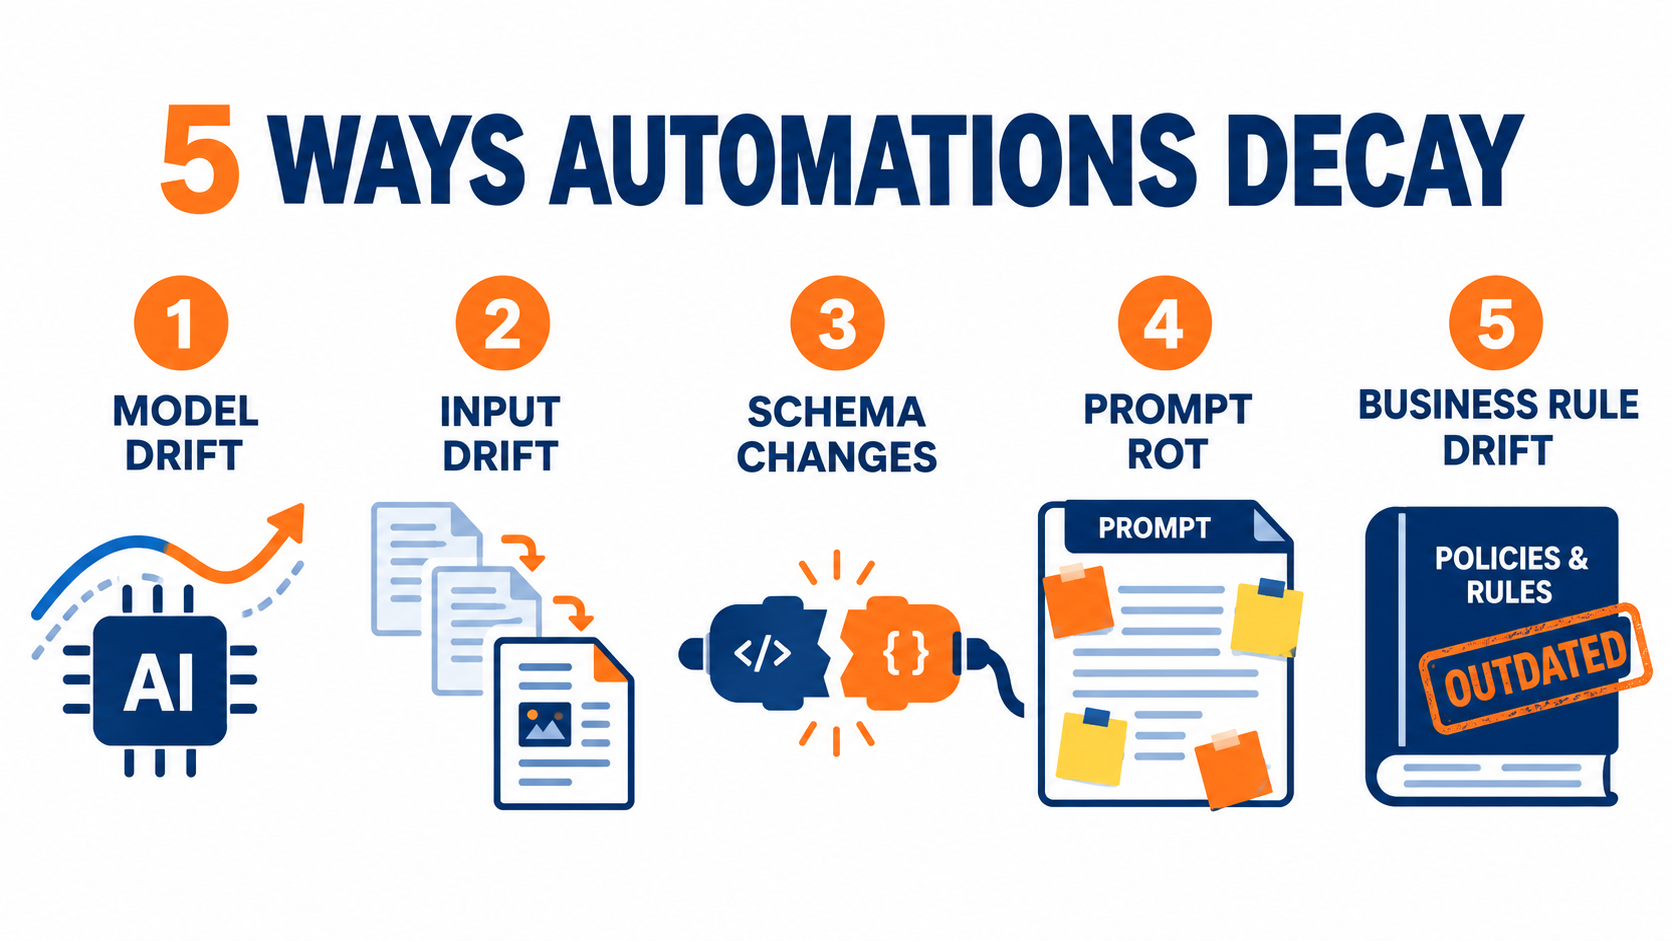
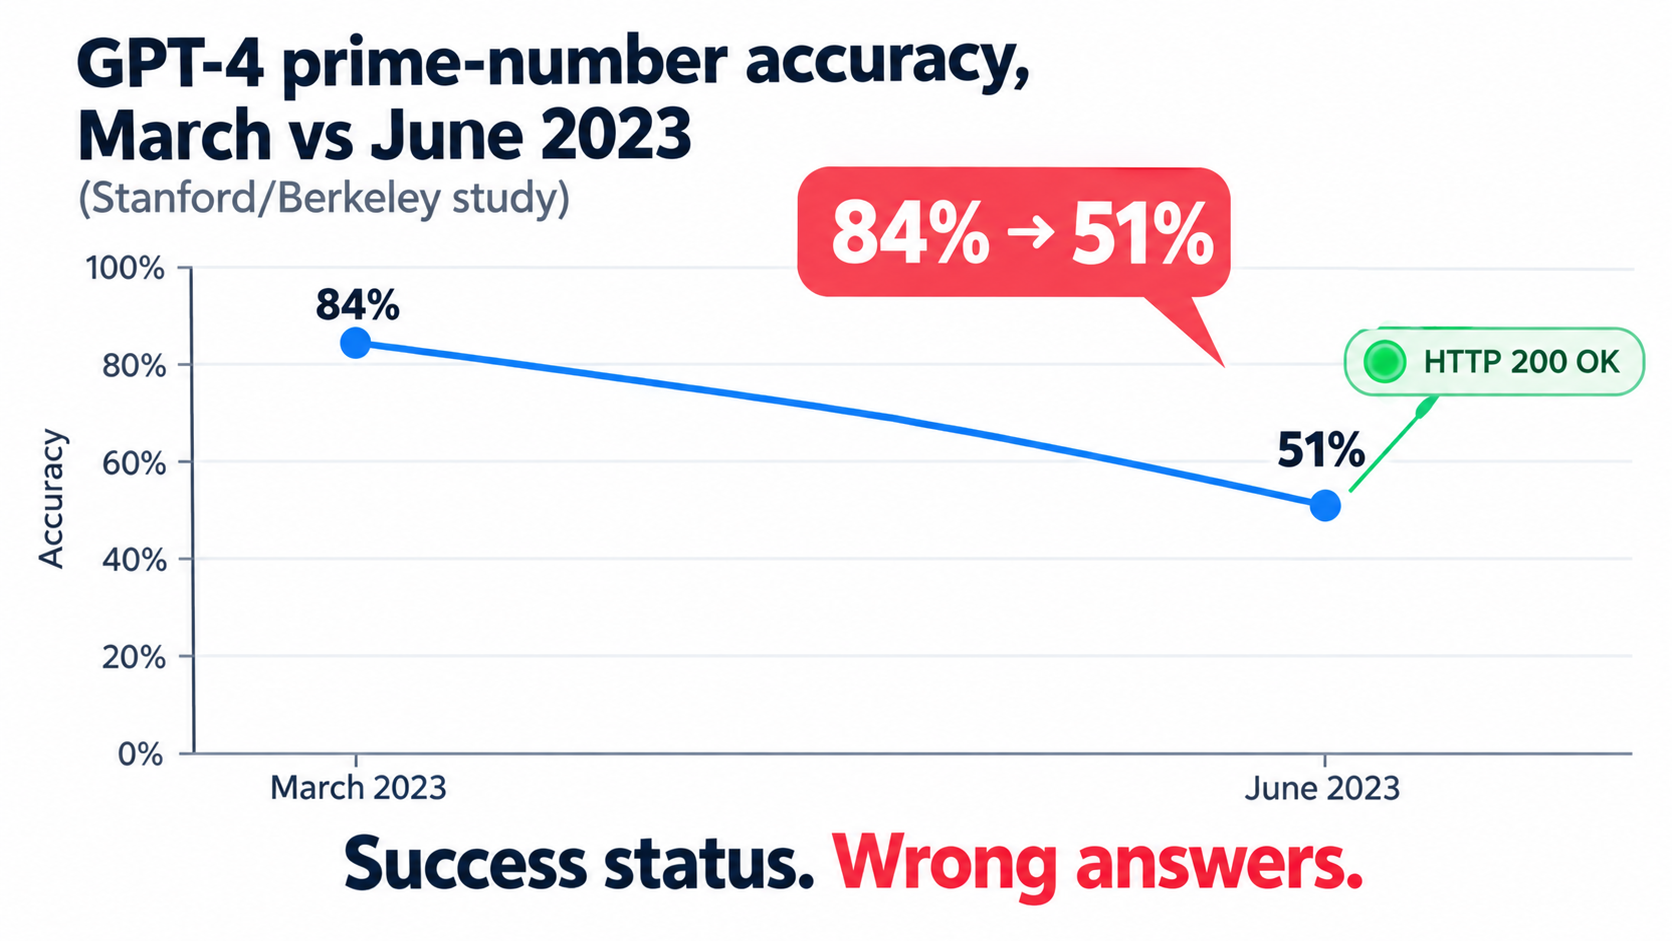
    For automation systems that include AI models, model degradation is its own failure class. The model doesn’t break — it just gets progressively worse. Training data becomes stale. The real-world distribution of inputs drifts away from the distribution the model was trained on. A model that was 94% accurate when deployed might be making decisions at 71% accuracy six months later, without any single failure event that would trigger a conventional alarm. Self-healing for model degradation requires continuous monitoring of output distributions, accuracy proxies, and feature statistics, with automated retraining triggers when drift crosses defined thresholds. This is covered in depth later in this post.

    The ODDAL Loop: The Architecture That Makes Healing Systematic

    Most self-healing implementations are reactive: something breaks, a recovery script fires, the system tries to continue. This architecture works for transient failures and nothing else. For all other failure classes, you need a proactive control loop that treats observability as a first-class design primitive rather than an afterthought bolted on after deployment.

    The loop has five phases. Getting the sequence right is non-negotiable — skipping or conflating any phase is the single most reliable way to produce a system that heals the wrong thing.

    Phase 1 — Observe

    Observability in the context of self-healing is not the same as logging. Logging records what happened. Observability gives you the telemetry — metrics, traces, structured events, model output statistics — needed to detect anomalies before they become failures. The critical design decision here is instrumenting for the right signals. For infrastructure, this means latency percentiles and error rates. For data pipelines, it means row counts, null rates, and distribution statistics on key fields. For ML components, it means tracking prediction confidence scores, output distributions, and a rolling sample of predictions versus ground-truth labels where available. Teams that skip this phase try to build self-healing on top of reactive error logs, which means they only see failures after they’ve already caused damage.

    Phase 2 — Diagnose

    Once an anomaly is detected, the system needs to classify it correctly before deciding what to do. This is where AI earns its place in the loop — not as the thing that fixes failures, but as the thing that correctly identifies what kind of failure it is. An LLM-based diagnosis agent can parse logs, compare the anomaly signature against a catalog of known failure patterns, assess blast radius, and produce a structured failure classification with a confidence score. The output of the diagnosis phase should be: failure class (using your taxonomy), estimated root cause, confidence level, and recommended remediation action. It should explicitly not be an autonomous fix — that comes next, with governance.

    Phase 3 — Decide

    The decide phase is where most self-healing systems either get too aggressive or not aggressive enough. Too aggressive: any diagnosed failure triggers immediate auto-remediation, regardless of confidence or impact. Not aggressive enough: everything gets escalated to humans, defeating the point of automation entirely. The correct model is a tiered confidence and risk framework, covered in detail in a later section. The key design principle is that the decide phase must be explicitly modeled — it should not be an implicit consequence of the diagnosis. Every possible remediation action should have a documented threshold for when it fires automatically, when it fires with notification, and when it requires explicit human approval.

    Phase 4 — Act

    The act phase executes the chosen remediation. Good remediation actions share four properties: they are idempotent (running them twice doesn’t make things worse), reversible (there is a rollback path), scoped (they affect the smallest possible part of the system), and observable (they produce a log entry that confirms the action was taken and what changed). Actions that fail any of these four tests should not be automated. A restart of a failed service is idempotent, reversible, scoped, and observable. A bulk data correction across a production database is probably none of those things and should require explicit human approval regardless of diagnosis confidence.

    Phase 5 — Learn

    The learn phase is what separates a self-healing system from a self-recovering one. Self-recovery handles the incident. Self-healing permanently reduces the probability of that incident happening again. Learning means feeding the outcome of each incident — what was diagnosed, what action was taken, whether it worked — back into the diagnosis model, the playbook catalog, and the threshold configuration. Over time, a well-designed learn phase produces a system whose auto-resolution rate increases, whose false-positive alert rate decreases, and whose diagnosis accuracy improves. The case study data showing detection accuracy jumping from 67% to 94% over three months reflects exactly this dynamic — the system was learning from each resolved incident.

    Layered Resilience: Where Classic Patterns Meet AI-Driven Repair

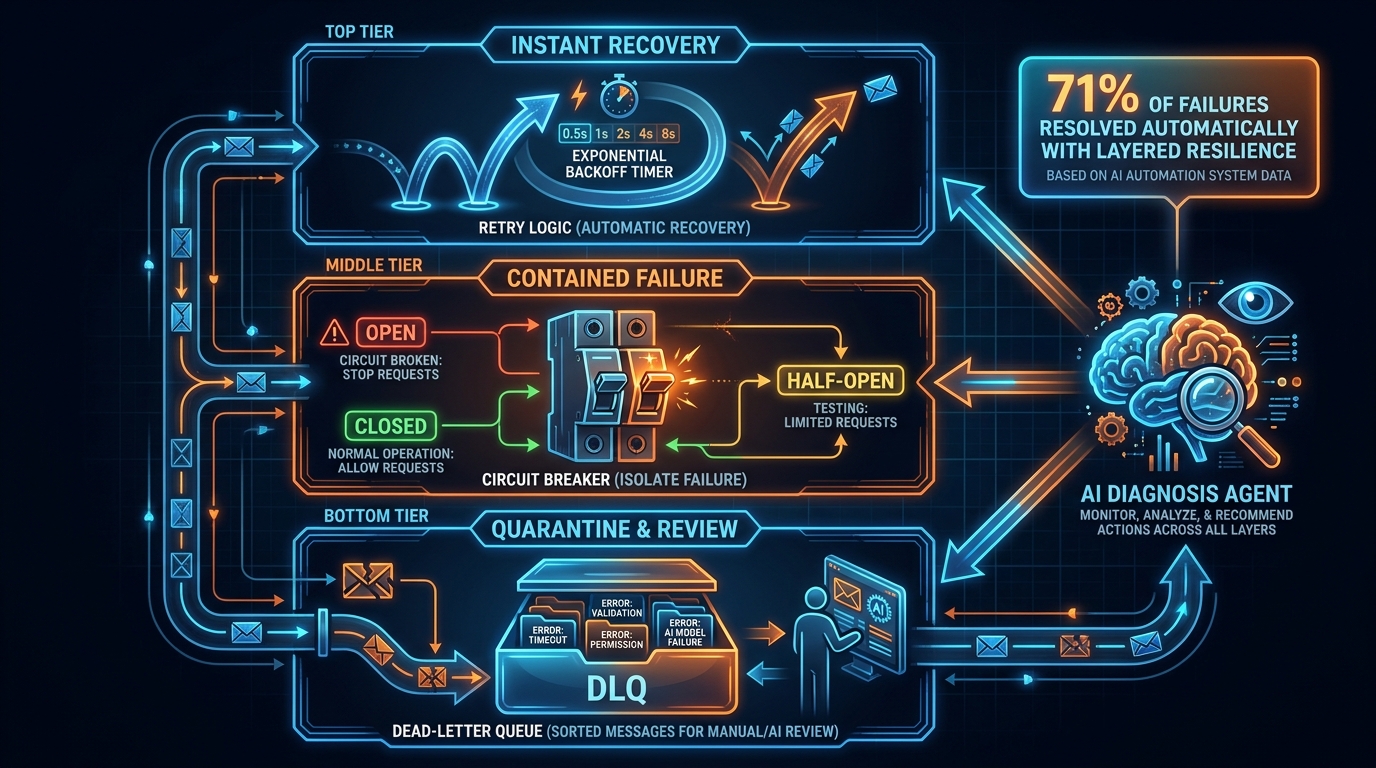
    Layered resilience architecture showing retry logic, circuit breakers, and dead-letter queues with AI diagnosis agent

    Self-healing is not a replacement for classic resilience engineering patterns. It is an extension of them. Teams that try to build AI-native self-healing from scratch without the underlying resilience primitives in place are skipping steps that have decades of production validation behind them. The right architecture layers AI-driven healing on top of — not instead of — circuit breakers, retry logic, and dead-letter queues.

    Layer 1: Retry Logic with Exponential Backoff

    This is the baseline. Every network call, every API integration, every external dependency interaction should be wrapped in retry logic that uses exponential backoff with jitter. “Jitter” — randomizing the wait time slightly on each retry — prevents the thundering-herd problem where thousands of simultaneous retries hit a recovering service at the exact same moment and knock it back down. The right configuration for most production systems is three attempts, starting at 100ms, doubling each time, with a maximum wait of around 30 seconds. Retries are appropriate only for transient failures — idempotent operations where re-executing the same request cannot cause duplicate state changes. Write operations that are not idempotent need idempotency keys or sequence numbers before retry logic applies safely.

    Layer 2: Circuit Breakers

    When retries keep failing — when a dependency isn’t just slow but structurally broken — you need a circuit breaker. The pattern has three states: closed (normal operation, all requests pass through), open (dependency marked as unhealthy, all requests fail fast without attempting the call), and half-open (a probe state where a small number of requests are allowed through to test whether the dependency has recovered). Circuit breakers protect your system from cascading failures by preventing resource exhaustion on calls that will fail anyway. They also protect struggling downstream services from being hammered by retry storms. The AI addition to this layer is predictive circuit breaking — using latency trend data and error rate patterns to open the circuit before failure rate crosses the threshold, rather than after.

    Layer 3: Dead-Letter Queues

    Some failures can’t be handled immediately, but they also can’t be discarded. A dead-letter queue (DLQ) is a holding area for messages or tasks that have exhausted their retry budget. Items in the DLQ are preserved rather than lost, and they become the target of both automated and manual remediation efforts. A well-designed DLQ integration does three things beyond simple storage: it categorizes items by failure type upon entry (so the AI diagnosis agent doesn’t have to re-process cold data), it sets an expiration policy that’s appropriate to the business context, and it surfaces volume metrics to an alerting system so that a spike in DLQ depth triggers review before items expire. In business-process automation, the DLQ is where semantic failures typically land — they weren’t technically invalid, but something about them didn’t meet validation thresholds, and a human needs to make the call.

    Where AI-Driven Repair Fits in the Stack

    AI-driven repair sits above all three classic layers, not below them. Its job is to handle the failures that Layer 1, 2, and 3 have captured but not resolved — those that require contextual diagnosis, adaptive remediation, or structural change to fix. An AI diagnosis agent reading DLQ contents and classifying failure types is a force multiplier on the classic stack. An AI agent attempting to replace Layer 1 retry logic is a performance liability and a governance nightmare.

    Confidence Thresholds and the Human-in-the-Loop Gate Model

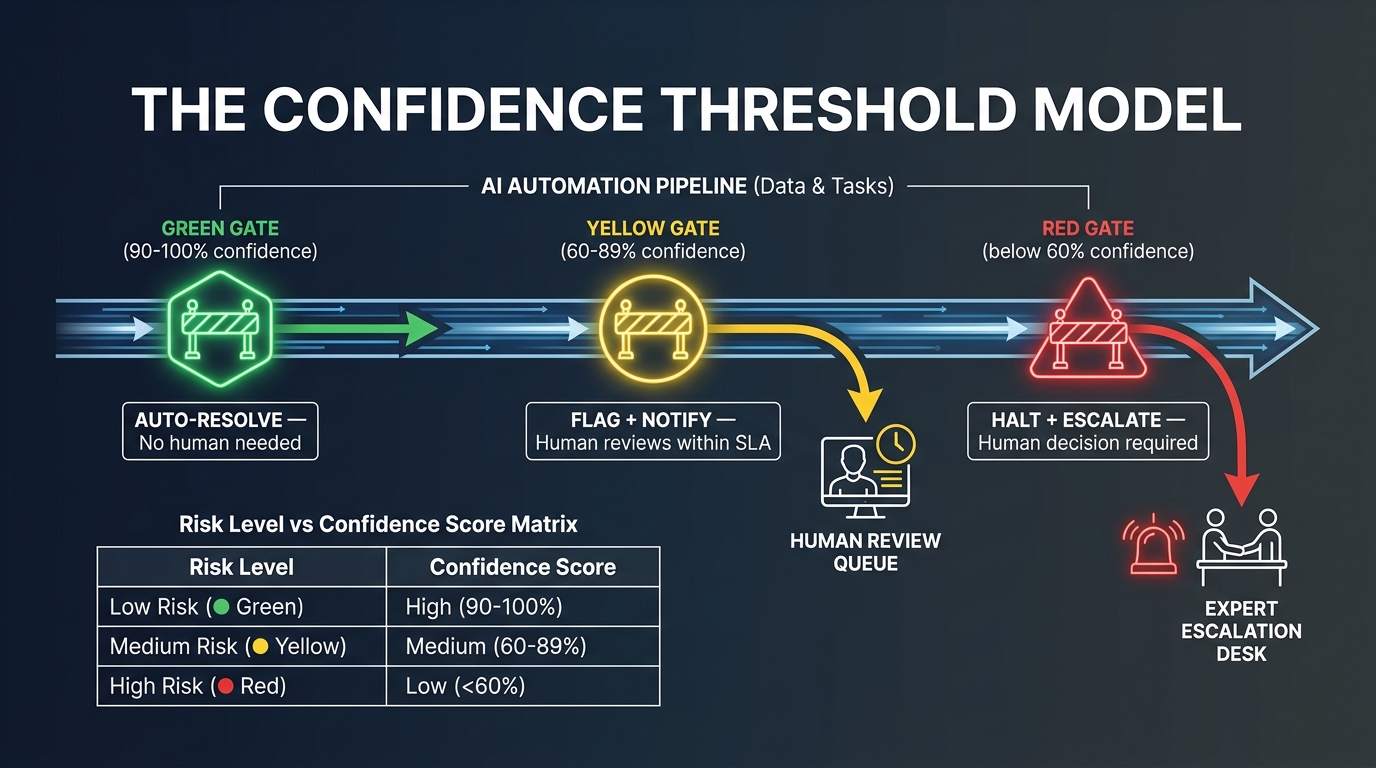
    Confidence threshold model showing three decision gates: auto-resolve at high confidence, flag and notify at medium confidence, halt and escalate at low confidence

    The most consequential design decision in a self-healing system is not the detection algorithm or the remediation playbook. It is the threshold model that determines when the system acts autonomously, when it notifies a human and proceeds, and when it stops and waits for explicit approval. Get this wrong in either direction and you’ve built a system that’s either useless or dangerous.

    The Three-Gate Model

    A practical, field-tested threshold model uses three gates based on a combination of diagnosis confidence score and estimated impact of the remediation action.

    Gate 1 — Auto-Resolve (High confidence + Low impact): Confidence score above 90%, remediation action is reversible and scoped. The system acts autonomously, logs the action with full detail, and sends a low-priority notification to the owning team. No human approval required. Example: retry a failed API call, restart a hung worker process, re-route traffic from an unhealthy pod.

    Gate 2 — Flag and Notify (Medium confidence or Medium impact): Confidence score between 60–89%, or remediation action affects more than a single component. The system proposes a specific remediation, notifies the on-call engineer with full diagnosis context, and proceeds with the action after a defined window (typically 15–30 minutes) unless the engineer overrides. This preserves velocity while ensuring a human sees high-frequency healing events before they compound. Example: update an API authentication credential that has rotated, apply a schema migration to bring a downstream consumer back in sync.

    Gate 3 — Halt and Escalate (Low confidence or High impact): Confidence score below 60%, or the remediation action could affect data integrity, financial transactions, or production databases. The system halts the affected workflow, fires a high-priority alert, and presents the diagnosis and candidate remediation options to the on-call engineer for explicit approval. Example: any bulk data operation, any action affecting a payment processing pipeline, any remediation that modifies a core configuration file.

    Setting Thresholds Is Not a One-Time Decision

    Threshold calibration is an ongoing operational task, not a deployment setting. Teams that set thresholds at deployment and never revisit them end up with systems that were calibrated against early failure patterns and are operating on stale assumptions six months later. A governance practice that reviews threshold performance monthly — measuring auto-resolution correctness rate, false-positive escalation rate, and missed-escalation incidents — is what keeps the model well-calibrated over time. The target metrics: auto-resolved actions should have a post-validation pass rate above 95%; escalations should have a confirmation rate below 20% (meaning most human reviews confirm the system’s diagnosis was correct and the escalation was appropriate, not that the system was wrong).

    Regulated Environments Require Stricter Default Thresholds

    In financial services, healthcare, and other regulated verticals, the gate model needs additional constraints beyond confidence and impact. Some remediation actions may be prohibited from automation entirely under regulatory frameworks, regardless of confidence score. Others require a documented audit trail before they can be replicated. Before deploying a self-healing layer in a regulated context, the compliance team needs to review the full remediation playbook and flag which actions have regulatory implications — and those actions should be moved to Gate 3 by policy, independent of the AI’s confidence assessment.

    Drift, Schema Change, and Model Degradation: The Slow Failures Nobody Notices

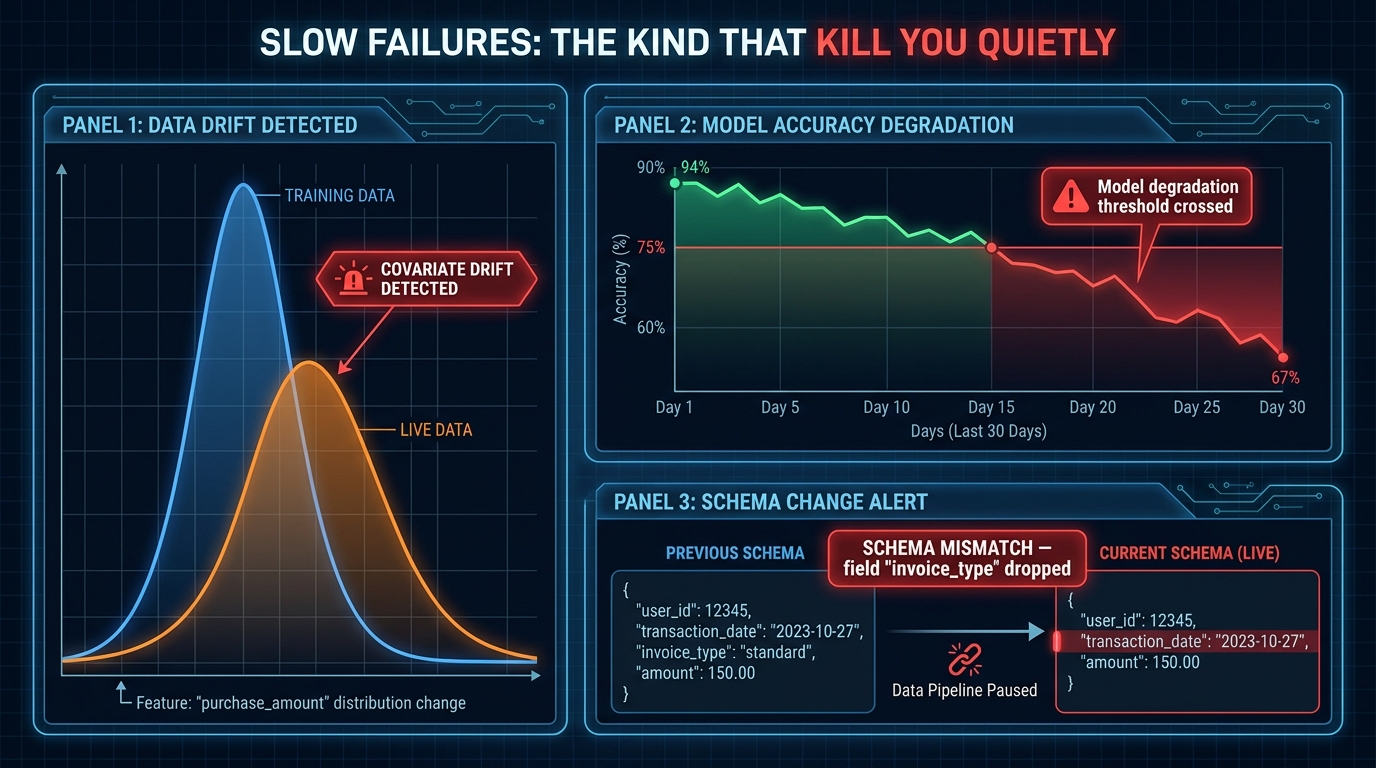
    ML pipeline monitoring dashboard showing covariate drift detection, model degradation accuracy chart, and schema mismatch alerts

    Fast failures are comparatively easy to handle. They produce errors, they trigger alerts, they have clear timestamps. Slow failures — the ones that degrade over weeks or months — are the ones that destroy confidence in automation systems, because they’re often discovered not by the system’s own monitoring, but by a downstream stakeholder who notices that something seems off.

    There are three categories of slow failure that self-healing architectures must address specifically, with their own detection and remediation strategies.

    Covariate Drift: When the World Stops Matching the Training Data

    Covariate drift occurs when the statistical distribution of inputs to an AI model shifts away from the distribution the model was trained on, without the outputs immediately showing obvious errors. A fraud detection model trained on transaction patterns from 2024 may be systematically underflagging a new class of fraud that emerged in late 2026. A document extraction model trained on a specific invoice template may silently degrade as suppliers update their templates. The distribution of inputs has changed; the model’s weights haven’t.

    Detecting covariate drift requires monitoring feature statistics — mean, variance, and distribution shape of key input fields — in the live environment and comparing them against baseline statistics captured at training time. Statistical tests like the Kolmogorov-Smirnov test or Population Stability Index (PSI) can be run as scheduled pipeline steps and used to trigger alerts when drift exceeds a defined threshold. The remediation — automated or human-approved — is typically a retraining trigger that pulls recent production data into the training set and re-validates the model before deploying the update.

    Schema Change: When Upstream Data Stops Matching Expectations

    Schema changes are among the most common causes of silent data pipeline failures. An upstream team renames a column, drops a field, changes a data type from string to integer, or starts populating a previously null field. The pipeline downstream doesn’t break loudly — it either throws a handled exception and continues with nulls, or misinterprets the changed field and produces subtly wrong outputs. One industry estimate puts the annual cost of data downtime at $3.6 million per organization, and schema change is one of the primary contributors.

    Self-healing for schema change requires schema registry integration and contract testing at pipeline ingestion points. When a new batch of data arrives, the pipeline should validate it against the expected schema before processing. On mismatch, the detection should classify the type of change — additive (new fields added, generally safe), breaking (fields renamed or dropped, requires remediation), or type-changing (field type altered, requires explicit validation logic). Additive changes can often be handled automatically with conservative defaults. Breaking changes should route to Gate 2 or Gate 3, depending on the affected pipeline’s downstream impact.

    Model Degradation: Measuring What You Can’t Directly Observe

    The hardest slow-failure class to detect is model degradation in cases where you don’t have ground-truth labels available in real time. A model making predictions about customer churn won’t have its predictions validated for 30, 60, or 90 days — by the time you know whether the prediction was right, the model has made thousands more decisions without feedback. Two proxy approaches bridge this gap: output distribution monitoring (tracking whether the distribution of predicted classes or scores is shifting over time relative to the baseline) and confidence score monitoring (tracking whether the model’s own internal confidence scores are trending downward, which often precedes measurable accuracy degradation).

    When either proxy metric triggers an alert, the self-healing response is calibrated: first, flag recent predictions that fell in the degraded confidence range for human spot-check review; second, accelerate the ground-truth collection timeline where possible (which might mean sampling a subset of predictions for manual validation); third, trigger a candidate retraining run in a shadow environment and hold it for evaluation before any production deployment. The decision to swap the degraded model for the retrained candidate should always be a Gate 2 or Gate 3 action — the cost of deploying a worse model than the one it replaces is typically higher than the cost of a short review delay.

    Anti-Patterns: How Self-Healing Creates New Fragility

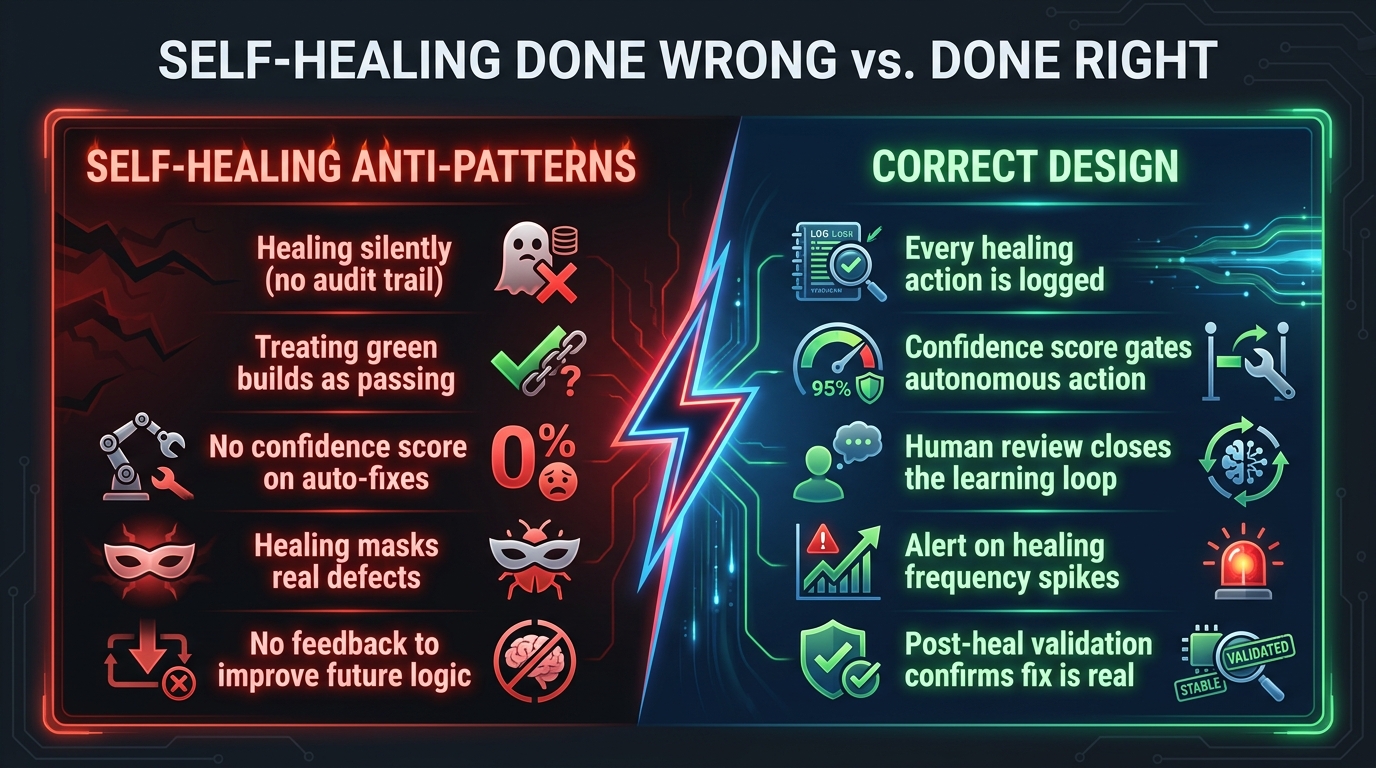
    Split comparison showing self-healing anti-patterns versus correct design practices for AI automation systems

    Every pattern introduced to reduce fragility has a failure mode of its own. Self-healing is no exception. The following are the anti-patterns most commonly observed in production deployments — not theoretical edge cases, but patterns that teams have shipped, regretted, and had to retrofit out of live systems.

    Silent Healing: The “Green Dashboard” Trap

    This is the anti-pattern described in the introduction. The self-healing system recovers from failures without surfacing them, resulting in a monitoring dashboard that looks healthy while the underlying system is in a degraded state. Every healing action should generate a visible log entry, categorized by failure class and remediation applied. Healing event volume should be tracked as its own metric — and a spike in healing frequency should trigger an alert, because it means the system is working harder than normal to maintain normal-looking outputs. A system that is healing five times per hour is not operating normally; it is compensating for something that needs a structural fix.

    Over-Healing: Masking Real Defects

    In test automation, this is the phenomenon where self-healing tools keep test suites green by automatically adapting to UI changes — including changes that represent genuine defects in the product under test. The tests pass; the product is broken. The same failure mode exists in production automation: a self-healing system that automatically routes failing tasks around a broken downstream component may be hiding the fact that the downstream component has a data quality problem that’s been growing for weeks. Self-healing logic should escalate on healing frequency, not just on healing failure. If the same type of failure is being healed repeatedly, that pattern itself is an alert condition requiring root cause investigation.

    Confidence Theater

    This anti-pattern occurs when teams implement confidence scoring in their diagnosis layer but set all the thresholds so permissively that the confidence score never actually gates an action. Everything routes to Gate 1. The confidence score becomes a number that appears in logs but doesn’t influence behavior. This is worse than not having confidence scoring at all, because it gives the appearance of governance without the substance — a situation that tends to surface badly in post-incident reviews or audits. Threshold calibration should be treated as a security-review-grade design decision, with explicit documentation of why specific thresholds were chosen and what evidence supports them.

    Feedback Loop Neglect

    The learn phase of the ODDAL loop is the first thing cut when teams are under delivery pressure. The system detects, diagnoses, and acts — but the outcomes never feed back into the diagnosis model. Over time, the diagnosis model becomes stale. Failure patterns that have been resolved at the root cause level still generate alerts. New failure patterns that weren’t in the original training set get misclassified. The system’s auto-resolution rate plateaus or starts declining. Teams that skip the learn phase end up with a self-healing system that requires more and more manual reconfiguration to stay accurate — gradually converging back on the same maintenance burden it was supposed to eliminate.

    Scope Creep in Remediation Actions

    Remediation playbooks have a natural tendency to expand. An action that started as “restart the failed service” gets amended over time to “restart the failed service and also clear the cache and also reset the connection pool.” Each amendment makes intuitive sense when it’s added, but the cumulative effect is a remediation action that is no longer idempotent, no longer reversible in a single step, and much harder to audit when something goes wrong. Each remediation action in the playbook should have an explicit scope contract — what it changes, what it does not change, and what validation step confirms the action succeeded. Any amendment to a playbook action should go through the same review process as a code change.

    Governance, Audit Trails, and the Accountability Gap

    When a human makes a bad decision, there is accountability: a person who made the call, a reasoning chain that can be reviewed, and an organizational process for learning from the error. When an automated system makes a bad decision, the accountability structure often doesn’t exist unless it was deliberately designed in from the start. This gap is not hypothetical — it is the central complaint of every compliance and audit team that has reviewed an AI automation deployment.

    What an Audit Trail Must Capture

    Every automated action taken by a self-healing system should generate an immutable audit record containing: the timestamp and unique identifier of the incident; the raw telemetry that triggered the alert; the diagnosis output, including failure class, confidence score, and the evidence used to reach that diagnosis; the remediation action selected and the gate level it fell into; whether the action was autonomous or required human approval and — if human-approved — who approved it and when; and the post-remediation validation result confirming whether the action succeeded. This record needs to be stored somewhere that the self-healing system itself cannot modify — either an append-only log store or an external audit system.

    Role Clarity: Who Owns the System’s Decisions

    In organizations that haven’t explicitly assigned ownership of self-healing automation decisions, audit questions produce paralysis. “Who approved this change?” gets answered with “the system did it automatically” — which is not a satisfactory answer for a regulator, a post-incident review board, or a customer whose data was affected. The governance model should define: a system owner responsible for threshold configuration and playbook review; a review board (at minimum one engineer and one process owner) that approves playbook changes; and an escalation owner who is paged when Gate 3 actions occur. These are not roles that need to be full-time dedicated positions — but they need to be named, documented, and actively maintained.

    Review Cadences That Keep Governance Real

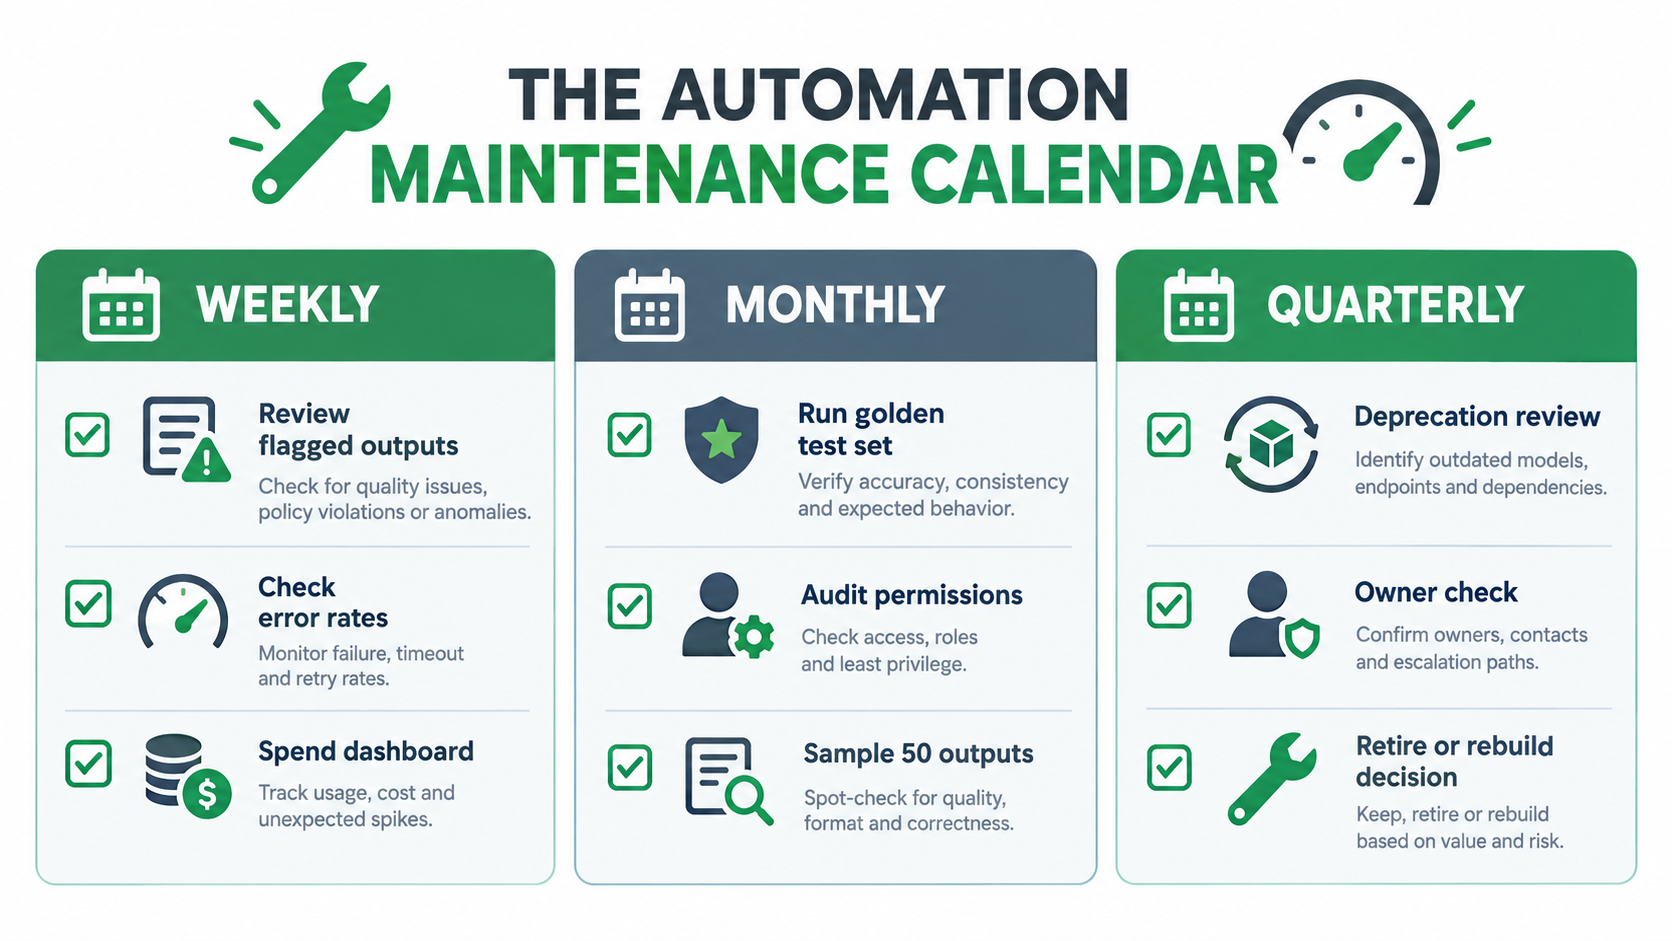
    Governance that exists only on paper is worse than no governance — it creates the illusion of oversight without the substance. Three review cadences keep self-healing governance meaningful in practice: a weekly review of healing event volume and Gate 1/2/3 distribution (to catch threshold drift early), a monthly review of diagnosis accuracy and false-positive rate (to calibrate the learn phase), and a quarterly full playbook review (to retire stale remediation actions, add new ones for emerging failure patterns, and re-validate scope contracts). Each review should produce a written record — even a brief one — that confirms the review occurred and notes any threshold or playbook changes made as a result.

    Building the Feedback Loop That Actually Learns

    The learn phase is where self-healing automation creates durable value rather than temporary convenience. Without it, you have a system that responds to failures. With it, you have a system that progressively encounters fewer failures over time — because each incident makes the system smarter about both detecting and preventing the next one. Building this loop in practice requires four specific components that many implementations omit.

    Component 1: Outcome Labeling

    For the diagnosis model to learn, it needs labeled outcomes: did the remediation action actually resolve the failure, or did the failure recur? This sounds obvious but is frequently absent. Many systems log that an action was taken but not whether it worked. Outcome labeling requires a post-remediation validation step — a check that runs some defined interval after the action to confirm the target system is operating normally and that the same failure signature hasn’t re-appeared. The validation result becomes the ground-truth label that trains the next iteration of the diagnosis model.

    Component 2: Pattern Immunization

    When a failure pattern has been resolved at root cause — not just remediated at symptom level — the system should update its detection rules to recognize that the pattern has been fixed and should no longer trigger that specific remediation path. This prevents the system from continuing to alert on conditions that no longer exist, which is a major source of alert fatigue in mature deployments. Pattern immunization is the automation equivalent of a doctor updating a patient’s treatment history: “this was a problem, it’s been fixed, don’t keep treating it.”

    Component 3: Counterfactual Logging

    Counterfactual logging tracks cases where the system would have taken an action but didn’t — either because confidence was too low, or because a human overrode the proposed remediation. These cases are at least as valuable as successful resolutions for training the diagnosis model. A high rate of human overrides on a specific failure class tells you that your diagnosis model is wrong about that class and needs more training data. A high rate of Gate 3 escalations that humans approve without modification tells you the threshold is set too conservatively and could be moved to Gate 2.

    Component 4: Replay Testing

    Any change to the diagnosis model, remediation playbooks, or confidence thresholds should be validated against a historical dataset of real incidents before it goes to production. Replay testing re-runs past incidents through the updated system and compares the proposed actions against the documented correct resolutions. This catches regressions — cases where a change that improves handling of a new failure pattern inadvertently degrades handling of an existing one. It’s the equivalent of a unit test suite for the self-healing system itself.

    Implementation Sequence: Where to Start and What to Instrument First

    For teams that are building self-healing automation for the first time, or retrofitting it onto existing pipelines, the sequencing of implementation matters considerably. Teams that try to build all five ODDAL phases simultaneously produce systems that are over-engineered, hard to debug, and often abandoned. The right sequence builds foundation before capability.

    Phase 0 (Weeks 1–2): Failure Inventory

    Before writing any self-healing code, spend two weeks doing a structured failure inventory of your existing automation. Collect every failure that occurred in the past 90 days, classify it by the five-category taxonomy above, and measure its frequency and resolution time. This inventory tells you where to aim first. In most organizations, this analysis reveals that 60–70% of automation failures fall into the transient and structural drift categories — the two classes that have the most mature self-healing tooling available and where quick wins are achievable.

    Phase 1 (Weeks 3–6): Baseline Resilience

    Implement the classic resilience stack: retry logic with exponential backoff on all external calls, circuit breakers on high-traffic dependency integrations, and a dead-letter queue for all message-based workflows. Instrument all three layers with metrics. This phase should reduce your overall failure rate by 40–60% before any AI-driven healing is introduced, and it establishes the telemetry baseline the AI diagnosis layer will need.

    Phase 2 (Weeks 7–12): Observe and Diagnose

    Build the observability layer and the AI diagnosis agent. Start with a narrow failure taxonomy — two or three of the most frequent failure classes identified in your inventory — and train the diagnosis model on historical incident data. Instrument the DLQ to feed the diagnosis agent automatically. At this stage, the agent should produce diagnoses and confidence scores but not take autonomous action yet. This “diagnostic shadow mode” validates accuracy before you give the system any power to act.

    Phase 3 (Weeks 13–18): Gate 1 Automation

    Enable Gate 1 autonomous actions only — those with high confidence and low impact. This is typically retry-class and service-restart-class remediations. Run for four weeks with close monitoring of healing event volume, auto-resolution correctness, and false-positive rate. Calibrate thresholds based on live performance. Only expand to Gate 2 automation once Gate 1 performance metrics are stable and the audit trail is confirmed to be complete.

    Phase 4 (Ongoing): Learn, Expand, and Govern

    Introduce Gate 2 actions, activate the learn phase with outcome labeling and replay testing, and establish the three review cadences. Gradually expand the failure taxonomy coverage as the diagnosis model accumulates training data. Treat every human override and every Gate 3 escalation as a learning event, not an operational interruption. Over a well-governed 12-month deployment, teams following this sequence consistently report auto-resolution rates reaching 70–80% of all incidents, with detection accuracy above 90% — numbers that are genuinely transformational for operational teams, but only achievable when the foundation is built correctly.

    What Genuine Self-Healing Looks Like at Scale

    A few observable characteristics separate systems that are genuinely self-healing from those that are merely self-recovering with a more sophisticated dashboard.

    Genuine self-healing systems have a declining incident rate over time. The number of incidents per thousand automation runs decreases month over month, because each resolved incident feeds back into detection and prevention. Systems that are only self-recovering have a flat or rising incident rate — the system handles failures efficiently, but it doesn’t prevent them.

    They have traceable healing histories. For any production failure, you can trace the full resolution chain: what was detected, what was diagnosed, what confidence score applied, what action was taken, what validation confirmed the fix. This traceability is not just a governance asset — it’s a diagnostic asset. When something unexpected happens, the audit trail is the fastest path to root cause.

    They have improving diagnosis models. The accuracy of failure classification goes up over time, not just at deployment. Teams can point to the training data added from real incidents and show how it changed the model’s behavior on specific failure classes. This is the evidence that the learn phase is actually working rather than being a checkbox.

    And they have shrinking human review queues. Gate 2 and Gate 3 escalations decrease in volume as the system learns which actions are safe to automate, and the humans who review escalations report that the system’s proposed remediations are correct and actionable more often than not. Human reviewers stop treating the escalation queue as a source of unexpected surprises and start treating it as a quality-control step for genuinely complex cases — which is exactly what the design intended.

    Conclusion: The Discipline Behind the Automation

    Self-healing AI automation is a genuine operational capability, not a vendor feature flag. But it is a capability that requires architectural discipline to deliver on its promise — because the same properties that make it effective at handling failures also make it effective at hiding them, if the design is careless.

    The framing that tends to produce the best outcomes is this: self-healing automation is not a way to reduce the need for operational vigilance. It is a way to direct operational vigilance toward the failures that actually matter — the complex, ambiguous, structurally significant ones that require human judgment — while handling the high-volume, well-understood failures autonomously. The goal is not to eliminate human attention; it is to make human attention more valuable by focusing it correctly.

    The teams that get this right share a common characteristic: they treat the self-healing layer as a first-class engineering concern, not an operational convenience. They invest in the failure taxonomy. They build the observability layer before the healing layer. They set and govern confidence thresholds with the same rigor they apply to security policies. They run the learn phase as a continuous process, not a post-deployment afterthought.

    Done right, the numbers are compelling: auto-resolution rates in the 70–80% range, detection accuracy above 90%, MTTR reductions of 30–60%, and — crucially — a declining failure rate that compounds over time as the system accumulates operational history. Done wrong, it produces a very confident-looking system making the same mistakes repeatedly, behind a dashboard that always shows green.

    The difference between those two outcomes is almost entirely in the design decisions made before the first line of code is written.

    Key Takeaways:

    • Classify failures into five distinct types before designing any remediation. Each type needs a different strategy.
    • Build the classic resilience stack (retries, circuit breakers, DLQs) first. AI-driven healing augments it — it doesn’t replace it.
    • Use a three-gate confidence threshold model to decide when to act autonomously, notify-and-proceed, or halt-and-escalate.
    • Monitor for slow failures — drift, schema changes, and model degradation — with specific detection pipelines, not just generic alerting.
    • Treat healing event frequency as an alert condition. A spike in healing volume is a signal that something structural needs fixing.
    • Build the learn phase from day one. Outcome labeling, pattern immunization, counterfactual logging, and replay testing are what turn self-recovery into genuine self-healing.
    • Audit trails are not optional. Every autonomous action needs an immutable record with full context.
  • The Hidden Clock Problem: Why AI Agents Burn Developer Hours Before They Ship a Single Task

    The Hidden Clock Problem: Why AI Agents Burn Developer Hours Before They Ship a Single Task

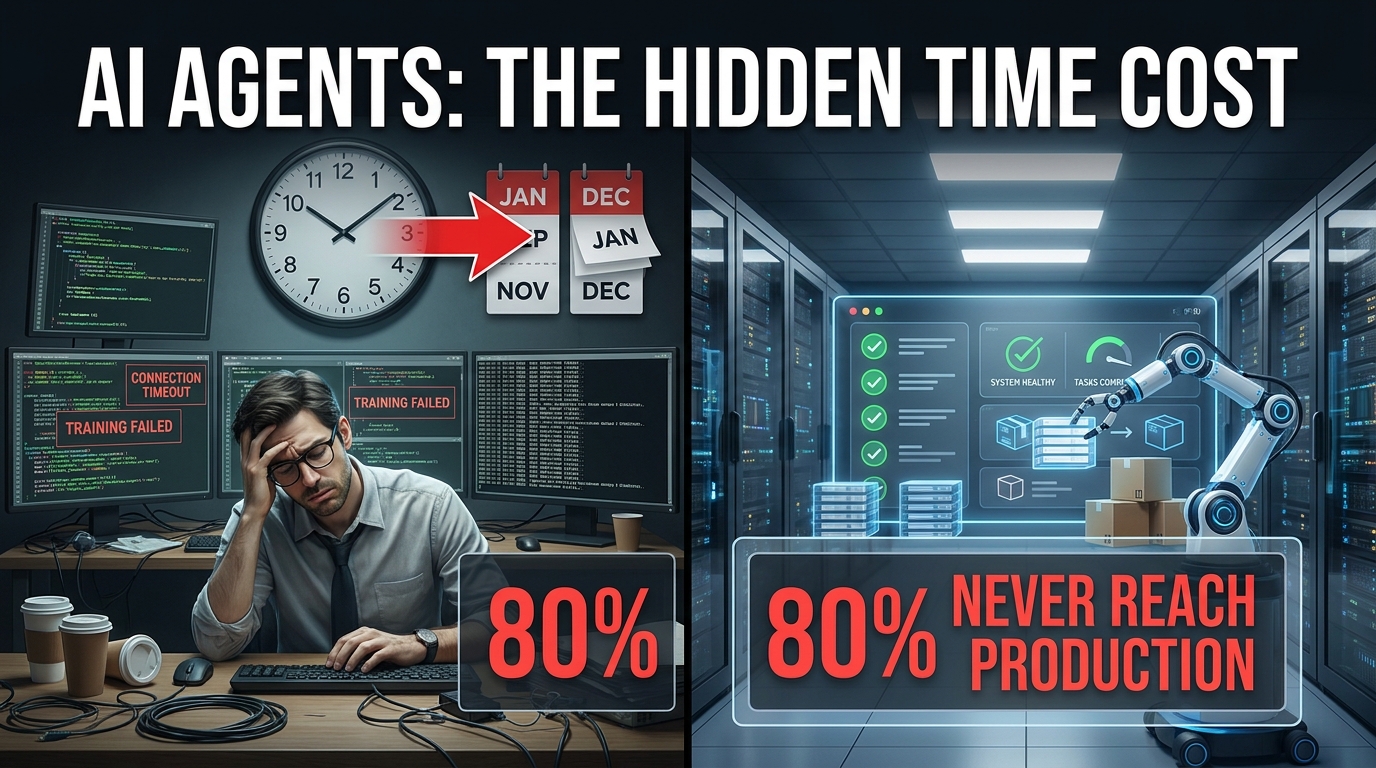
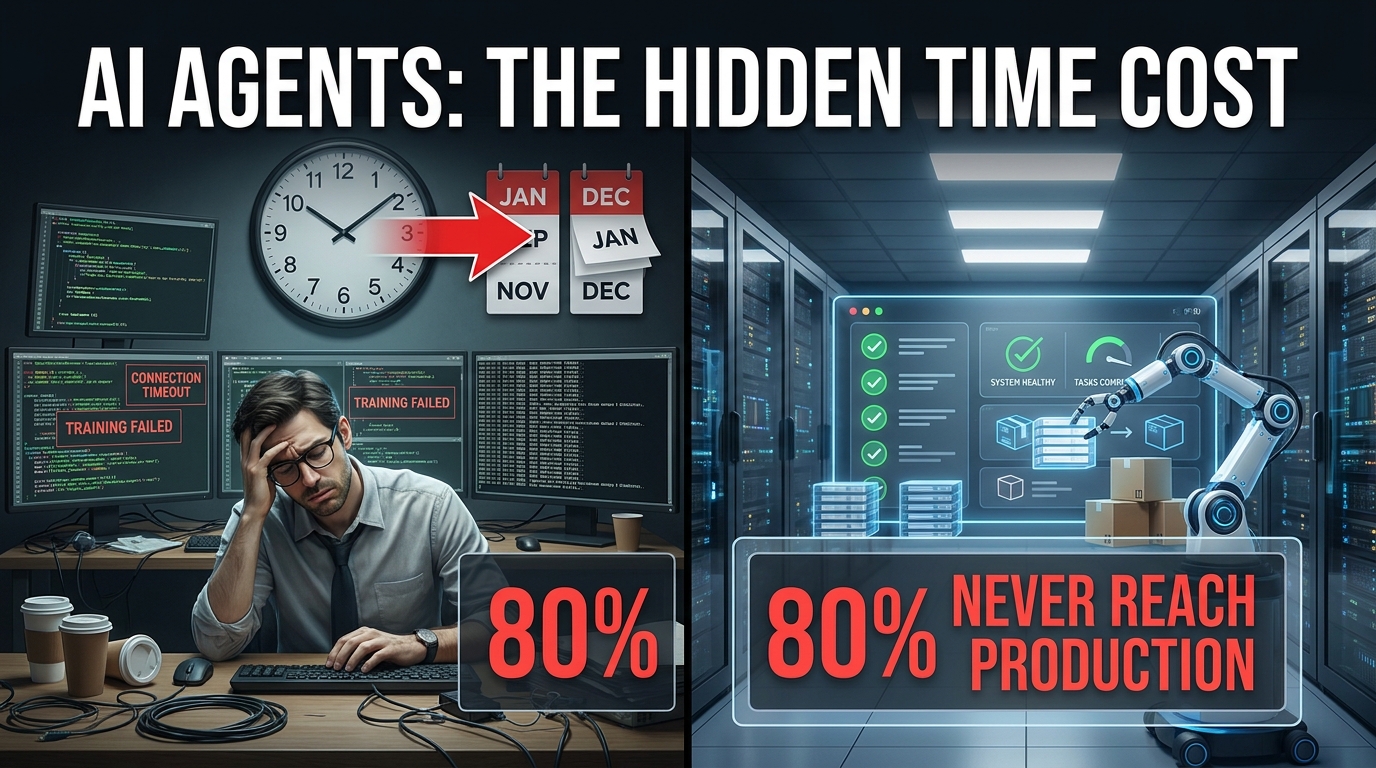
    AI Agents: The Hidden Time Cost — developer burnout vs production success split-screen

    There’s a specific kind of meeting that happens inside engineering teams around week twelve of an AI agent project. Someone pulls up the original timeline. The first bullet point says “production-ready in six weeks.” Nobody laughs. The mood is just quiet.

    This is not a story about AI being hard. It’s a story about where the hours actually go — and why the teams burning the most time are usually not the ones with the hardest problems. They’re the ones who didn’t audit the clock before they started building.

    In 2026, the production adoption curve for AI agents is steeper than it’s ever been. A LangChain survey of over 1,300 professionals found that 57.3% of organizations already have agents running in production, with another 30.4% actively developing and planning to deploy. That sounds like momentum. But read two lines further and the picture changes: quality issues are the top production barrier for 32% of respondents, latency for 20%, and the broader research paints a starker number — roughly 80% of AI agent projects never reach stable production at all.

    The gap between “demo worked” and “this is running reliably at 2am on a Tuesday” is where the hours disappear. And the causes are almost never what teams expect. The model is rarely the problem. The framework choice rarely matters as much as advertised. What kills time — and budgets, and morale — are the systems decisions that teams put off until the last possible moment.

    This piece is about those decisions. Not as a theoretical checklist, but as a concrete account of where the production clock actually starts, what makes it run faster, and what trips it to a dead stop.


    The Pilot-to-Production Gap Nobody Talks About Honestly

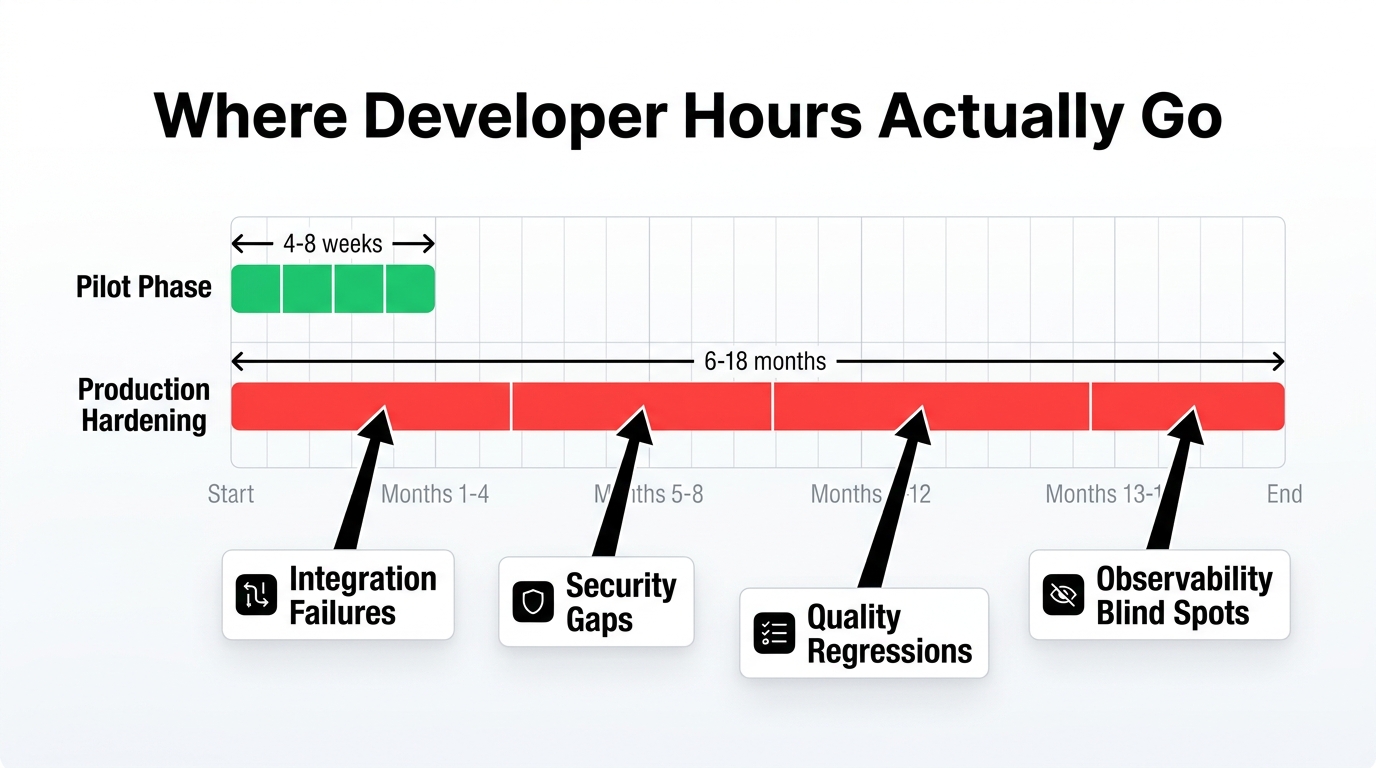
    Timeline infographic showing pilot phase taking weeks but production hardening taking months

    The pilot phase of an AI agent project moves fast. You pick a use case, wire up a language model, connect a couple of tools, and within a few days or weeks you have something that looks genuinely impressive in a demo. Stakeholders get excited. Roadmap slots get carved out. Headcount gets allocated.

    Then the real work begins — and most teams are not ready for it.

    What “6-10 Weeks to Production” Actually Requires

    The teams that genuinely ship production-grade agents in six to ten weeks share a defining characteristic: they treat the pilot as a throwaway. Not because the pilot doesn’t matter, but because they know the demo code has nothing to do with what will run in production. The pilot is a feasibility signal. The production build starts at week zero with a different mindset entirely.

    For focused, single-use-case agents — a support triage bot, a code review assistant, a data extraction pipeline — the 6-10 week window is achievable if teams have four things in place before writing a single line of agent logic: a clean data contract, a scoped permission model, an evaluation harness, and a deployment runway with at least one human approval gate baked in from the start.

    Remove any one of those four and the timeline stretches. Remove two and you’re looking at months, not weeks.

    Where Most Enterprise Teams Actually Land

    For the majority of enterprises, the realistic trajectory looks very different. A March 2026 survey found that 78% of enterprises have AI agent pilots running, but fewer than 15% have reached production. The pilot-to-production failure rate sits between 70% and 88% depending on the study and the industry — roughly two to three times higher than the failure rate for traditional IT projects of similar scope.

    The time cost is equally sobering. AI agent total cost of ownership is commonly underestimated by 40-60% versus initial budgets, and projects that do fail before production have typically burned between twelve and eighteen months of developer time before being cancelled. That’s not a niche problem. That’s the median outcome for teams that don’t treat production hardening as a first-class engineering discipline from day one.

    The frustrating part is that the bottlenecks are predictable. They show up in the same order, on the same types of projects, at the same phases. Teams just keep underestimating them because the demo was so clean.


    Why the Model Is Almost Never the Problem

    When an AI agent project stalls or fails, the instinct is often to blame the model. It hallucinated. It misunderstood the tool schema. It gave inconsistent outputs. And while none of those things are untrue, the research on production agent failures tells a different story about root causes.

    The LangChain 2026 survey data shows 32% of teams cite quality as their top production barrier and 20% cite latency. But when you unpack what “quality” means in practice, it’s rarely about the model’s underlying capability — it’s almost always about the surrounding system failing to constrain, evaluate, or recover from model behavior appropriately.

    Integration Failures Outpace Model Failures

    The dominant production failure mode in 2026 is integration-layer brittleness. Agents fail when the tools they depend on return unexpected schemas. They fail when external APIs go down and there’s no graceful fallback path. They fail when the context they need isn’t where they expect it — because no one mapped out the full data graph before deployment.

    These are not model problems. These are classic distributed systems problems wearing an AI costume. The agent is just a new kind of orchestrator, and orchestrators fail in the ways all orchestrators fail: bad contracts between components, no circuit breakers, no retries with backoff, no meaningful error states.

    Latency Is an Architecture Problem, Not a Model Problem

    The second major complaint — latency — is similarly architectural. A multi-step agent that makes five sequential tool calls at 800ms each doesn’t have a model latency problem. It has a parallelism problem and a caching problem. Teams that treat latency as something to optimize later discover that retrofitting concurrency into an agent workflow is far more expensive than designing for it up front.

    The practical implication: before choosing your model, map your tool call graph. Identify which calls can be parallelized. Build the latency budget into your architecture review. If your acceptable response time is two seconds and your naive sequential implementation takes six, no model upgrade will close that gap.

    Hallucinated Tool Calls: The Underrated Failure Vector

    One specific failure mode deserves more attention than it gets: tool hallucination. This is when an agent invokes a tool with parameters that look plausible but are semantically wrong — a date in the wrong format, an ID from the wrong namespace, a query that bypasses the intended data scope. Commercial LLMs hallucinate package names in roughly 5.2% of generated implementations, and tool call hallucination rates in production agents are in a similar range.

    At low call volumes this is a nuisance. At high call volumes it’s a data integrity problem. And it’s almost entirely preventable with strict tool schemas, input validation at the boundary, and output contracts that the agent can verify before acting.


    The Permission Trap: Over-Privileged Agents and Production Explosions

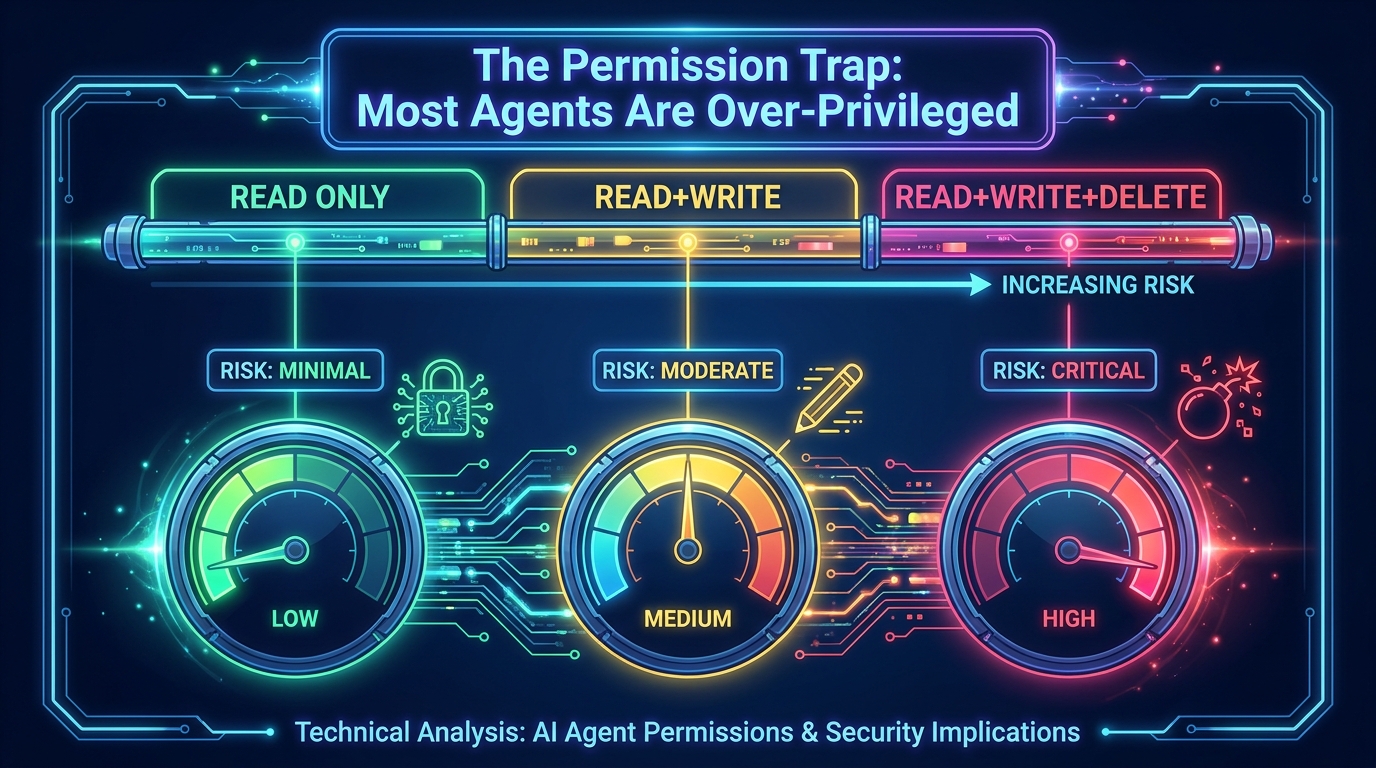
    AI agent permission risk spectrum from read-only to read-write-delete with risk gauges

    If there is one single engineering decision that distinguishes the teams with clean production records from the teams with incidents, it is this: how they handle tool permissions from the start.

    The LangChain survey data on this is illuminating. Very few respondents allow their agents to read, write, and delete freely. Most teams allow either read-only tool permissions or require human approval for write and delete actions. This is not timidity — it is hard-won operational wisdom.

    Why Teams Default to Over-Permissioning

    The path of least resistance in agent development is to give the agent broad permissions so it can complete the demo without hitting access errors. This works great in a sandbox. In production it means that any reasoning error, any hallucinated tool call, any edge case in the prompt — has the full destructive potential of the permissions you granted.

    The principle of least privilege is not a new idea. It is the foundation of secure system design going back decades. But it requires knowing, at design time, exactly what your agent needs to touch — and that requires doing the unglamorous work of mapping every tool call to the minimum necessary permission scope before writing the first integration.

    Building a Permission Model That Scales

    Production-grade agents use a tiered permission model. The first tier is read-only access to the data and APIs the agent needs to understand its context. The second tier is write access to low-stakes, easily reversible outputs — drafting a document, creating a task, updating a field that a human reviews before it goes anywhere meaningful. The third tier, if it exists at all, is high-consequence write access gated behind an explicit human approval step.

    The practical implementation looks like this: start every agent in read-only mode. Document every capability it needs. For each write capability, define what makes a write action reversible versus irreversible. Irreversible actions — deleting records, sending external communications, executing financial transactions — get human approval gates that cannot be bypassed regardless of what the agent decides.

    Teams that build this model before they build the agent logic spend maybe an extra day or two in design. Teams that retrofit it after their first production incident spend weeks.

    The “Confused Deputy” Problem in Multi-Agent Systems

    As agent architectures scale toward multi-agent orchestration — one agent spawning sub-agents, each with their own tool access — the permission problem compounds. This is sometimes called the “confused deputy” problem: a sub-agent operating under the elevated trust of its parent, taking actions the parent system was never designed to authorize.

    The mitigation is not architectural elegance — it’s operational discipline. Each agent in a multi-agent system gets its own minimal permission scope. Orchestrator agents never pass their own credentials to sub-agents. Sub-agents cannot escalate privileges without triggering a verification step. These are not exotic requirements. They are the same patterns that govern microservice security at scale, applied to a new execution context.


    Prompt Drift and the Runtime Mismatch Problem

    One of the more insidious ways AI agent projects accumulate hidden time cost is through what practitioners now call prompt drift. This is not a single catastrophic failure. It’s a slow degradation — prompt changes made informally, model versions updated without re-evaluating agent behavior, tool schemas that evolve while the prompts that reference them do not.

    The result is an agent that worked well at launch and gradually becomes unreliable over the following weeks. The failure mode is hard to diagnose because nothing obviously broke. The agent still runs. It still produces outputs. But the quality of those outputs has shifted, and nobody noticed until a user complaint surfaced or a downstream system started receiving garbage data.

    Treating Prompts Like Code (Not Notes)

    The foundational fix is to treat prompts as first-class code artifacts. That means version control. It means code review. It means that any change to a prompt is subject to the same discipline as a change to application logic — because it is a change to application logic.

    Teams that have internalized this practice run prompt changes through their evaluation harness before merging them. They maintain a changelog for prompt versions the same way they maintain a changelog for API versions. When a model upgrade is planned, they run their eval suite against the new model version before flipping the switch — not after.

    Runtime Mismatch: The Gap Between Dev and Production

    A related problem is runtime mismatch: the agent behaved correctly in development because the development environment was clean, deterministic, and had none of the entropy that production data brings. In production, the data is messier, the edge cases are real, and the tool responses include things no one planned for — empty results, malformed JSON, rate limit errors, partial data mid-stream.

    Agents built for clean data fail noisily in production. The fix requires deliberately injecting messiness into your test environment: adversarial inputs, malformed tool responses, timeout simulations, and real-world data samples that expose the gaps between what the agent expects and what it actually gets.

    This is not testing for its own sake. Every hour spent stress-testing against production-realistic conditions before launch is worth roughly five to ten hours of incident response after it. The math on this is not close.


    Building the Evaluation Layer Before You Ship

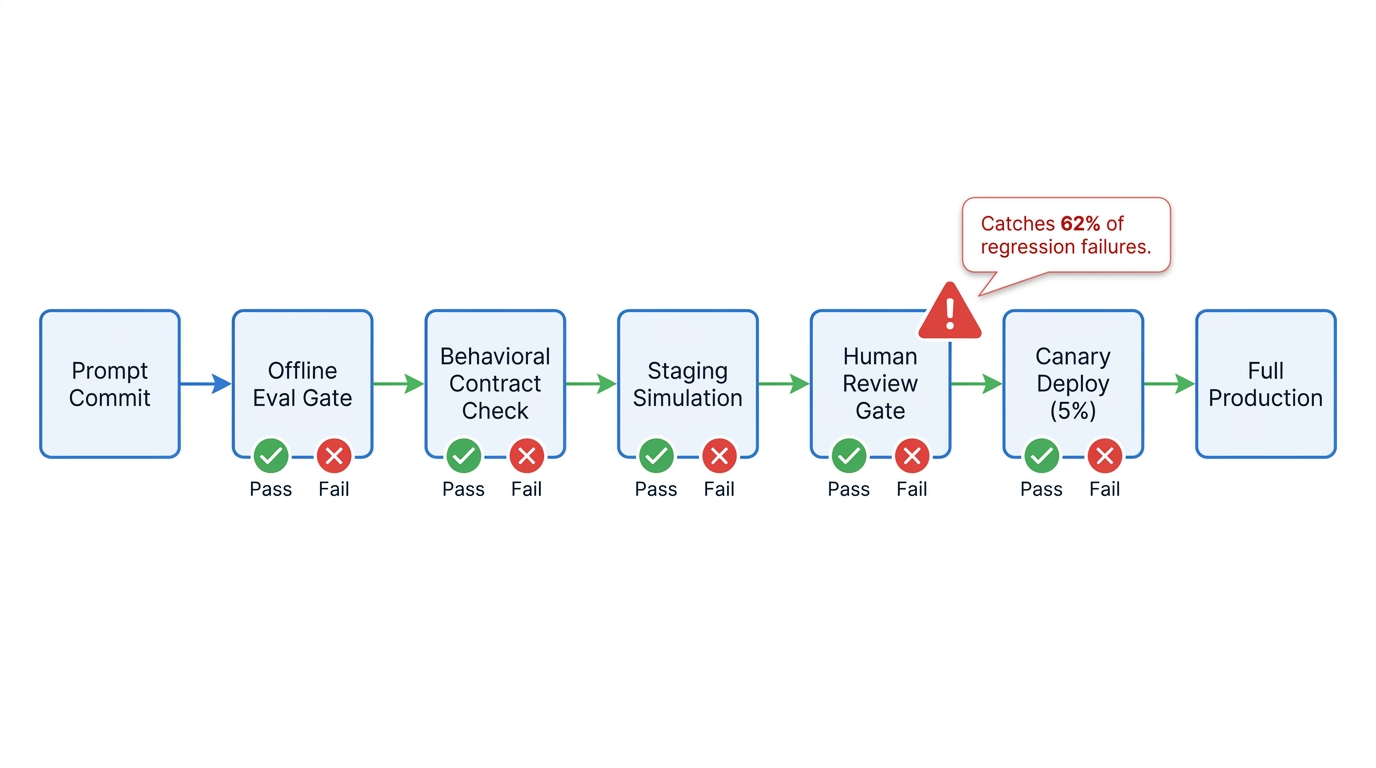
    AI agent CI/CD pipeline diagram with evaluation gates, behavioral contract checks, and canary deploy stages

    The most consistent pattern across teams that ship agents reliably and quickly is the investment they make in evaluation infrastructure before the agent touches production traffic. Not as a final QA step. As a continuous pipeline that runs against every significant change.

    The 2026 LangChain survey found that offline evaluation was cited as a testing strategy by 39.8% of respondents, compared to 32.5% using online evaluation — with many teams supplementing both with manual expert review. That gap reflects the difficulty of real-time evaluation, but the teams closing it fastest are the ones that treat evals as an engineering discipline, not a research exercise.

    What a Production-Grade Eval Harness Looks Like

    A practical evaluation harness for an AI agent has four layers. The first is unit evals: deterministic tests for specific agent behaviors. Does the agent correctly classify an input as requiring human approval? Does it format the tool call correctly for a given input type? These should run in under a second and be part of your standard CI pipeline.

    The second layer is integration evals: end-to-end test cases that run the full agent workflow against a representative test dataset. These catch the cases where each component works individually but something breaks in the interaction. Expect these to take minutes, not seconds, and run them on every PR that touches agent logic or tool schemas.

    The third layer is behavioral evals: tests that probe the agent’s reasoning on edge cases, adversarial inputs, and distribution-shifted examples. These are harder to make fully automated and often require periodic human review, but they should be running continuously in some form — either through automated sampling or scheduled review cycles.

    The fourth layer is production shadow evals: routing a percentage of real production traffic to a challenger version of the agent and comparing outputs without serving the challenger’s results to users. This is the closest you can get to production feedback before a full rollout, and it surfaces failure modes that no synthetic test dataset will find.

    CI/CD Gates That Actually Block Regressions

    The architectural shift that makes evals useful rather than ornamental is wiring them into your deployment pipeline as hard gates. A prompt change that causes a 5% regression on your core eval dataset should block the deployment, the same way a failing unit test blocks a code merge.

    This requires defining your quality thresholds before you write your evals. What is the acceptable hallucination rate for your use case? What is the acceptable task completion rate? What is the maximum latency you’ll tolerate at p95? These aren’t questions you can answer after launch. They have to be answered during design, because they determine what your eval suite is trying to prove.

    Teams that do this work upfront spend more time in the first two weeks of a project. They spend dramatically less time on the next twelve.


    The Human-in-the-Loop Spectrum: From Read-Only to Autonomous

    Human oversight of AI agents is often framed as a binary: either the agent is autonomous or a human is approving every action. The reality of production deployments is far more nuanced — and the teams that ship fastest are the ones that map out the entire oversight spectrum before deployment rather than defaulting to one extreme or the other.

    Designing Oversight at Action Granularity

    The right mental model is to think about oversight not at the agent level but at the action level. Every action an agent can take should be classified on two axes: reversibility and consequence magnitude.

    A read action is fully reversible and usually low consequence — no approval needed. A draft output that goes to a human review queue before being published is technically irreversible once sent, but the consequence is low and the review step is built in — still no hard gate required. A database write that modifies production records is harder to reverse and potentially high consequence — approval gate required. A financial transaction or an external communication is essentially irreversible and potentially catastrophic — multi-step human authorization required.

    Mapping this grid for your specific agent and its specific tool set is an hour or two of work that replaces weeks of incident response. The LangChain data confirms that production teams gravitate toward this naturally: most allow read-only by default, with write and delete access requiring explicit human approval or policy-based escalation.

    Graduated Autonomy as a Trust-Building Protocol

    The most operationally sound approach to agent deployment is graduated autonomy: start the agent with more restrictive permissions and more human checkpoints than you think necessary, then loosen constraints as the agent demonstrates reliable behavior on measurable quality metrics.

    This is not indefinite hand-holding. It’s a trust-building protocol with defined milestones. After X transactions with zero incorrect outputs and zero policy violations, the agent earns the right to operate with less oversight in that action category. The milestones are defined in advance, the measurement is automated, and the trust expansion is a deliberate engineering decision — not something that just happens because nobody revoked the training wheels.

    Organizations that deploy AI agents with this kind of graduated autonomy architecture report significantly fewer production incidents than those that launch at full autonomy and work backwards. The direction of travel matters as much as the destination.


    Agent Observability Is Not API Monitoring

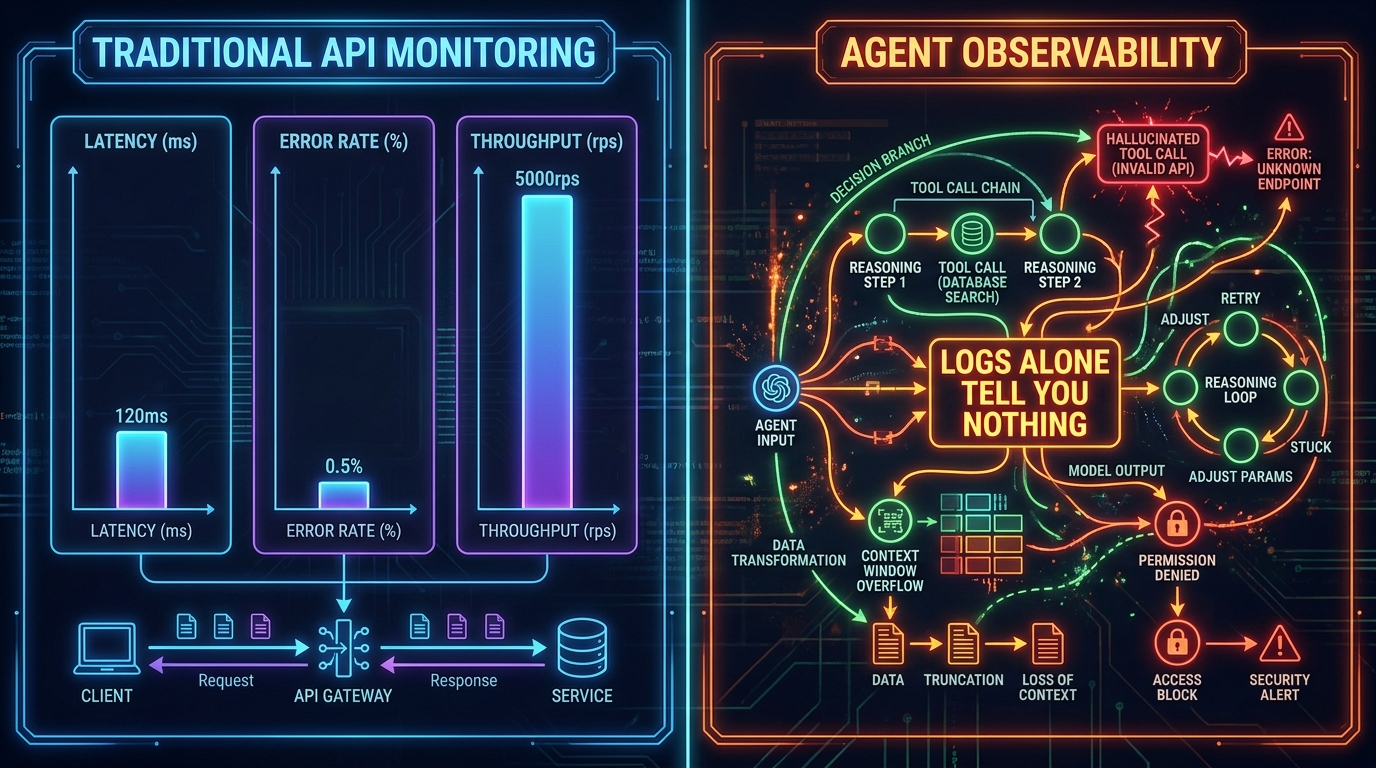
    Two-panel comparison: traditional API monitoring with clean bar charts versus AI agent observability with complex multi-step reasoning traces

    One of the most common mistakes teams make when deploying AI agents is assuming their existing monitoring stack will tell them what they need to know about agent behavior. It won’t — and understanding why is critical to not flying blind in production.

    Traditional application monitoring captures latency, error rate, and throughput. These metrics matter for agents too, but they tell you almost nothing about whether the agent is doing the right thing. An agent can return a 200 OK in 800ms with a perfectly coherent-looking output — and be completely wrong about what it just did.

    What Agent Observability Actually Requires

    Effective observability for a production AI agent requires capturing and storing the full reasoning trace: every step the agent took, every tool call it made, every decision point where it chose one path over another, and the complete context window at each step. This is not a logs problem. It’s a structured trace problem, and it requires purpose-built tooling or a significant investment in building trace collection into your agent’s execution framework.

    The reason this matters operationally is that most agent failures are not obvious from outputs alone. An agent that gave a wrong answer may have done so because it misread a tool response, because its context was corrupted by a previous step, because a permission error was silently swallowed, or because a reasoning loop caused it to discard the correct answer before generating the visible one. Without the full trace, debugging that failure requires re-running the agent under identical conditions and hoping to reproduce it — which, given the nondeterministic nature of language model inference, often doesn’t work.

    The Evaluation-Observability Feedback Loop

    The practice that separates production-mature teams from everyone else is running continuous evaluations directly against production traffic. Not just logging outputs and reviewing them manually. Running automated quality checks — hallucination detection, task completion scoring, policy adherence checks — on sampled real-world agent runs and feeding the results back into both the monitoring dashboard and the next iteration of the eval harness.

    This creates a feedback loop: production behavior informs eval design, eval results gate deployments, and deployment behavior generates the next round of production data. Teams that build this loop early find that their agents improve continuously. Teams that skip it find that their agents degrade continuously — and by the time anyone notices, the cause is buried under weeks of untraced production traffic.

    Alerting for Behavioral Drift, Not Just Uptime

    Uptime alerts matter. But for AI agents, the more operationally dangerous failure mode is silent quality degradation — the agent is up, it’s responding, and it’s getting progressively worse at its job. Setting up behavioral drift alerts means defining measurable quality metrics (task completion rate, refusal rate, tool error rate, downstream outcome metrics where available) and alerting when those metrics cross a threshold relative to a rolling baseline.

    The threshold setting is not a one-time exercise. It requires revisiting as the agent’s scope or the underlying data distribution shifts. But having a behavioral health monitor in place — even an imperfect one — is the difference between catching quality degradation in hours versus weeks.


    Staged Rollouts, Rollback, and the Art of Graduated Deployment

    The single deployment pattern that consistently saves the most developer hours over the lifetime of a production agent is not the most sophisticated one. It’s the oldest one: don’t give the new thing all of the traffic at once.

    Staged rollouts — canary deploys, traffic splitting, shadow mode — are not new ideas. But they are systematically underused in AI agent deployments, partly because teams treat their agent as a service to be deployed rather than a behavior to be trusted incrementally.

    Canary Deploys for Agents: The Mechanics

    A canonical canary deploy for an AI agent routes a small percentage of real traffic — typically 1-5% initially — to the new agent version while the rest continues running the current version. The canary runs under full observability, with automated quality checks comparing its behavior against the current version’s baseline on the same inputs where possible.

    If the canary’s quality metrics match or exceed the baseline over a defined observation window (typically 24-72 hours depending on traffic volume), the rollout advances to 25%, then 50%, then 100%. If quality metrics degrade at any stage, the canary is immediately rolled back and the trace data from the degradation is used to diagnose the cause before the next attempt.

    The key implementation requirement is that every agent version needs a unique identifier that’s propagated through the trace. Without this, you can’t separate the canary’s behavior from the baseline’s behavior in your observability data, and the whole exercise becomes meaningless.

    Rollback Planning: Before You Ship, Not After

    Rollback strategy should be designed before the first deployment, not formulated during an incident at 2am. The questions to answer up front are: How quickly can you revert to the previous agent version? What state does the agent maintain across sessions, and how does a version rollback affect that state? Are there any irreversible actions the current deploy might have taken that a rollback can’t undo?

    For stateless agents, rollback is usually straightforward — point traffic back at the previous image and you’re done. For stateful agents that maintain session context, conversation history, or task progress, rollback is more complex because the previous version may not be able to interpret the state that the new version left behind.

    Designing for rollback compatibility from the start — maintaining backward compatibility in state schemas, versioning your context format, keeping the rollback path clear in your deployment infrastructure — is the kind of engineering discipline that feels like overhead until the first incident, at which point it pays for itself entirely.


    What 6–10 Week Teams Do Differently

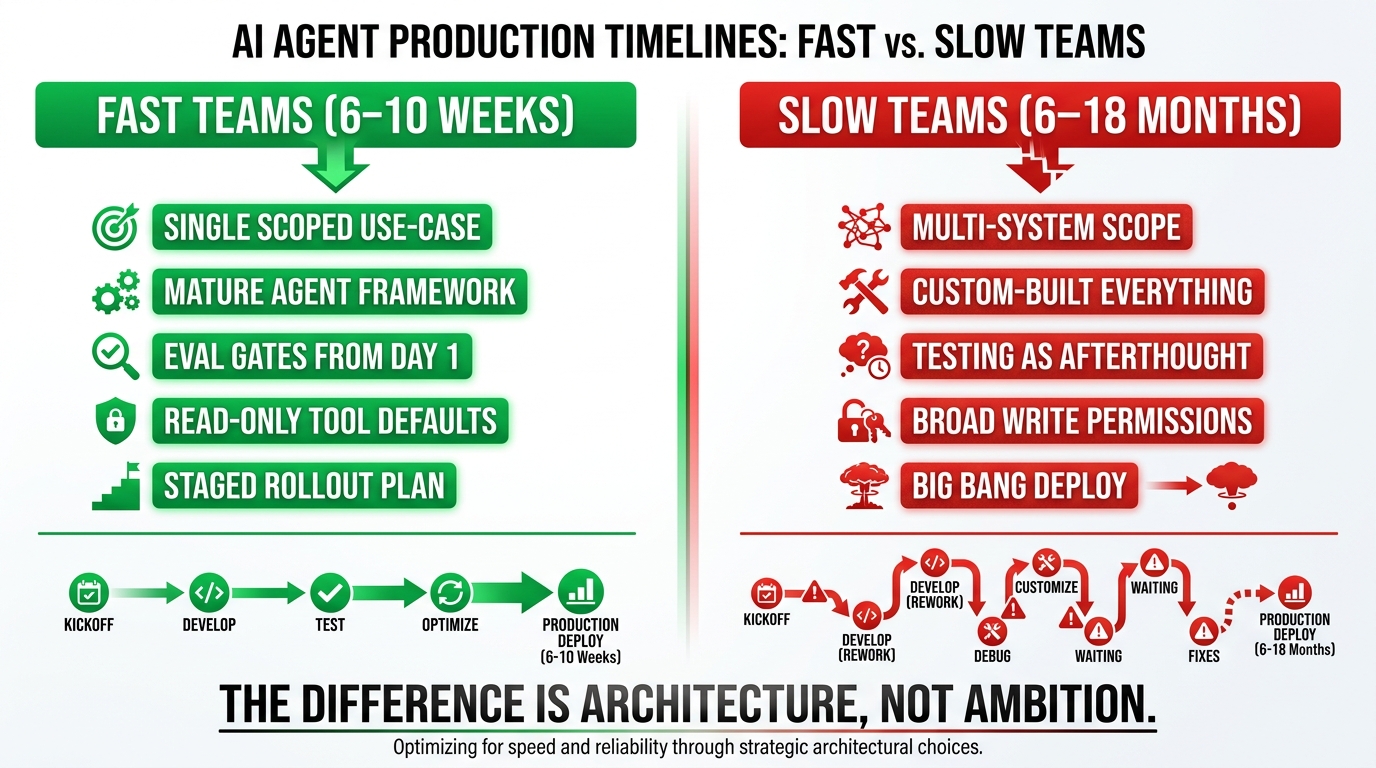
    Side-by-side comparison of fast teams shipping in 6-10 weeks versus slow teams taking 6-18 months with key differentiating practices

    The teams that consistently ship production AI agents in six to ten weeks rather than six to eighteen months are not working with fundamentally different technology stacks. They’re not operating under lighter regulatory requirements or with easier use cases. The gap is almost entirely in how they make decisions about scope, architecture, and process — specifically, how early they make the decisions that most teams defer.

    Ruthless Scope Discipline

    Fast teams scope one use case and ship it fully before touching the next one. Not “one platform with multiple agent capabilities.” One agent, one task, one definition of done. The reason is not lack of ambition — it’s that the production hardening work for any single use case (evals, permission model, observability, rollback) is substantial enough on its own without compounding it with the integration complexity of multiple simultaneous capabilities.

    Slow teams scope platforms. They build agents that are designed from day one to handle ten different task types, because the demo showed ten things the model could do and someone extrapolated that into a roadmap. The ten-task platform hits production in months — if it hits production at all. The one-task agent hits production in weeks, generates real operational data, and informs every subsequent capability addition with ground truth rather than assumptions.

    Mature Frameworks, Not Custom Orchestration

    Fast teams use mature agent frameworks — LangGraph, LlamaIndex, Semantic Kernel, Autogen — rather than building custom orchestration logic. The frameworks are not perfect. They make choices you might not have made. But they have solved the hard infrastructure problems (state management, tool schema handling, trace collection, retry logic) in ways that a custom build will spend weeks reproducing, and they have active communities that surface and fix production failure modes quickly.

    Custom orchestration is a choice that makes sense when you have specific architectural requirements that no existing framework can satisfy. For the vast majority of production agent use cases, it is a month of engineering time spent on infrastructure that could have been spent on the application layer. The teams that resist the temptation to build custom orchestration “for control” ship faster and maintain their agents more easily.

    Eval Gates and Permission Contracts Before Agent Logic

    This is the discipline that most distinguishes fast teams from slow ones: the evaluation harness and the permission contract exist before the first line of agent logic is written. They are not afterthoughts. They are the first deliverable, because they define what “correct” looks like and what the agent is allowed to touch — and without those definitions, you are building without a specification.

    Fast teams treat the week they spend building evals and defining tool contracts as the most important investment of the project. Slow teams treat evals as a pre-launch activity and discover at launch that they don’t know what correct behavior looks like well enough to evaluate it systematically.

    Staged Rollout Plans Written in Advance

    Fast teams have a rollout plan on paper before the first deployment. Who sees the agent first? What is the canary percentage? What quality thresholds trigger advancement versus rollback? What is the escalation path if something goes wrong? These are not complicated questions. They take a couple of hours to answer. But teams that answer them before deployment behave very differently during deployment than teams that wing it — because they have a shared, pre-agreed definition of success and failure that removes the need for real-time debate during an incident.


    The Technical Debt Clock Starts on Day One

    Every AI agent project accumulates technical debt. This is not a failure of engineering discipline — it’s the nature of building at the frontier of a rapidly evolving technology. But there is a meaningful difference between debt that is acknowledged, tracked, and paid down intentionally, and debt that accumulates invisibly until it becomes a structural problem.

    The New Shapes of Agent Technical Debt

    In 2026, the dominant forms of AI agent technical debt are not in the model layer. They are in the surrounding system. MIT Sloan has documented the emergence of what it calls “AI-generated code that does not work well in complex systems” — large firms accumulating piles of agent-generated integrations and scaffolding that work in isolation but create brittle dependencies at scale.

    Prompt debt is the most prevalent form: prompts that were written for an early version of the agent’s scope, never properly refactored as the scope expanded, and now contain contradictory instructions, outdated context, and deprecated tool references that the agent works around in unpredictable ways. This kind of debt is nearly invisible until it causes a production regression, at which point tracing it back to its source is a significant engineering effort.

    Tool contract debt is equally common: integrations that were built against a specific version of an external API, never versioned properly, and silently degrading as the external API evolves. The agent continues to operate, but the semantic meaning of the data it’s working with has shifted in ways that the agent’s prompt and logic cannot account for.

    Paying Down Debt Before It Compounds

    The practical approach to managing agent technical debt is to treat it the same way mature engineering teams treat software technical debt: with a regular audit cadence and an explicit allocation of engineering time for refactoring, not just feature development.

    A quarterly prompt audit — systematically reviewing every agent prompt against the current version of the agent’s task scope, tool contracts, and eval results — catches most prompt drift before it reaches critical mass. A quarterly tool contract review — verifying that every integration is still operating against the expected API version and data format — catches silent degradation before it becomes a production incident.

    Teams that build these audit cycles into their operational calendar from the first production launch spend a few days per quarter on agent maintenance. Teams that don’t spend weeks per year on incident response and mystery debugging. The math favors the maintenance investment by a significant margin.

    Scope Creep and the “One More Tool” Problem

    The most common driver of agent technical debt is scope creep — specifically, the incremental addition of new tool capabilities to an agent that was originally designed for a narrower task. Each new tool adds integration surface area, permission requirements, potential failure modes, and interactions with existing tools that the eval suite may not cover.

    The discipline of adding tool capabilities through a formal change process — with a permission review, an eval update, and a canary deploy — rather than as informal additions keeps scope creep visible and manageable. Informal tool additions are how agents go from “reliably handles five task types” to “unreliably handles nine task types and nobody is sure what changed.”


    The Actual Cost of Getting This Wrong

    Before wrapping up, it’s worth being explicit about what’s at stake — not in abstract terms, but in the operational and financial terms that engineering decisions actually get evaluated on.

    A failed AI agent project that burns twelve to eighteen months of developer time and gets cancelled before production doesn’t just lose the cost of the build. It loses the opportunity cost of what those engineers could have shipped instead. It erodes stakeholder confidence in AI investment more broadly. And in an environment where 78% of enterprises are trying to move AI agents from pilot to production, it puts the organization further behind on a capability that is increasingly competitive-table-stakes.

    The projects that succeed — the 12-15% that reach stable production — do so not because they had more resources or a better model or a luckier use case. They succeed because they treated the production engineering discipline as seriously as the AI engineering discipline. They built the scaffolding before they built the capability. They made the boring architectural decisions early so they didn’t have to make them in crisis mode later.

    This is not a philosophical point. It is a practical one. The teams burning the most hours on AI agents in 2026 are not the ones doing hard things. They are the ones deferring easy decisions until they become expensive problems.


    Conclusion: Ship Faster by Building the Right Things First

    The promise of AI agents — automating hours of human work, handling complex multi-step workflows, operating reliably at scale — is real. The path to delivering on that promise is not the one that leads through the fastest demo or the most impressive pilot. It runs through the unglamorous work that most teams put off: permissions, evals, observability, and rollback planning.

    The teams shipping in six to ten weeks are not moving faster because they skip steps. They are moving faster because they do the right steps in the right order. They scope aggressively, define correctness before they build for it, gate permissions before they grant them, and plan their rollout before they execute it. None of this is technically complex. All of it requires discipline.

    Key Takeaways for Engineering Teams

    • Start with scope, not capability: One agent, one task, one definition of done. Ship that fully before adding the next capability.
    • Build your eval harness before your agent logic: If you can’t define what correct looks like, you can’t build toward it or verify that you’ve achieved it.
    • Default to read-only permissions and earn write access: Over-permissioning is not a time-saver. It is a risk accumulator that compounds with every production hour.
    • Treat prompts like code: Version control, code review, and change management apply to prompts the same way they apply to application logic.
    • Build observability for reasoning, not just uptime: Full reasoning traces are the only way to diagnose agent failures after the fact.
    • Write your rollout plan and rollback plan before deploying: Decisions made in advance are better than decisions made during incidents.
    • Schedule quarterly agent debt audits: Prompt drift and tool contract degradation are predictable and preventable with minimal regular investment.
    • Graduated autonomy is a feature, not a crutch: Agents that earn expanded permissions over time are more reliable and easier to maintain than agents launched at full autonomy.

    The hidden clock on every AI agent project is ticking from the moment the first design decision gets made. The question is whether it’s counting down to a production launch or to the point where someone pulls up the original timeline and the room goes quiet.

    The engineering practices that determine which outcome you get are available, well-documented, and increasingly standardized. The teams winning in 2026 aren’t waiting to discover them through failure. They’re applying them from week one.

  • Inside the AI Factory: How Engineering Teams Are Cutting Model-to-Production Time from Months to Days

    Inside the AI Factory: How Engineering Teams Are Cutting Model-to-Production Time from Months to Days

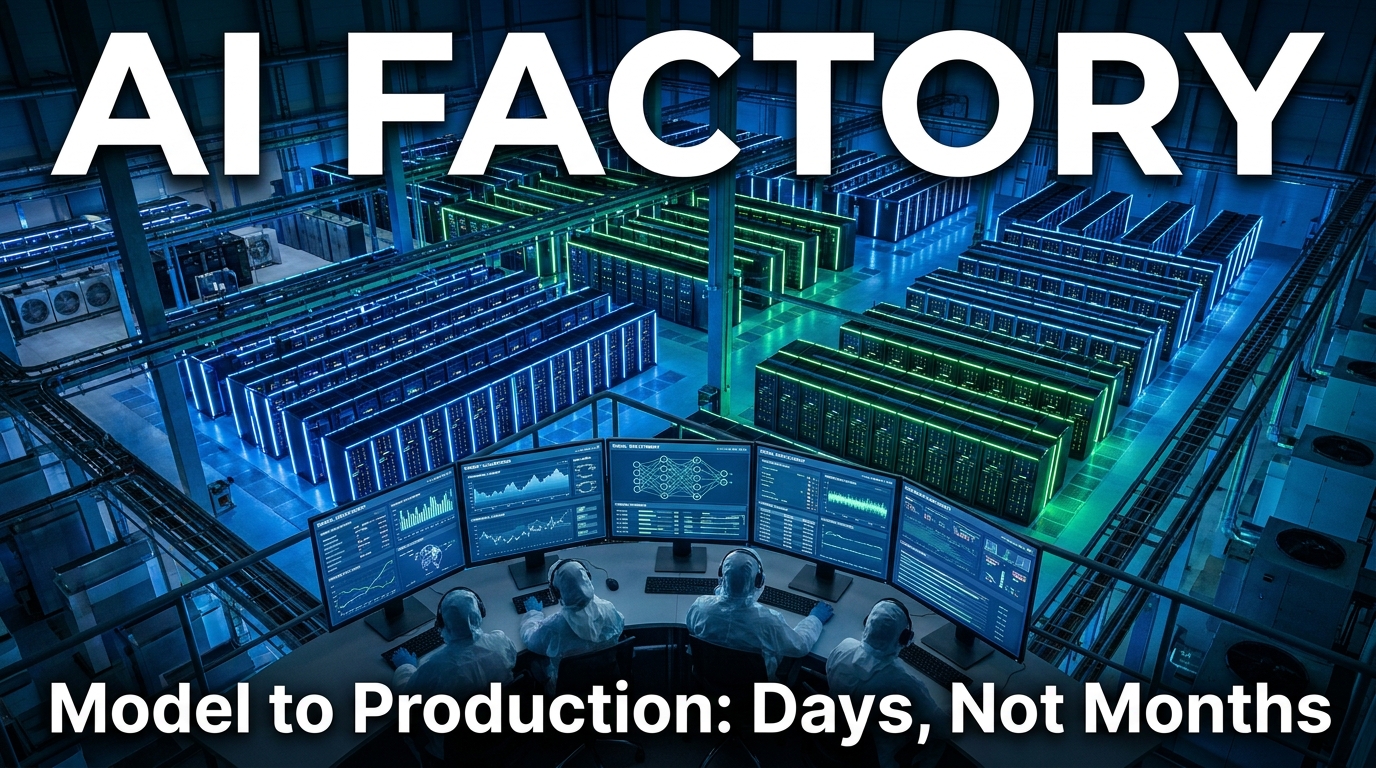
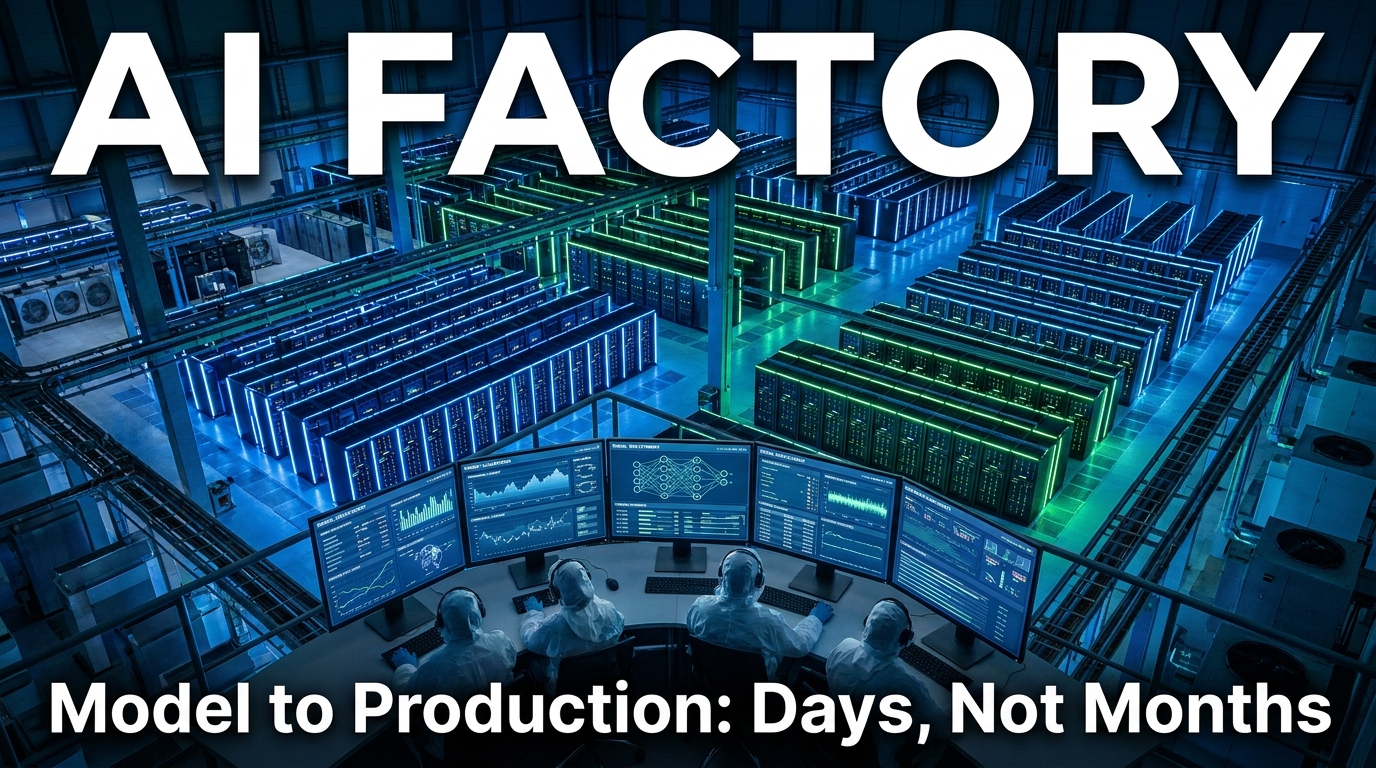
    AI factory data center floor with GPU server racks and engineers monitoring model deployment dashboards

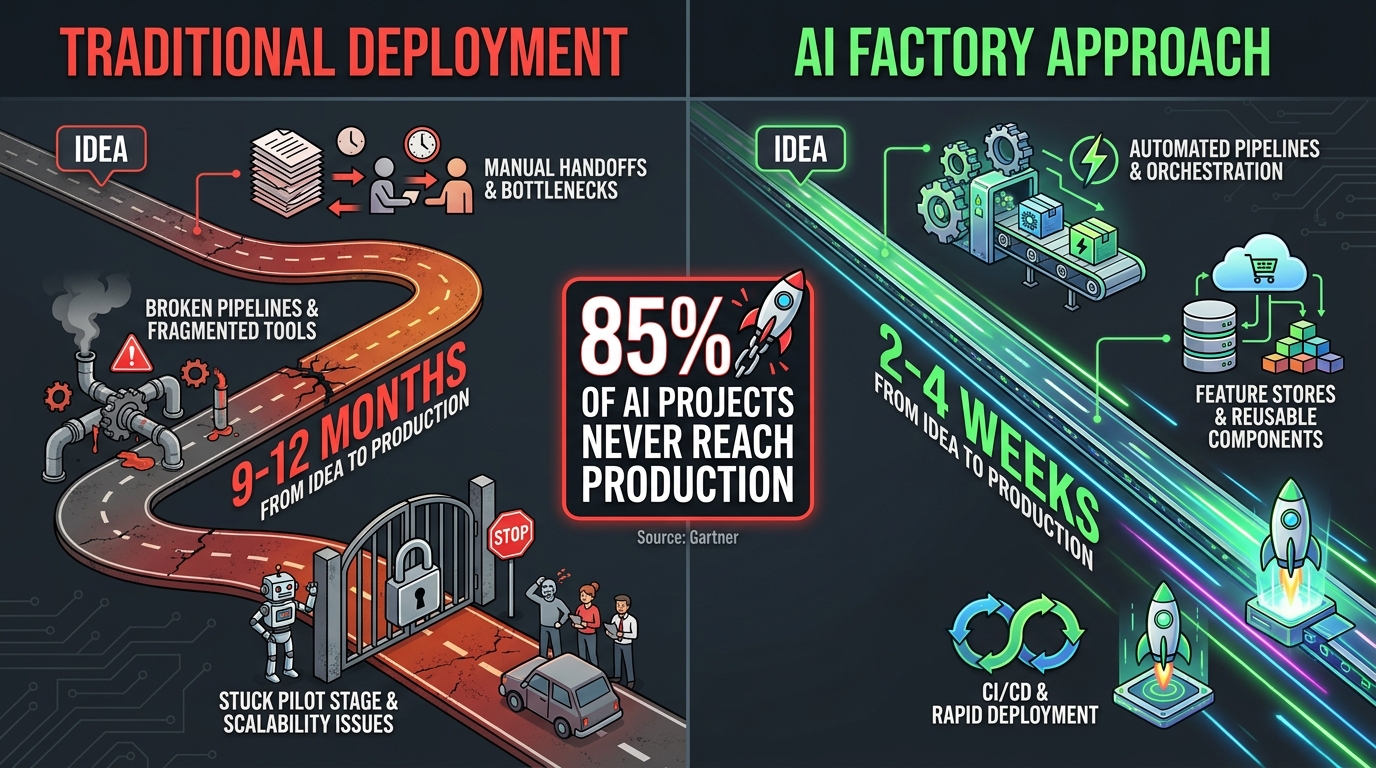
    The data scientist finishes training the model on a Tuesday. Twelve months later, it still hasn’t reached production.

    This isn’t a story about a dysfunctional team or a poorly scoped project. It’s one of the most common trajectories in enterprise AI — and it happens at companies with talented engineers, meaningful budgets, and real executive buy-in. The model exists. The results look good. And yet, somewhere between the Jupyter notebook and the production API endpoint, everything stalls.

    According to Gartner, more than 85% of AI and machine learning projects never make it to production. A separate survey of 650 enterprise leaders found that while 78% are running AI agent pilots, only 14% have successfully scaled those pilots into production systems. The average pilot stalls after 4.7 months — not because the model failed, but because the infrastructure, processes, and organizational structures needed to carry it across the finish line simply didn’t exist.

    The companies closing that gap in 2026 aren’t doing it by hiring more data scientists. They’re doing it by building AI factories: purpose-built production systems that treat model deployment the same way a manufacturing plant treats product output — with repeatable processes, standardized tooling, continuous quality control, and the discipline to ship at speed without sacrificing reliability.

    This post breaks down exactly how those factories are structured, what each layer of the stack actually does, where most teams go wrong, and what it genuinely takes to get from model training to live inference in days rather than months. No hype, no vague frameworks — just the architecture, the decisions, and the tradeoffs that determine whether your AI investments produce working software or expensive slide decks.

    What an AI Factory Actually Is (and What It Isn’t)

    The term “AI factory” gets used loosely, which causes real confusion about what you’re actually building. At one end of the spectrum, vendors use it to describe their compute hardware — NVIDIA’s Vera Rubin NVL72 rack systems, for instance, are marketed as AI factories because they produce tokens the way factories produce units. At the other end, consultants use it to describe any structured approach to building AI at scale.

    For the purposes of this post, an AI factory is the combination of infrastructure, tooling, processes, and team structures that allows an organization to repeatedly take a trained model from development into production — and then monitor, update, and retire it — without heroic individual effort every time.

    The Manufacturing Analogy Is More Literal Than You Think

    MIT’s work on the AI factory concept, developed by Thomas Davenport and others, draws a direct parallel to industrial manufacturing. In a traditional factory, you don’t rebuild the assembly line every time you want to produce a new product variant. You have a line, you configure it for the variant, and it runs. The marginal cost of the second product is dramatically lower than the first because the infrastructure already exists.

    This is exactly what most AI teams are missing. They treat every model deployment as a greenfield project — building new infrastructure, writing new monitoring code, manually coordinating handoffs between data engineering, data science, and DevOps. Each deployment costs roughly the same as the last because nothing is being standardized and reused.

    A functioning AI factory flips that equation. The MLOps platform is already there. The feature store is already there. The model registry is already there. The CI/CD pipeline that runs validation checks, pushes artifacts, and handles canary releases is already there. When a new model is ready, the team plugs it into a system that already knows how to handle it.

    What “Scale” Actually Means Here

    Scale in an AI factory context doesn’t just mean “big compute.” It means managing hundreds or thousands of models simultaneously — each with its own data dependencies, drift monitoring requirements, compliance constraints, and business stakeholders. Organizations like JPMorgan reportedly run thousands of individual AI models across their operations. That number is unmanageable with bespoke deployment processes. It requires industrial-grade tooling with centralized visibility and consistent governance.

    The MLOps market reflects this urgency: currently valued at approximately $4.39 billion in 2026, it’s projected to reach $89.91 billion by 2034 — a compound annual growth rate of 45.8%. That’s not a tooling trend; it’s a fundamental shift in how AI gets built.

    Split comparison infographic: Traditional deployment taking 9-12 months vs AI factory approach taking 2-4 weeks, with stat that 85% of AI projects never reach production

    The Five-Layer Stack You Must Build Before Writing Model Code

    One of the most persistent mistakes in enterprise AI is treating the model as the primary engineering challenge. The model is often the easiest part. The hard work is building the system around it — and that system has distinct layers that each need to be deliberately designed.

    NVIDIA CEO Jensen Huang framed this at Davos in 2026 as a “five-layer cake” — though the layers he described are most applicable to hyperscale compute environments. For enterprise teams building internal AI factories, the layering looks somewhat different in practice, and understanding the distinction matters when scoping what you actually need to build.

    The 5-layer AI factory stack diagram showing Energy and Compute, Chips and Hardware, Infrastructure Platform, Models and Data, and Applications layers with data flow arrows

    Layer 1: Compute and Infrastructure

    This is the physical and virtual foundation — the GPU clusters, cloud instances, Kubernetes orchestration, and networking that everything else runs on. For many enterprises, this starts with cloud providers (AWS SageMaker, Google Vertex AI, Azure ML) rather than on-premise hardware. The critical design decision here isn’t which cloud — it’s whether your infrastructure is defined as code.

    Infrastructure-as-Code (IaC) using tools like Terraform, Pulumi, or CloudFormation ensures that your compute environment is reproducible, version-controlled, and not dependent on manual configuration steps that vary between environments. Without IaC, the “it works on my machine” problem simply moves from the developer’s laptop to the staging cluster.

    Layer 2: Data Infrastructure

    The data layer is where most AI factories stall before they’re even built. According to Deloitte’s 2026 manufacturing outlook, 78% of enterprises automate less than half of their critical data transfers. Legacy systems — ERP platforms, operational databases, flat-file exports — operate in isolation from the ML training pipeline, which means every new model project starts with a multi-month data integration project.

    A functioning data layer includes not just raw data ingestion but also data validation (automated schema and quality checks using tools like Great Expectations), data versioning (DVC or similar), and lineage tracking so that every model can trace exactly which data version it was trained on. This last point is non-negotiable for compliance — and we’ll return to it when discussing governance.

    Layer 3: Feature Engineering and Storage

    Feature stores are the underrated backbone of any mature AI factory. A feature store is a centralized repository for computed features — the engineered inputs to your models — that serves both the offline training pipeline and the online serving infrastructure from a single source. This eliminates one of the most common sources of production failures: training-serving skew, where features computed during training differ from features computed at inference time because two separate teams wrote two separate pieces of code.

    Uber’s Michelangelo system popularized the feature store concept. Databricks, Feast, Tecton, and several cloud-native options have since made it accessible for enterprise teams without the need to build from scratch. The key benefit isn’t just consistency — it’s reusability. Once a feature has been computed and stored, any team in the organization can use it for their model without rebuilding the computation logic.

    Layer 4: Model Training and Experimentation

    This is the layer most data scientists already have some version of. Experiment tracking tools — MLflow, Weights & Biases, Neptune — log hyperparameters, metrics, and artifacts so that runs are reproducible and results are comparable. The factory-level discipline here is ensuring that every training run is logged, not just the ones that look promising, and that experiment configuration is version-controlled alongside the code.

    Layer 5: Deployment, Serving, and Monitoring

    The final layer is where models become products. This includes the model registry, the deployment pipelines, the serving infrastructure (REST endpoints, batch jobs, streaming processors), and the monitoring systems that watch for performance degradation, data drift, and concept drift in production. This layer is where most enterprise AI factories are weakest — and it’s the subject of most of the remaining sections of this post.

    The Model Registry: The Piece Most Teams Skip Until It’s Too Late

    Ask most data science teams where their production models are, and you’ll get a range of answers: “in the S3 bucket,” “in the repo somewhere,” “ask DevOps,” “I think it’s the file named model_final_v3_ACTUAL_FINAL.pkl.” This is not hyperbole. It is the standard state of model management in organizations that haven’t built a proper model registry.

    A model registry is a centralized versioned store for trained model artifacts, including their associated metadata: training data version, hyperparameters, evaluation metrics, who approved deployment, which environment they’re deployed to, and their current status (staging, production, deprecated). Think of it as Git for your models — without it, you have no meaningful version control, no audit trail, and no way to safely roll back when something goes wrong in production.

    What a Model Registry Enables

    The practical impact of a model registry goes beyond organization. When a model registry is integrated with your CI/CD pipeline and serving infrastructure, several critical capabilities become possible:

    • Reproducibility: Any model version can be rebuilt from its stored training configuration and data pointer. This is essential for debugging production incidents and satisfying audit requirements.
    • Approval workflows: High-risk models (credit decisions, healthcare triage, fraud flagging) can require sign-off from model risk management or legal before the registry promotes them to production status. This creates an auditable governance checkpoint without slowing down deployment of lower-risk models.
    • Automated canary promotion: Once a model is registered, the deployment pipeline can automatically route a fraction of live traffic to it and monitor business metrics against predefined thresholds before promoting to full production — all without manual intervention.
    • Cross-team reuse: A registered model can be reused across multiple applications without different teams deploying separate copies, which reduces infrastructure waste and prevents versioning divergence.

    MLflow, SageMaker Model Registry, and Vertex AI — Choosing the Right Tool

    MLflow’s model registry is the most commonly used open-source option and integrates cleanly with most experiment tracking setups. AWS SageMaker Model Registry and Google Vertex AI Model Registry are the managed equivalents for teams already committed to those clouds. For organizations running regulated workloads with complex approval requirements, purpose-built platforms like Domino Data Lab or DataRobot provide additional governance features on top of registry fundamentals.

    The tooling choice matters less than the discipline of actually using one. Organizations that implement model registries report 60-80% faster deployment cycles and a significant reduction in the “where is the production model?” questions that consume senior engineering time.

    Building the ML CI/CD Pipeline: Not Just Continuous Delivery for Software

    Software CI/CD is well understood. You commit code, tests run automatically, and if they pass, the build is deployed. ML CI/CD follows the same logic but has to account for a fundamental difference: in ML, the code, the data, and the model are all independently versioned artifacts that must all be validated and managed as part of the pipeline.

    A change to the training data can break a model just as surely as a change to the model architecture. A change to feature computation logic can silently degrade production performance without triggering any code-level test failures. ML CI/CD must catch all three classes of change — and that requires a different pipeline design than standard software delivery.

    MLOps CI/CD pipeline diagram showing data validation, model training, evaluation and testing, model registry, canary deployment, and full production release stages with auto-rollback capability

    The Three Stages of ML Continuous Integration

    Stage 1 — Data Validation: Before a training run even begins, the pipeline validates the incoming data. This means checking schema consistency, testing for unexpected null rates or distributional shifts, validating referential integrity for joins, and confirming that the data version being used is the expected one. Tools like Great Expectations or Soda Core automate these checks and fail the pipeline if they detect data quality issues. This single stage prevents the majority of “the model was fine but production data was different” failures.

    Stage 2 — Training and Evaluation: The CI system triggers an automated training run and evaluates the resulting model against a suite of tests — not just aggregate accuracy metrics, but slice-based performance checks (how does it perform on the minority class? on this geographic segment? on recent data?), bias detection checks (demographic parity, equalized odds), and regression tests against the current production model’s performance. If the challenger model doesn’t beat the champion by a predefined threshold on all required dimensions, the pipeline fails and the deployment stops.

    Stage 3 — Integration and Contract Testing: Once a model passes evaluation, the pipeline tests that it integrates correctly with the serving infrastructure — that the input schema matches what the application will send, that response latency is within acceptable bounds under load, and that the model output conforms to the downstream application’s expected format. Breaking the serving contract silently is one of the most common causes of production incidents that take days to diagnose.

    Continuous Training: The Third “C” Most Teams Forget

    Standard CI/CD covers continuous integration and continuous delivery. ML requires a third C: Continuous Training (CT). In production, the world keeps changing — user behavior shifts, the distribution of inputs drifts away from the training data, and model performance silently degrades. Without automated retraining triggers, you discover this when the business reports that the predictions “don’t seem to be working anymore.”

    Continuous training systems monitor production data distributions against training baselines and trigger automated retraining runs when drift exceeds a defined threshold. The retrained model goes through the same CI/CD pipeline as any other model change — no special handling, no manual bypass. When it works well, models stay fresh without requiring constant human attention. When it detects an anomaly that’s too large to handle automatically, it escalates to a human reviewer rather than silently deploying a potentially degraded model.

    Canary Releases, Blue-Green Deployments, and Rollback Discipline

    The single biggest risk in ML deployment isn’t the model itself — it’s deploying a change to a system that’s handling live traffic without a safe way to limit blast radius and reverse course quickly. Software teams learned this lesson years ago and developed a set of progressive deployment patterns that have become standard practice. ML deployment is only beginning to adopt them consistently.

    Canary Deployments

    A canary deployment routes a small percentage of live traffic — typically 5-10% — to the new model version while the remaining traffic continues to the current production model. The system monitors business-level metrics (not just technical health metrics like latency and error rate, but also conversion rates, fraud catch rates, customer satisfaction scores — whatever the model is supposed to move) across both populations. If the new model performs at or above the current model across all monitored metrics, traffic is progressively shifted: 10% → 25% → 50% → 100%. If any metric degrades, traffic is instantly routed back to the current production model and the deployment is paused for investigation.

    The key discipline here is defining success criteria before deployment begins, not after. Teams that review metric dashboards retrospectively and debate whether a 0.3% drop in precision is “acceptable” are making governance decisions under pressure and usually get them wrong. Pre-defined rollback thresholds remove the ambiguity.

    Blue-Green Deployments

    Blue-green deployments maintain two identical production environments — one running the current model (blue), one running the new model (green). Traffic is switched from blue to green all at once, but the blue environment remains live and idle so that traffic can be instantly switched back if a problem is detected post-cutover. This pattern is better suited to models where you need atomic cutover (regulatory requirements, breaking schema changes) rather than gradual rollout. The tradeoff is the cost of running two full production environments simultaneously, which makes it less appropriate for compute-heavy serving infrastructure.

    Shadow Mode Testing

    Before either canary or blue-green deployment, shadow mode (or “dark launch”) is a powerful validation technique. In shadow mode, the new model receives a copy of every production request and generates predictions — but those predictions are not returned to the user or acted upon by the system. They’re logged and compared against the production model’s predictions. This allows teams to validate model behavior on real production traffic without any risk of affecting users. When shadow mode results are satisfactory, the team has much higher confidence going into a live canary deployment.

    Governance, Compliance, and the EU AI Act Reality in 2026

    AI governance has moved from optional best practice to legal requirement. The EU AI Act’s enforcement provisions, which take effect in August 2026, require organizations deploying high-risk AI systems to maintain comprehensive documentation: model cards describing architecture, performance, and known limitations; centralized catalogs of deployed AI systems; version tracking with lineage back to training data; and evidence of human oversight mechanisms.

    Non-compliance carries fines of up to 7% of global annual revenue — a figure that gets executive attention in a way that “MLOps best practices” typically does not. For enterprise teams building AI factories in 2026, governance infrastructure is no longer a separate workstream to tackle later. It needs to be built into the factory architecture from day one.

    AI governance control room with screens showing model drift alerts, bias detection dashboards, EU AI Act compliance checklist, audit trail logs, and model inventory catalog

    What Governance Infrastructure Looks Like in Practice

    Model cards: Every model in the registry should have an associated model card — a structured document capturing training data provenance, evaluation results across key demographic and performance slices, known failure modes, intended use cases, and out-of-scope use cases. Generating model cards automatically as part of the training pipeline (rather than asking data scientists to write them manually after the fact) dramatically increases compliance and accuracy.

    Audit trails: The factory must log every significant event in a model’s lifecycle — when it was trained, on what data, who approved it, when it was deployed, what traffic it received, when it was updated, and when it was retired. These logs need to be immutable, timestamped, and queryable. Systems like MLflow, with appropriate access controls, handle this reasonably well. For regulated industries like financial services or healthcare, purpose-built model risk management platforms offer additional features.

    Bias detection: Automated bias checks should run at multiple points in the pipeline — during training evaluation, during shadow mode, during canary deployment, and continuously in production. The specific metrics depend on the use case (demographic parity for hiring models, equalized odds for lending decisions, calibration for risk scoring), but the principle is the same: bias testing must be systematic and documented, not ad hoc and optional.

    The Human-in-the-Loop Requirement

    Agentic AI systems — models that take autonomous actions rather than just returning predictions — face particularly stringent governance requirements. Moody’s reported that human-in-the-loop agentic AI cut production time by 60% by surfacing concise, decision-ready information for human reviewers rather than attempting fully automated decisions in high-stakes contexts. This isn’t a technical limitation; it’s a governance choice that maintains compliance, auditability, and appropriate human accountability for consequential decisions.

    Building human oversight checkpoints into automated pipelines — particularly for models that affect credit, healthcare, employment, or law enforcement — is a design requirement, not an afterthought. The factory architecture should make it easy to route model outputs through human review queues for specific decision categories, with clean logging of both the model’s recommendation and the human’s final decision.

    Real Deployment Benchmarks: What’s Actually Achievable

    The gap between “what’s theoretically possible with perfect MLOps” and “what organizations actually achieve when they build real AI factories” is significant. Here’s what the documented evidence shows.

    AI factory deployment benchmarks infographic showing 90% faster deployment with MLOps, Ecolab 12 months to 30 days, MakinaRocks 6 months to 4 weeks, McKinsey 9+ months to 2-12 weeks, and 300-500% ROI within 12 months

    Documented Case Results

    Ecolab: Reduced model deployment time from 12 months to 25-30 days by implementing cloud-based MLOps pipelines, automated service accounts, and systematic monitoring. The key change wasn’t a single technology — it was standardizing the process so that the same pipeline handled every new model rather than each project team building their own deployment approach.

    MakinaRocks (manufacturing): Cut deployment from over 6 months to approximately 4 weeks — roughly an 80% reduction — while simultaneously reducing the MLOps setup manpower required by 50%. The efficiency gain came from building reusable pipeline components that manufacturing teams could configure for new use cases without starting from scratch.

    Moody’s with Domino Data Lab: Deployed risk models 6x faster (months-long timelines reduced to weeks) using an enterprise MLOps platform that standardized APIs, enabled instant redeployment from beta testing feedback, and centralized model management across teams.

    McKinsey’s documented benchmark: Organizations with mature MLOps practices take ideas from concept to live deployment in 2-12 weeks, compared to 9+ months traditionally, without requiring additional headcount. The speed gain is almost entirely from eliminating repetitive manual work and waiting time.

    What Mature MLOps Actually Delivers vs. Where Teams Start

    Industry data from multiple sources suggests a consistent pattern. Organizations without structured deployment tooling get roughly 20% of trained models into production. Organizations with integrated MLOps infrastructure raise that to 60-70%. The remaining 30-40% of “failures” aren’t technical failures — they’re models that fail evaluation gates, fail business case reviews, or are superseded by better approaches before deployment completes. That’s the system working as intended.

    ROI from MLOps investment follows a J-curve pattern: the first 6-12 months require significant infrastructure build cost with limited direct model output benefit. Once the factory is operational, Forrester-cited estimates put realized ROI at 300-500% within the first year of production operation, with individual deployments generating direct productivity and cost savings that compound as more models are added to the factory.

    What “Days” Deployment Actually Requires

    The headline benchmarks of deploying new models in “days” need context. That timeline is achievable — but it assumes the entire factory infrastructure is already in place and the new model fits within existing patterns (same data sources, same serving requirements, same monitoring approach). Truly novel models requiring new data pipelines, new serving endpoints, or new monitoring logic still require longer timelines. The factory accelerates iteration and deployment of models within established patterns; it doesn’t eliminate infrastructure work for genuinely new use cases.

    The Compute Architecture Question: Cloud, On-Premise, and Hybrid

    Where you run the compute for your AI factory is increasingly a strategic decision rather than a purely technical one. The answer depends on your regulatory environment, data sovereignty requirements, cost profile, and the nature of your workloads.

    Cloud-Native AI Factories

    For most enterprises starting from zero, managed cloud platforms — AWS SageMaker, Google Vertex AI, Azure ML — offer the fastest path to a functioning factory. They provide integrated feature stores, experiment tracking, model registries, deployment endpoints, and monitoring in pre-built, managed form. The tradeoff is cost predictability at scale and data residency constraints for regulated industries.

    DigitalOcean’s March 2026 AI factory launch in Richmond, powered by NVIDIA B300 HGX systems with 400Gbps RDMA fabric and NVIDIA Dynamo 1.0 (which claims a 3x cost reduction over previous generation Hopper GPUs), shows that competitive managed GPU compute is no longer exclusively the domain of hyperscalers. Mid-market organizations have more options than they did 24 months ago.

    On-Premise and Hybrid Architectures

    Financial services, healthcare, and government organizations frequently face data residency requirements that preclude full cloud deployment. For these organizations, hybrid architectures — with training and sensitive data processing on-premise and model serving potentially split between on-prem and cloud endpoints — have become the standard answer. The complexity cost is real: hybrid architectures require more sophisticated networking, identity federation, and data movement tooling. The governance benefit justifies that cost for regulated workloads.

    NVIDIA’s reference architecture for enterprise AI factories — using Blackwell and Vera Rubin hardware, NIM microservices for model serving, and Run:ai for workload orchestration — provides a structured blueprint for on-premise deployments that mirrors the manageability of cloud platforms. NVIDIA’s own internal deployment reportedly scaled hundreds of isolated AI pilots into a unified, secure workflow using this stack, with 1.1 billion documents ingested via customized RAG architecture.

    Rack-Scale Systems and What They Change

    The shift to rack-scale AI systems — NVIDIA’s NVL72 (72 GPUs and 36 CPUs in a single rack, delivering 35x token throughput over the previous Hopper generation at equivalent power), Groq’s LPX rack with 256 Language Processing Units — fundamentally changes the economics of inference at the infrastructure layer. When a single rack can serve that volume of model requests, the per-token cost of inference drops significantly, and the case for running high-volume inference workloads on-premise vs. paying per-call cloud API rates shifts. For organizations with high inference volume (millions of model calls per day), this is a meaningful cost calculus change in 2026.

    The Team Structure That Actually Ships Models

    Technology alone doesn’t build a functioning AI factory. The team structure and ownership model determines whether the infrastructure gets used or becomes another internal platform that everyone ignores because it’s too complex to navigate without help.

    The Platform Team Model

    The most effective structure in large organizations is a dedicated ML Platform team — separate from the data science teams that build models — whose job is to build and maintain the factory itself. This team owns the feature store, the model registry, the CI/CD pipelines, the serving infrastructure, and the monitoring systems. They provide these as internal services that domain-specific data science teams consume through self-service tooling.

    This separation solves a persistent organizational problem: without a dedicated platform team, infrastructure work gets neglected because data scientists are incentivized to build models (the visible output), not pipelines (the invisible plumbing). When the platform team exists and is measured on platform adoption and deployment velocity rather than model performance, the incentives align correctly.

    Self-Service Is the Goal, Not the Starting Point

    True self-service — where a data scientist can take a trained model and deploy it to production without requiring assistance from the platform team or DevOps — is the target state for a mature AI factory. But it typically takes 12-18 months of platform investment to get there. Teams that try to build self-service platforms before they have operational experience with what data scientists actually need end up building the wrong abstractions.

    The better path is starting with high-touch support (the platform team helps each team deploy their first model), building reusable components from that experience, and progressively automating the handholding until the platform genuinely serves itself. Addepto’s documented experience with enterprise MLOps platforms shows this trajectory clearly: the first deployment with platform support takes weeks; by the tenth deployment on the same platform, teams that understand the system can move in days.

    Ownership After Deployment

    One of the most consistent failure modes in enterprise AI is the “who owns it in production?” problem. The data scientist who built the model has moved on to the next project. The DevOps team doesn’t understand the model well enough to triage business-logic failures. The application team assumes the model team handles retraining. Nobody is watching the drift metrics. The model slowly degrades over months until a business stakeholder notices that “the predictions seem off.”

    AI factories need explicit ownership assignment for every production model — a named team or individual who is accountable for production performance, drift responses, scheduled retraining, and eventual retirement. This is organizational policy, not technology. But without it, even the best technical infrastructure produces models that aren’t actually maintained.

    Common Failure Modes — and How to Avoid Each One

    After examining dozens of enterprise AI deployment efforts, several recurring failure patterns stand out. These aren’t obscure edge cases. They’re the dominant reasons that well-resourced teams fail to build functioning AI factories.

    Failure Mode 1: Building the Factory After the Models

    Many organizations start deploying individual models ad hoc — manually, bespoke, one at a time — with the intention of “building proper infrastructure later.” The factory never gets built because by the time the team returns to it, they’re already committed to maintaining all the bespoke deployments they created. Start with the factory. Deploy your first production model through it, even if that means the first deployment takes longer than a manual approach would have. The discipline of building the infrastructure first pays off from the second model onward.

    Failure Mode 2: Monitoring Only Technical Metrics

    Latency, error rates, and throughput are necessary monitoring signals — but they’re insufficient. A model can be technically healthy (fast, low error rate, high uptime) while performing terribly on the business metric it was deployed to move. Production monitoring must include business KPIs: conversion rate impact, fraud detection rate, recommendation click-through, risk score accuracy against realized outcomes. Teams that monitor only technical health discover model drift from business stakeholder complaints rather than automated alerts.

    Failure Mode 3: Treating Generative AI Differently

    Many organizations have separate, informal deployment processes for LLMs and generative AI models because “they’re different from traditional ML.” The functional requirements are different in some ways — prompt versioning, response quality evaluation, and hallucination monitoring require different tooling — but the governance and operational requirements are the same or stricter. Generative AI models in production need model registries, version control, drift monitoring, approval workflows, and rollback capability just as much as any classification or regression model.

    Failure Mode 4: Skipping Staging Environments

    The number of organizations that push ML model updates directly to production because “it passed unit tests in dev” is striking. Production data almost always differs from training and dev data in ways that can’t be fully anticipated. A staging environment that receives a continuous feed of production-representative traffic — with production-grade monitoring and load — catches the majority of “it worked in dev but broke in prod” failures before they reach users. The cost of running a staging environment is trivially small compared to the cost of a production model incident.

    Failure Mode 5: Data Fragmentation Without a Resolution Plan

    Only 20% of organizations feel fully prepared to scale AI despite 98% exploring it. The #1 reason is data fragmentation — ERP systems, CRMs, data warehouses, and operational databases that don’t integrate cleanly with the ML training pipeline. No factory architecture can overcome fundamentally broken data infrastructure. Before investing in MLOps tooling, organizations need an honest assessment of whether their data layer can reliably feed the models they’re trying to build. If it can’t, the first investment needs to be data infrastructure, not model deployment.

    What Building It Actually Looks Like: A Phased Approach

    For teams starting from minimal MLOps infrastructure, building a full AI factory isn’t a single project — it’s a phased investment that spans 12-24 months. Here’s a realistic sequence based on documented enterprise implementations.

    Phase 1 (Months 1-3): Foundations

    Focus entirely on the basics that every subsequent capability depends on. Stand up experiment tracking (MLflow is the lowest-friction start). Implement version control for training code and data. Deploy your first model through a manual but documented process. Create a simple model registry spreadsheet if nothing else — get into the habit of tracking what’s in production before automating it. Identify and fix the three worst data quality issues in your highest-priority use case.

    Phase 2 (Months 4-9): Automation

    Build the CI/CD pipeline around the process you documented in Phase 1. Automate data validation. Automate training runs triggered by data updates. Add the model registry as a real system. Set up basic drift monitoring for production models. Get your second and third model deployed through the pipeline — the automation pays dividends immediately. Establish the platform team or assign clear ownership for factory maintenance.

    Phase 3 (Months 10-18): Scale and Governance

    Implement the feature store. Add canary deployment and automated rollback. Build the model card and audit trail infrastructure. Begin migrating existing bespoke model deployments onto the factory. Develop self-service documentation. Add business metric monitoring alongside technical monitoring. Address the governance requirements your compliance and legal teams need for the EU AI Act or equivalent regulations in your jurisdiction.

    Phase 4 (Month 18+): Optimization and Self-Service

    By this point the factory is operational and the focus shifts to reducing friction. Streamline onboarding so a new data scientist can deploy their first model through the factory in a single day rather than a week. Add automated capacity management. Build feedback loops from production performance back to training pipeline improvements. Begin exploring more advanced capabilities: online learning, multi-armed bandit frameworks for model comparison, automated hyperparameter optimization triggered by drift detection.

    Conclusion: The Factory Mindset Is the Strategy

    The organizations producing measurable AI value in 2026 share a common characteristic: they stopped treating model deployment as an engineering task and started treating it as a manufacturing capability. The question isn’t “can our team deploy a model?” — it’s “how many models can our infrastructure deploy per quarter, with what average lead time, at what confidence level that each one meets quality and compliance standards?”

    That shift in framing changes everything: what you invest in, how you staff, what metrics you track, and how you explain AI ROI to the business. A data scientist who can train better models is valuable. A platform that can systematically convert trained models into production systems is an enterprise capability with compounding returns.

    The benchmarks are clear and consistent across industries: organizations with mature AI factory infrastructure deploy in days rather than months, get 60-70% of trained models into production rather than 20%, and document ROI of 300-500% on MLOps investment within 12 months of operation. None of those numbers are marketing figures — they come from documented case studies at real companies that built the plumbing before they built the models.

    Actionable Takeaways

    • Start with a model registry today. Even a simple, structured tracking system for what models are in production, what data they were trained on, and who owns them changes the operational maturity of your AI practice immediately.
    • Define rollback criteria before every deployment. Know exactly which metric dropping by exactly how much triggers an automatic rollback. Remove the discretion — it’s slower and less reliable under pressure.
    • Invest in data validation before MLOps tooling. No deployment pipeline makes up for training and serving on different data distributions. Fix the data layer first.
    • Assign explicit production owners. Every model in production needs a named person or team accountable for its ongoing health. Without that, even the best factory degrades into an unmaintained graveyard of slowly rotting models.
    • Build governance in, not on. Model cards, audit trails, and bias checks added retroactively are painful and incomplete. Architect them into the pipeline from the beginning — especially in light of EU AI Act requirements taking effect in 2026.
    • Measure the factory, not just the models. Track deployment lead time, production success rate, and time-to-rollback alongside model accuracy. The factory metrics tell you whether you’re building a capability or just accumulating technical debt in a new location.

    Building an AI factory is not glamorous work. It’s infrastructure work — the kind that nobody celebrates when it’s running well but that everyone feels acutely when it isn’t. But it is the work that determines whether the next twelve months of AI investment produces working software or another collection of promising-but-undeployed experiments. The technology exists. The patterns are proven. The only variable left is whether your organization chooses to build the factory or keep wondering why the models never seem to make it out.