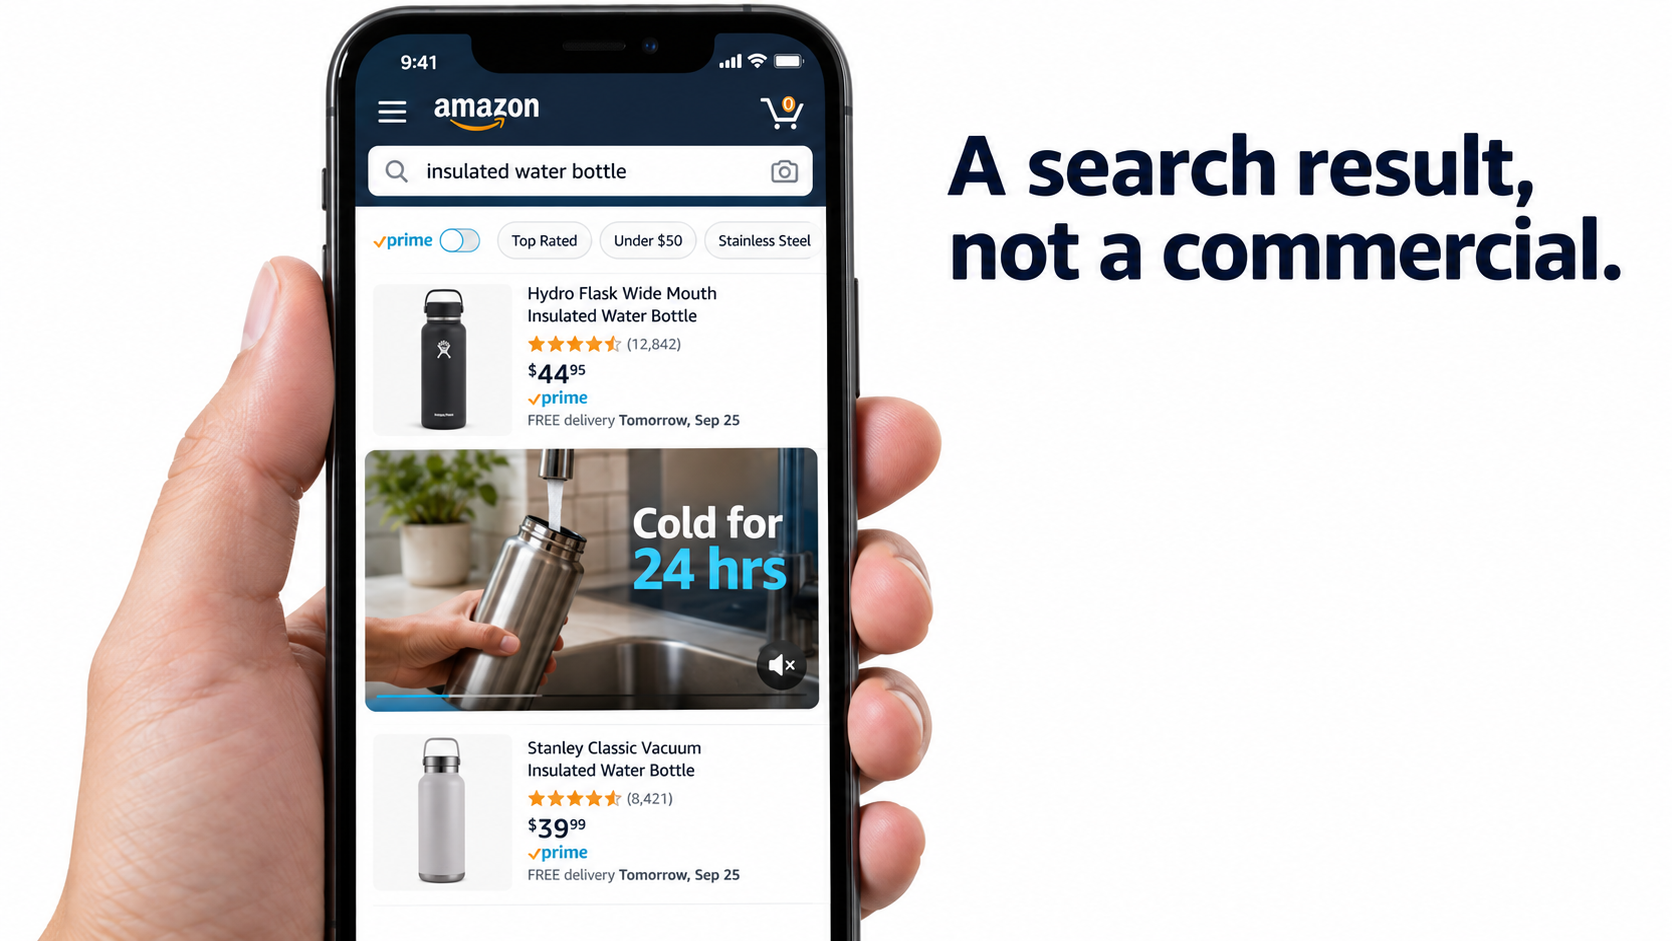
Most Amazon Sponsored Brands video ads fail before anyone sees the product. That isn’t because the footage looks bad. Often it’s beautiful: slow product reveals, lifestyle scenes, a logo animation, a voiceover with a clear story. The trouble is that the ad was built for the wrong place.
A Sponsored Brands video (SBV) doesn’t play before a show or in a social feed where people are relaxing. It plays inside a list of search results, with the sound off, next to competing products that show prices, star ratings, and Prime badges. The shopper typed a query a second ago and is scanning fast. Your video is one more result they can scroll past.
That changes how you should plan, shoot, edit, target, and measure these ads. You’re not making a commercial that happens to run on Amazon. You’re making a moving search result. It has to answer the query faster and more clearly than the static listings around it.
This guide works through that idea from start to finish. It covers how the placement actually behaves, why every video should map to a group of related searches, what the first two seconds must do, how to design for silent autoplay, which creative choices get ads rejected, how to choose between the detail page and the Brand Store as the destination, how to set up campaigns and bids, and which metrics tell you whether the creative is working.
The approach is practical. Where Amazon has published data, it’s cited. Where the advice comes from how the format works, it’s labeled that way. Specs and policies change, so treat any numbers here as a starting point and check them against the current Amazon Ads console before you spend money on production.
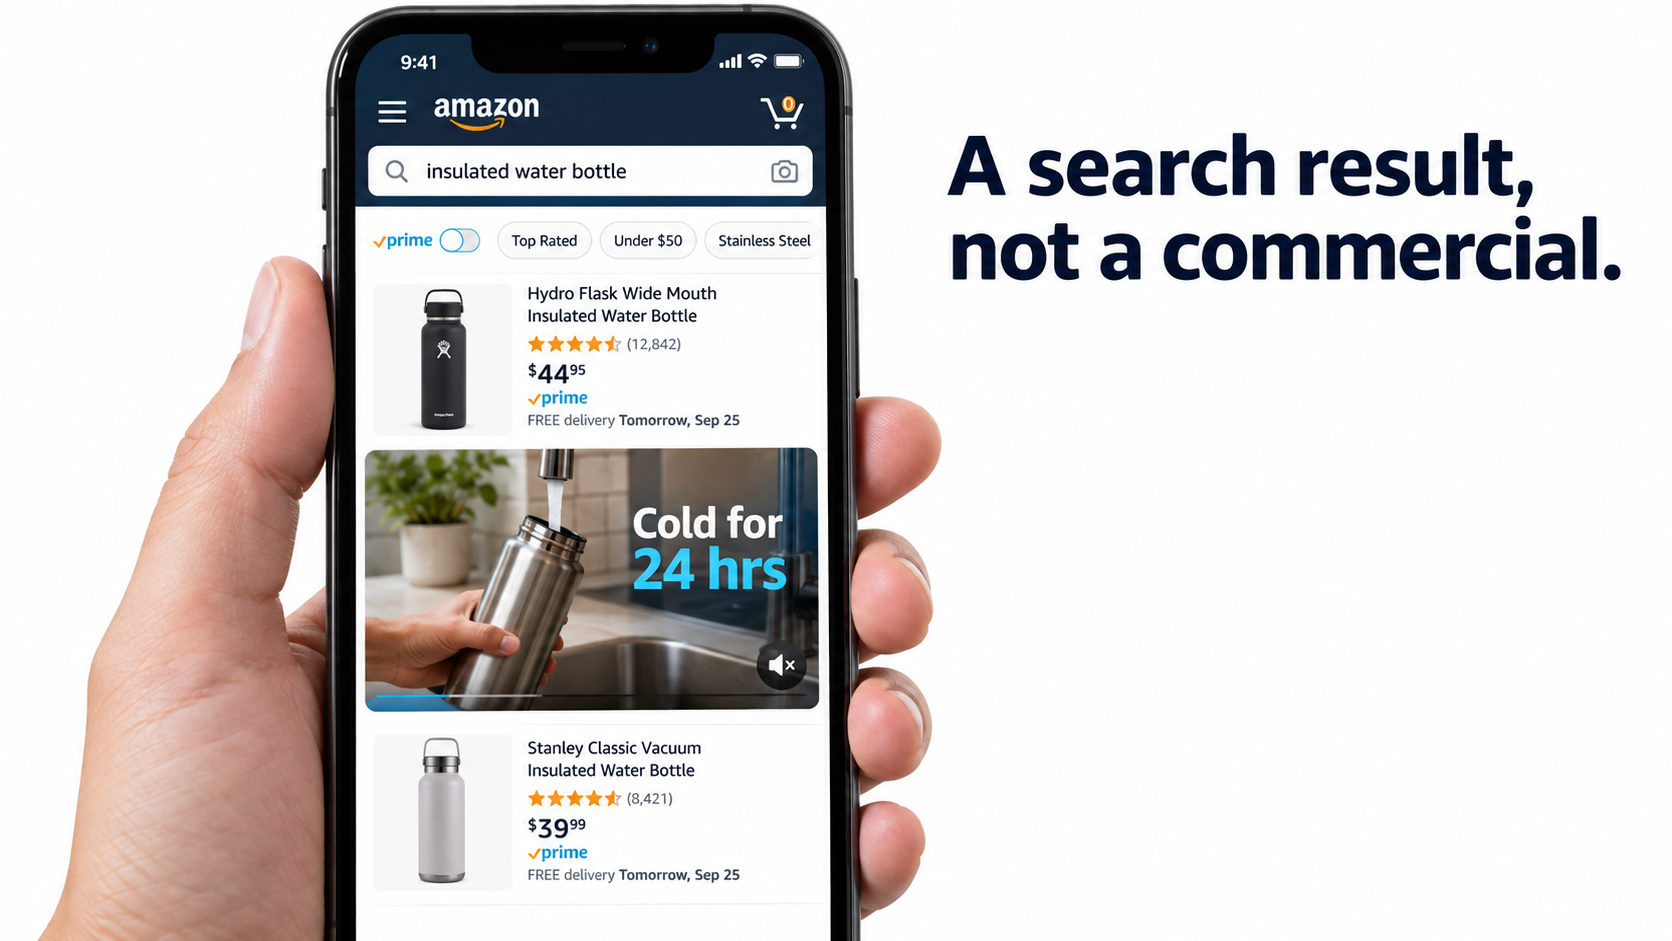
Why Sponsored Brands Video Gets Misunderstood
Amazon describes Sponsored Brands as an ad product that helps “shoppers discover your brand with video, image, or collections,” with ads appearing “above, alongside, or within shopping results” on desktop and mobile. That description is the most useful thing to remember about the format. The ad lives among the results.
Many brands still hand SBV briefs to agencies or editors whose experience is in YouTube pre-roll, connected TV, or social ads. Those formats reward emotional build-up, brand storytelling, and sound design. Search results don’t. The confusion shows up in three recurring mistakes.
Mistake 1: Treating the video as brand awareness only
Amazon does position Sponsored Brands as a way to grow brand discovery, and the video format helps with that. But the shopper who sees it has already told Amazon what they want. A search for “insulated water bottle 32 oz” is close to a purchase. A video that spends ten seconds on mood before showing the bottle wastes the strongest intent signal in digital advertising.
Mistake 2: Assuming someone is watching
On TV, the viewer is watching the screen by default. In search, the shopper is looking at a grid. Your video competes with thumbnails, prices, and review counts. Every frame has to earn attention, and the very first frame most of all.
Mistake 3: Using one video for every keyword
A commercial is made once and shown to everyone. A search result is relevant to one query. Brands that run a single “hero” SBV across hundreds of keywords end up with an ad that loosely fits everything and clearly answers nothing. Relevance, not production value, is what gets the click.
The rest of this guide follows one principle: build each SBV to be the best answer to a specific set of searches, readable with the sound off, in under three seconds.
Anatomy of the Placement: Where SBV Runs and How It Behaves
Before you write a script, understand the conditions your video plays in. These conditions matter more to creative decisions than any brand guideline does.
Where the ads appear
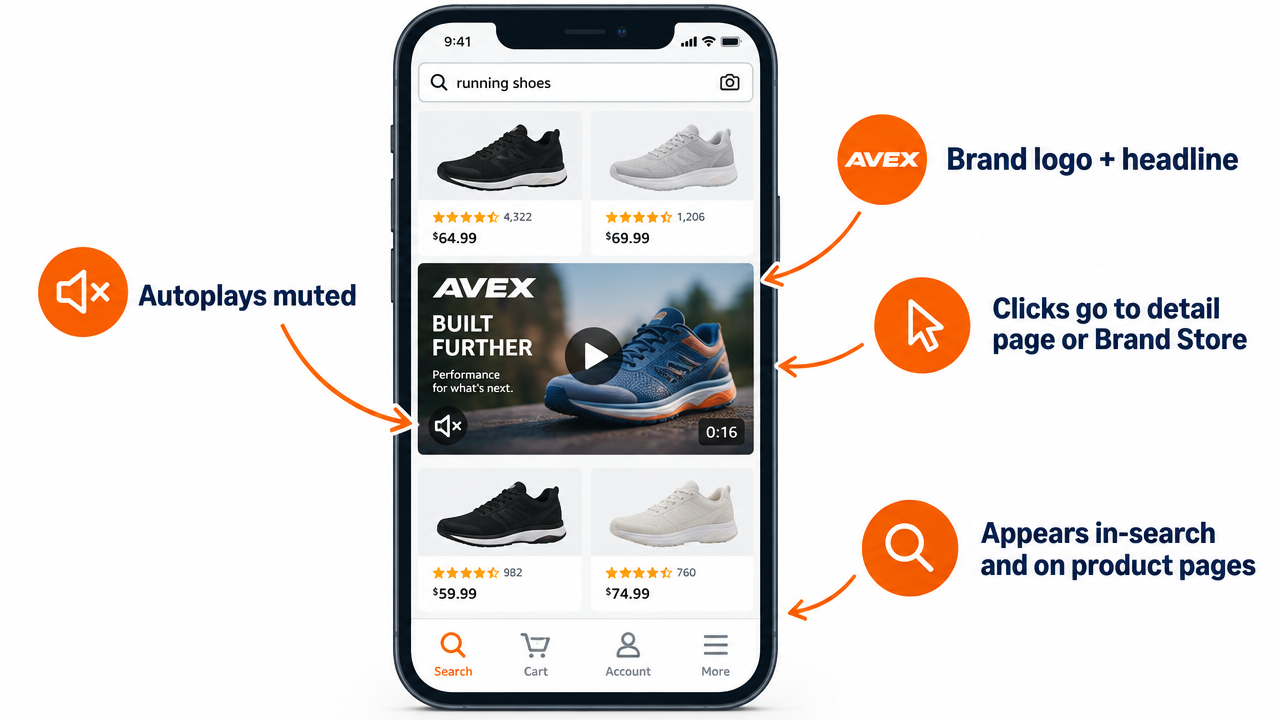
Amazon says Sponsored Brands ads can appear at the top of search results, within results, and on product pages, on both desktop and mobile. In practice, SBV most often appears as a wide video unit placed among the organic results rather than above them. It can also show on product detail pages when you use product targeting.
That in-grid position is why the “search result” framing matters. Your video isn’t a banner above the results. It interrupts the list the shopper is scrolling through, so it needs to look like it belongs there.
How playback works
SBV autoplays muted once it’s on screen. Shoppers can unmute, and Amazon reports unmutes as a metric, but you should assume most impressions happen in silence. Any message carried only by voiceover or dialogue will reach very few people.
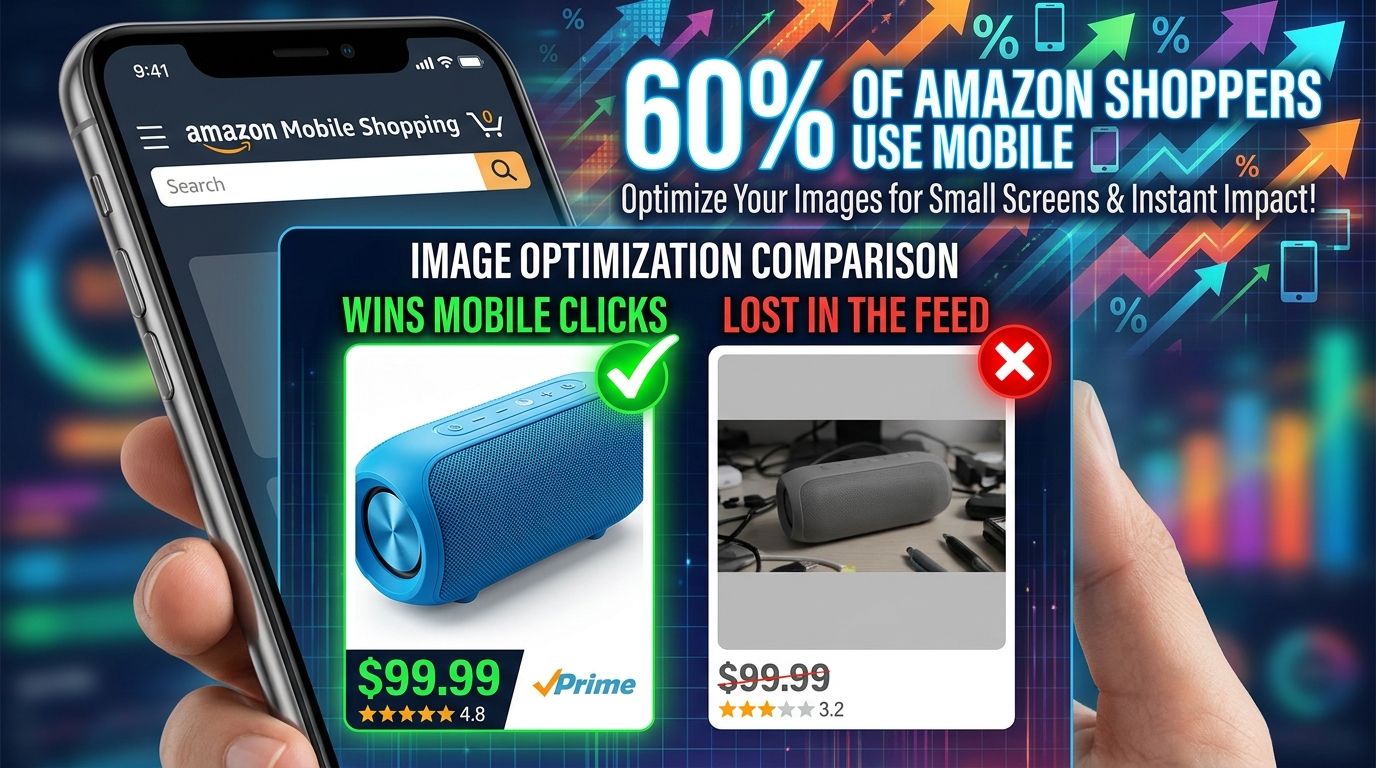
The unit usually shows the video with your brand logo or name, a short headline in some formats, and the featured product’s listing details: title, price, star rating, and Prime eligibility. So the shopper sees your creative next to the same decision signals they see on organic listings. If your rating or price isn’t competitive, great video won’t fully make up for it.
Format options
Amazon’s Sponsored Brands video offering has grown over time. Broadly, you’ll find:
- Single-product video: The video features one ASIN, and clicks usually go to that product’s detail page. This is the most common and most direct setup.
- Brand or multi-product video: The video appears alongside several products, and clicks can go to your Brand Store or a Store subpage. This suits brands with a range of related products.
Format names and options change as Amazon updates the console. Check what’s available in your marketplace and account type when you build the campaign.
What this means for creative
Put together, the placement conditions give you a clear brief. The video must:
- Show the product in the first frame, because autoplay starts right away and scrolling is fast.
- Communicate without sound, because it’s muted by default.
- Match the query, because it sits among results the shopper judges for relevance.
- Support the listing signals shown next to it, not contradict them.
The Intent-Cluster Principle: One Video Per Group of Searches
This is the biggest strategic change most SBV programs can make, and the one that most separates the “search result” mindset from the “commercial” mindset. Instead of one video for the whole product, build several videos and match each to a group of searches that share the same underlying need.
What an intent cluster looks like
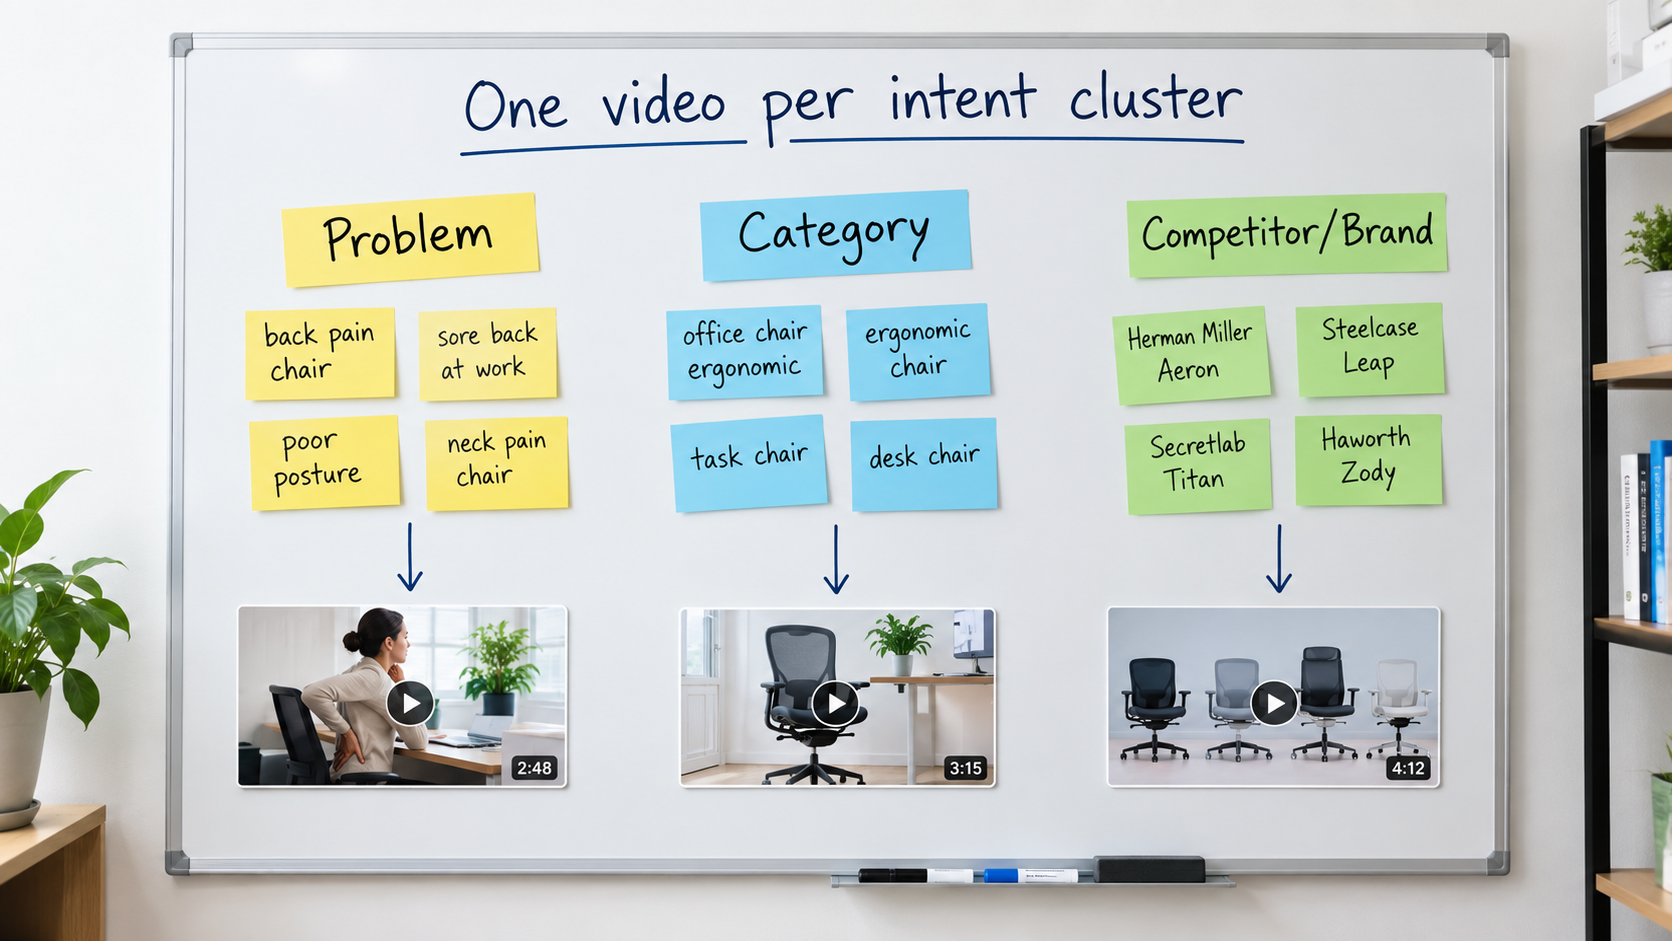
Take a hypothetical ergonomic office chair. Its search terms usually fall into a few groups:
- Problem-led searches: “chair for lower back pain,” “office chair lumbar support.” These shoppers care about relief.
- Category searches: “ergonomic office chair,” “mesh desk chair.” These shoppers are comparing options and care about features and value.
- Use-case searches: “gaming chair for long hours,” “home office chair small space.” These shoppers care about fit for their situation.
- Competitor or brand searches: Terms that include other brand names. These shoppers already have a reference point and need a reason to switch.
A single video can’t lead with back-pain relief, a feature comparison, compact size, and a competitive advantage all at once. Each group needs a different opening message.
How to build clusters from your own data
You probably already have what you need. Pull your Sponsored Products search term report and your Brand Analytics search query data if you have access. Then:
- Filter to terms with meaningful impressions and at least some conversions.
- Label each term by the need it expresses, not just by the words in it.
- Group terms with the same label and add up the impressions for each group.
- Rank groups by volume and conversion rate. The top two or three become your first video briefs.
Writing the brief per cluster
For each cluster, write one sentence that answers the shopper’s unspoken question. For the back-pain cluster, that might be “Adjustable lumbar support that moves with you.” For the small-space cluster, “Fits under a 26-inch desk.” That sentence becomes the first text overlay and shapes the opening shot.
The rest of the video can share footage across versions. Often only the first three to five seconds and the text overlays change. That keeps production costs manageable while making each version clearly relevant to its searches.
Mapping clusters to campaigns
Give each cluster its own campaign or ad group with its matching video, so relevance stays tight and reporting stays clean. If you mix clusters in one ad group, you won’t be able to tell whether a video worked because of its creative or despite a poor keyword fit.
The First Two Seconds: Passing the Frame-One Test
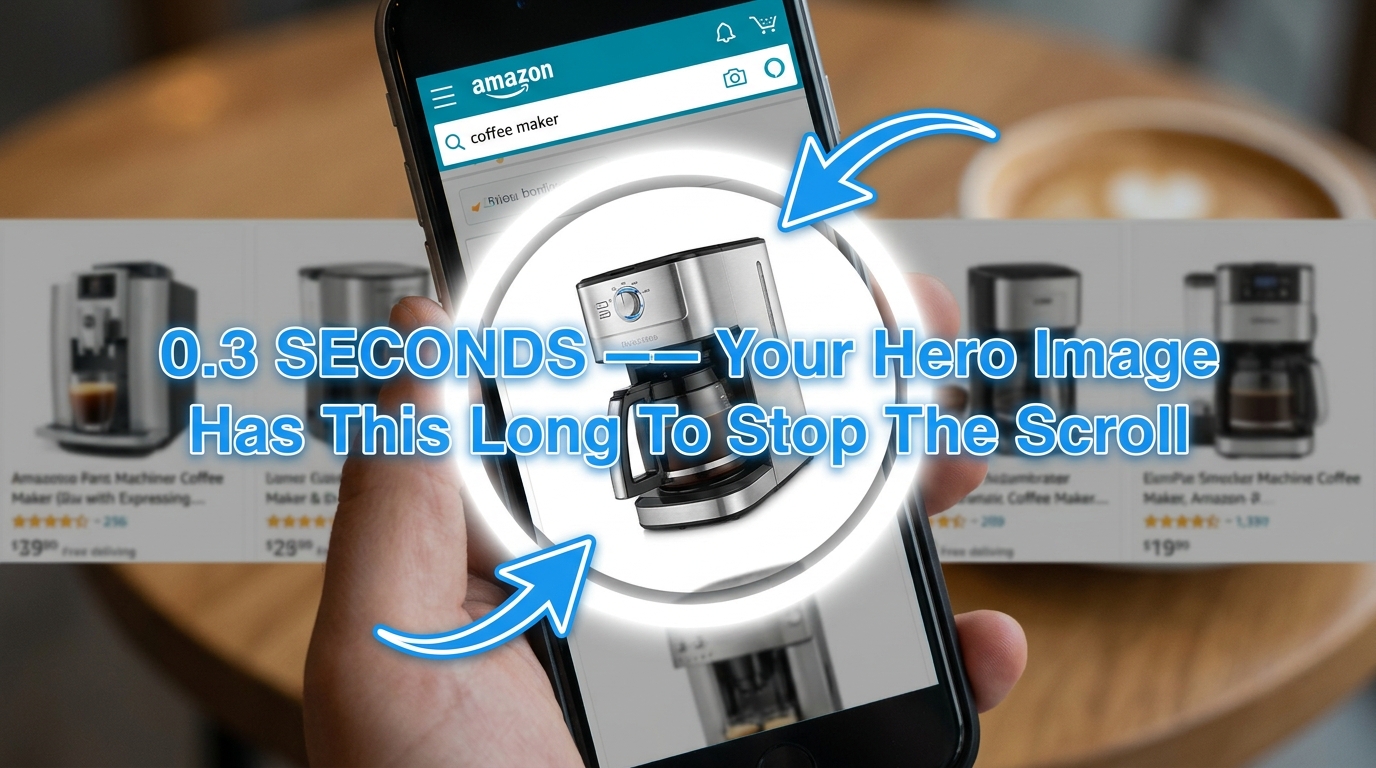
If SBV is a search result, frame one is its thumbnail. For many shoppers who scroll past, the opening second is all they’ll see. That makes the first frame the most valuable real estate in your creative, and it’s the part most often wasted.
What frame one should show
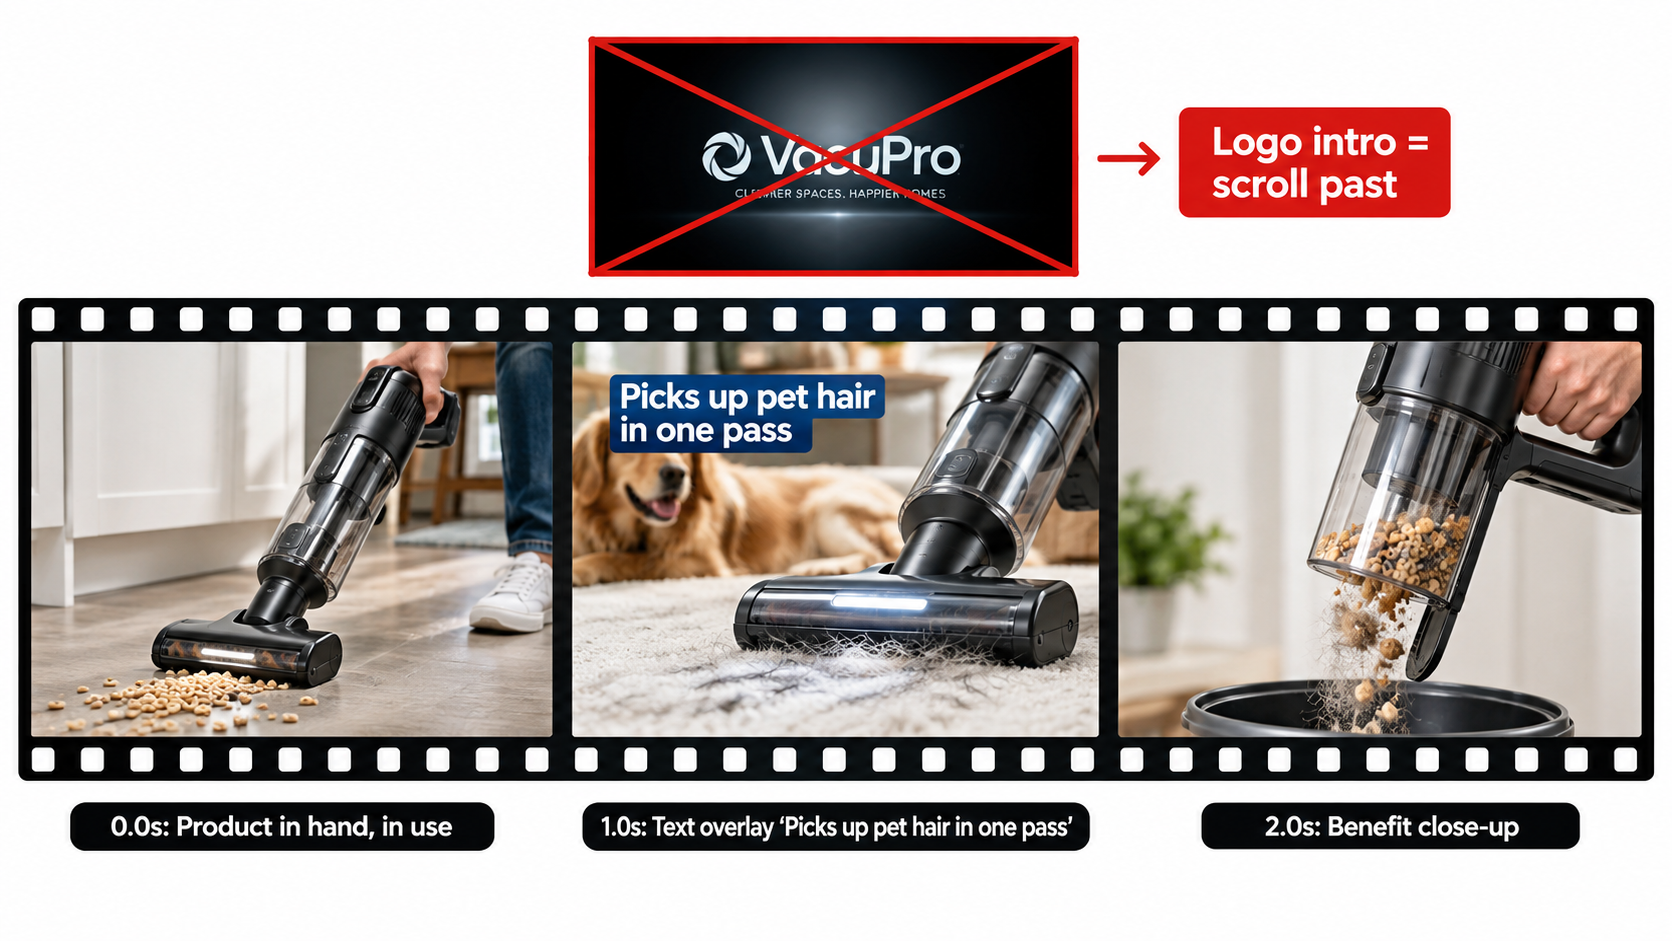
Use a simple test. Pause the video at 0.0 seconds and show the still to someone who has never seen your product. Can they say within a second what the product is and roughly why it’s useful? If not, the opening doesn’t work.
Openings that pass the test usually have these things in common:
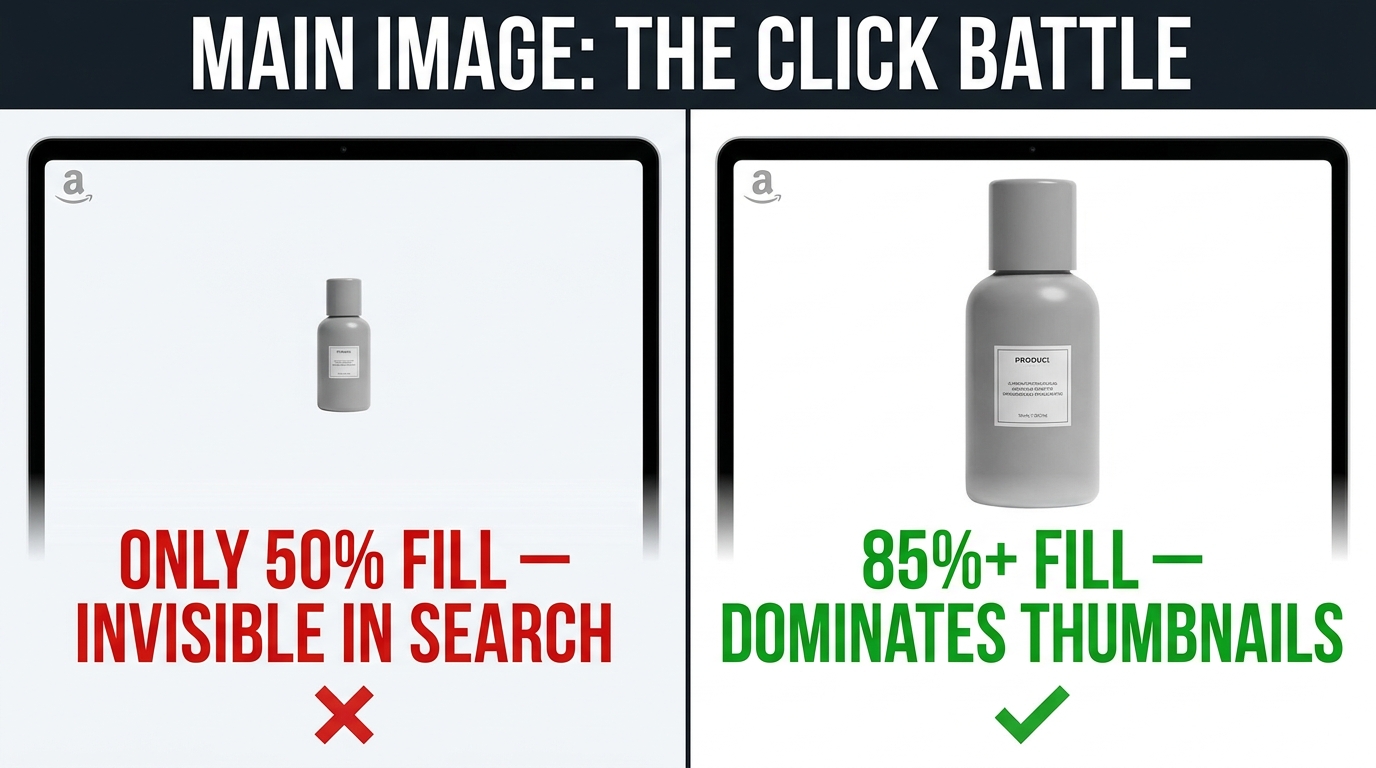
- The product is visible and fills a large part of the frame. Not a hand reaching toward something off-screen, not a wide room shot with the product in a corner.
- It’s shown in use or in context where that helps. A vacuum picking up debris explains itself faster than a vacuum on a white background.
- Contrast with the page is high. Amazon’s result pages are mostly white. Openings with strong color or clear subject separation are easier to notice in the grid.
What to cut from the opening
Some habits carried over from other video formats hurt SBV:
- Logo intros. Your brand name already appears in the ad unit. A two-second animated logo uses the most valuable seconds on information the shopper already has.
- Fade-ins from black. A black or blank first frame looks like a loading error in the grid. Amazon’s creative guidance has also pointed advertisers away from blank or black opening frames.
- Slow lifestyle build-ups. A person waking up, stretching, and making coffee before the product appears works on TV. In search, the shopper has usually scrolled on by the time the product shows up.
Structure after the opening
Once the opening has stopped the scroll, a simple structure works well for most products:
- 0–2 seconds: Product in view with the cluster’s main benefit as a text overlay.
- 2–8 seconds: Show that benefit happening, with proof you can see.
- 8–15 seconds: Two or three supporting features, each with a short overlay.
- Final seconds: A clean product shot that leads into the listing details shown in the ad unit.
Short videos tend to suit this format because shoppers are scanning, not settling in to watch. Amazon has historically accepted videos across a range of lengths, and many practitioners aim for about 15 to 30 seconds. Whatever length you choose, make sure the main point lands early. Treat the later seconds as a bonus for the few who keep watching.
Designing for the loop
Because the video may replay while on screen, a shopper who pauses on the unit can catch the opening more than once. A clean cut from the last frame back to the first reinforces the message. Endings that fade to black or linger on a logo slate make the loop feel clumsy.
Designing for Silence: Text, Captions, and Safe Zones
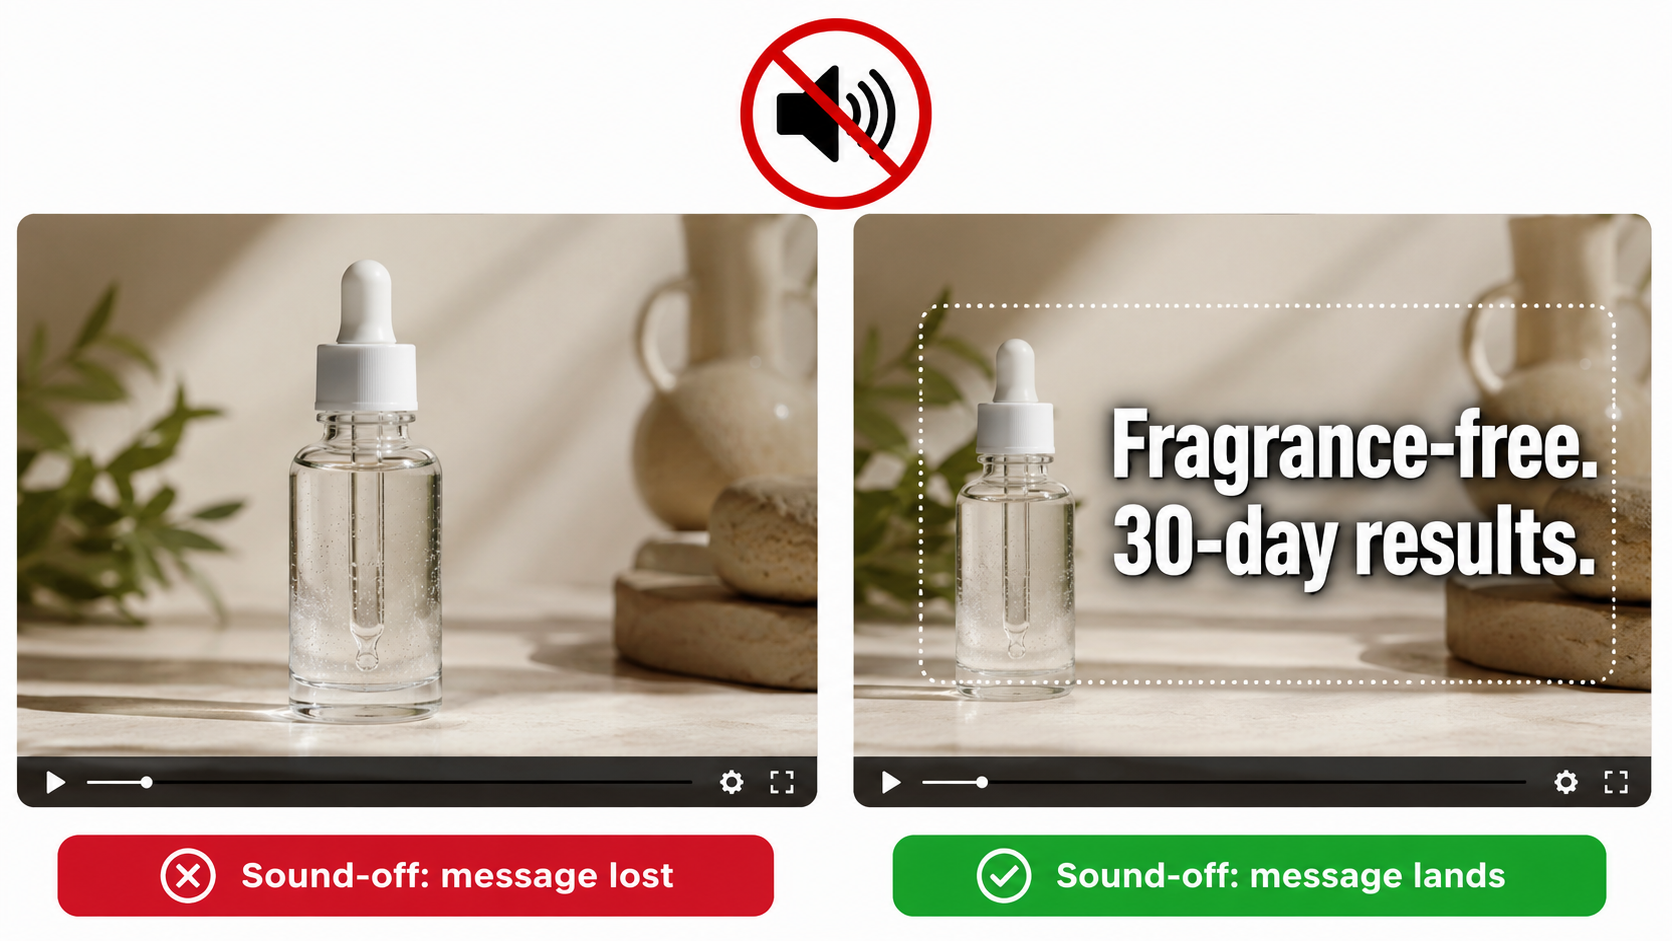
Muted autoplay is the default, so text on screen isn’t optional. For most viewers, the text overlays are the script. Treat sound as a bonus for the small share of shoppers who unmute.
The sound-off script
Write the overlay copy first and the voiceover second, if you use one at all. A good test is to watch the edit muted, at phone size, on a busy background. If you can’t follow the product story, the video isn’t ready.
Good overlay copy for SBV tends to be:
- Short. Three to seven words per card. Shoppers read overlays in a glance, not like paragraphs.
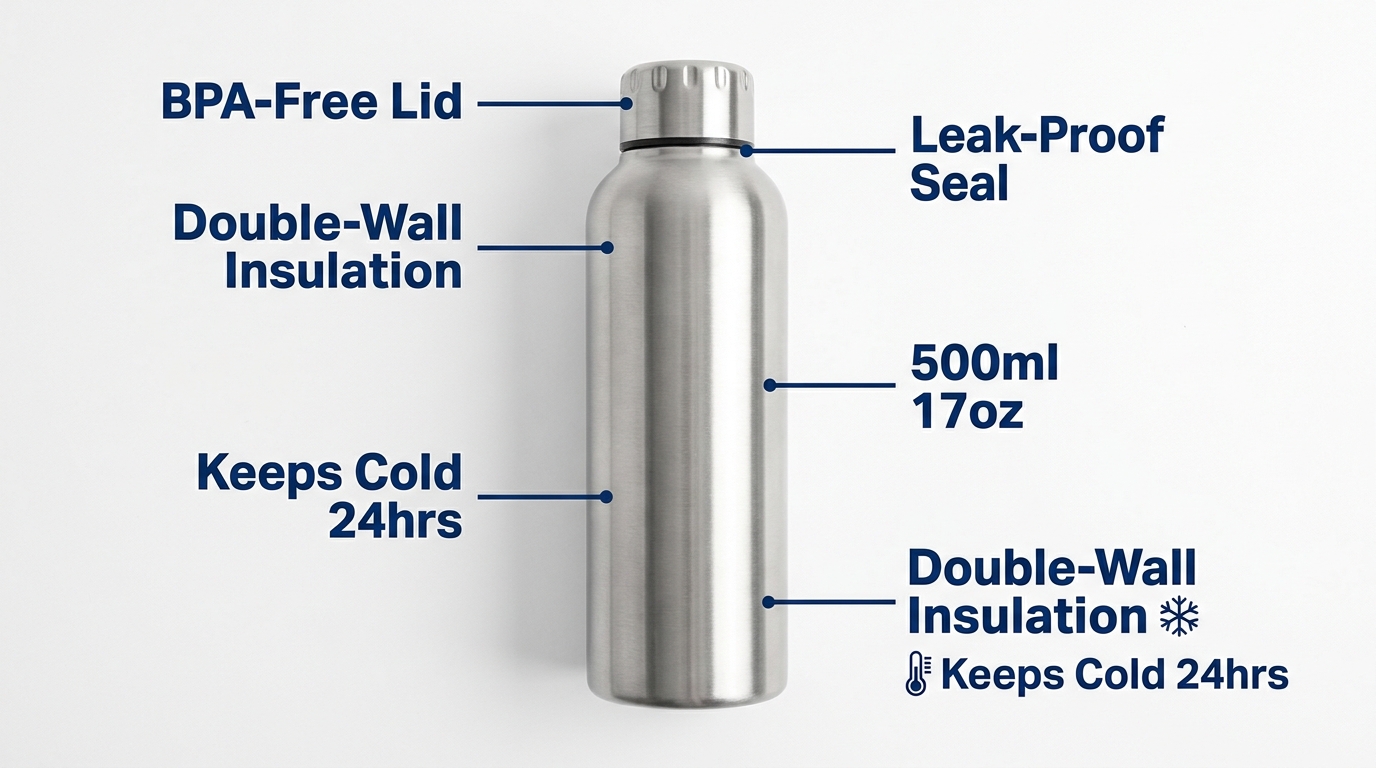
- Specific. “Holds 40 lbs” beats “Super strong.” “Dishwasher-safe lid” beats “Easy to clean.”
- Timed to the visuals. The overlay should name what the footage is showing at that moment. When text and image say the same thing, the message lands faster.
- On screen long enough. A common rule of thumb is to leave each card up long enough to read twice at a normal pace.
Legibility at small sizes
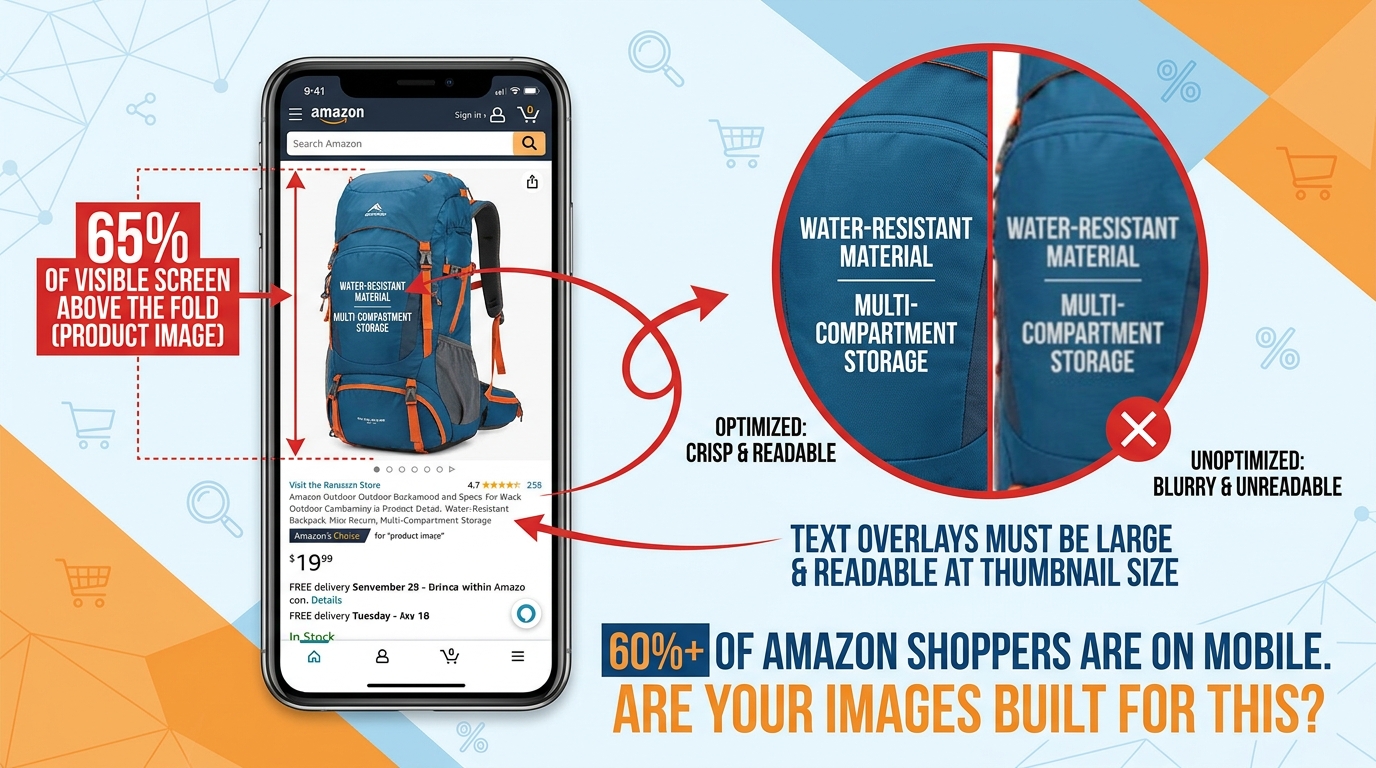
On mobile, the video unit may be only a few centimeters tall. Text that looks fine on an editing monitor can become unreadable. Use a heavy, simple sans-serif font. Keep strong contrast with a solid or semi-transparent backing bar. Avoid thin strokes and script fonts.
Amazon’s moderation has also rejected ads where on-screen text is too small, blurry, or cut off, so legibility affects approval as well as performance.
Safe zones
Parts of the video frame may be covered by interface elements or cropped differently across placements and devices. Keep key text and the product itself away from the edges, inside a central safe area. Letterboxing (black bars added to fit a different aspect ratio) looks unpolished and is typically not allowed. Shoot or reframe for the required 16:9 aspect ratio from the start rather than fixing it in the edit.
Audio still matters, but less
Audio isn’t worthless. Shoppers who unmute are showing strong interest, and a clear voiceover can help close the sale. Just make sure the audio supports the overlays and doesn’t carry information they leave out. Keep music unobtrusive and properly licensed. Rights problems with music are a practical risk for any brand running ads at scale.
Specs and Moderation: Why Good Videos Get Rejected
A strong video that sits in moderation review, or gets rejected, earns nothing. Much of the SBV frustration sellers talk about comes from preventable rejections. Building to spec and policy from the brief stage saves weeks.
Technical specs to plan around
Amazon publishes a Sponsored Brands video spec sheet, and it gets updated. Historically the main requirements have included:
- Aspect ratio: 16:9.
- Resolution: HD minimum (1280×720), with 1920×1080 or higher preferred.
- Length: A set range of seconds. Amazon has generally allowed videos from a few seconds up to around 45 seconds for this format.
- File type and size: Common formats such as MP4 or MOV, with a maximum file size.
- Frame rate and audio: Standard frame rates and audio sampling requirements.
Always confirm current specs in the Amazon Ads console or the official spec page before you export. Building to outdated specs is a common and avoidable delay.
Common content-policy problems
Moderation rejections usually come from content, not technical specs. Areas that often cause trouble include:
- Unsupported claims. Superlatives like “#1,” “best,” or “clinically proven” typically need substantiation Amazon can verify, or they get flagged.
- Time-sensitive or pricing messages. Text such as “Sale ends Friday” or specific discount claims can go out of date and create policy problems. Let the ad unit handle price.
- Customer review quotes and star graphics. Showing reviews or ratings inside the creative is restricted and is a frequent reason for rejection.
- Off-Amazon references. URLs, social handles, or “visit our website” calls to action conflict with the ad’s purpose on Amazon.
- Mismatch with the advertised product. The video must clearly relate to the ASIN or products being advertised. Showing a different model, variant, or bundle than the one linked can trigger rejection.
- Quality issues. Blurry footage, black frames, clipped text, or poor audio can all lead to rejection.
- Restricted categories. Some product categories face extra rules or need additional approvals.
A pre-submission checklist
Before uploading, check the edit against a short list:
- Is the advertised product clearly visible and the same variant that’s linked?
- Can every claim on screen be backed by documentation?
- Is there any pricing, dates, review content, or off-Amazon reference?
- Does the first frame show content (not black or blank)?
- Is all text legible at phone size and inside safe margins?
- Do the file specs match the current console requirements?
Keep a log of every rejection and the reason Amazon gives. Over time, that log becomes your brand’s internal guide to what passes, and it will speed up future production a lot.
Choosing the Destination: Detail Page or Brand Store?
Where a click goes affects conversion rate, the shopper’s experience, and how you measure performance. Many brands pick a destination by default. It should be a deliberate choice for each cluster.
When the detail page makes sense
Sending clicks straight to a product detail page is the most direct path to purchase. It fits when:
- The search intent is specific and one product clearly answers it.
- The product has a strong rating, good review count, and competitive price.
- You’re measuring against a return-on-ad-spend or cost-of-sale goal and need clean attribution to one ASIN.
For most problem-led and specific category clusters, the detail page is the natural destination. The video promises a solution, and the product page delivers it.
When the Brand Store makes sense
Amazon notes that Sponsored Brands can drive traffic to your Brand Store and that, “paired with Brand Stores,” the product supports discovery and longer-term engagement. A Store destination fits when:
- The search is broad (for example, “camping gear”) and a range of products fits better than one.
- Your products come in sizes, bundles, or complementary items that shoppers benefit from comparing.
- You want to build brand familiarity and repeat purchases, not just a single sale.
The risk is friction. A shopper who expected one product and lands on a busy Store page may leave. If you use a Store destination, send clicks to a focused subpage that matches the video’s message, not your Store homepage.
Match the destination to the promise
The rule is simple: the first thing the shopper sees after clicking should continue what the video promised. If the video leads with “fits under a 26-inch desk,” the landing page should make that dimension easy to find, ideally in the main image or first bullet. A mismatch between ad and landing page quietly drags down conversion, and it’s easy to miss because each piece looks fine on its own.
Measurement differences
Detail page traffic makes attribution easier because sales tie back to a specific product. Store traffic spreads sales across several ASINs and sometimes across longer consideration windows. When you compare the two, look beyond immediate cost of sale. Include new-to-brand orders and the mix of products bought, or Store campaigns will look worse than they really are.
Campaign Architecture and Bidding for Video
Creative gets the attention, but campaign structure decides whether the right video shows for the right search at a sensible cost. The intent-cluster principle should guide structure as well as creative.
Keyword targeting
Keyword-targeted SBV campaigns are the natural home for cluster-matched videos. A setup that works for many brands:
- One campaign per cluster, each with its matching video.
- Exact and phrase match for high-converting core terms, so relevance stays tight.
- Broad match in a separate, lower-bid campaign to find new terms. Move winning terms into the exact-match cluster campaigns.
- Negative keywords to stop clusters overlapping, so the back-pain video doesn’t compete with the small-space video on the same search.
Product targeting
Product targeting puts your video on competitor or complementary product pages. This is where the “competitor cluster” video belongs. On a rival’s detail page, your opening should state a clear, supportable difference, such as a larger capacity, a longer warranty, or a feature they don’t have, without naming or disparaging the competitor in ways policy doesn’t allow.
Targeting your own product pages is a defensive option too. It keeps competitor ads off your listings and can steer shoppers toward bundles or higher-tier versions.
Bidding considerations
SBV has historically been bought mostly on a cost-per-click basis, and Amazon has added impression-based (vCPM) buying for some Sponsored Brands goals focused on awareness and reach. Choose the model that fits the job:
- CPC for performance-focused cluster campaigns, where you pay for shoppers who show intent by clicking.
- Impression-based buying for reach or share-of-voice goals, where being seen on key searches matters as much as the click.
Amazon also offers Sponsored Brands reserve share of voice, which lets brands secure top-of-search visibility. That fits big launches or peak seasons better than everyday campaigns.
Budget separation
Keep SBV budgets separate from Sponsored Products and static Sponsored Brands. Video usually has different click-through and conversion patterns. If budgets are pooled, a strong Sponsored Products campaign can hide a weak video, or the other way around, and you lose the ability to judge each fairly.
Reading the Metrics: What Tells You the Creative Is Working
SBV gives you more diagnostic data than static ads do, because you can see how shoppers interacted with the video before clicking. Most advertisers look only at cost of sale and ignore the rest. That leaves them unable to tell a creative problem from a targeting problem or a listing problem.
The video funnel
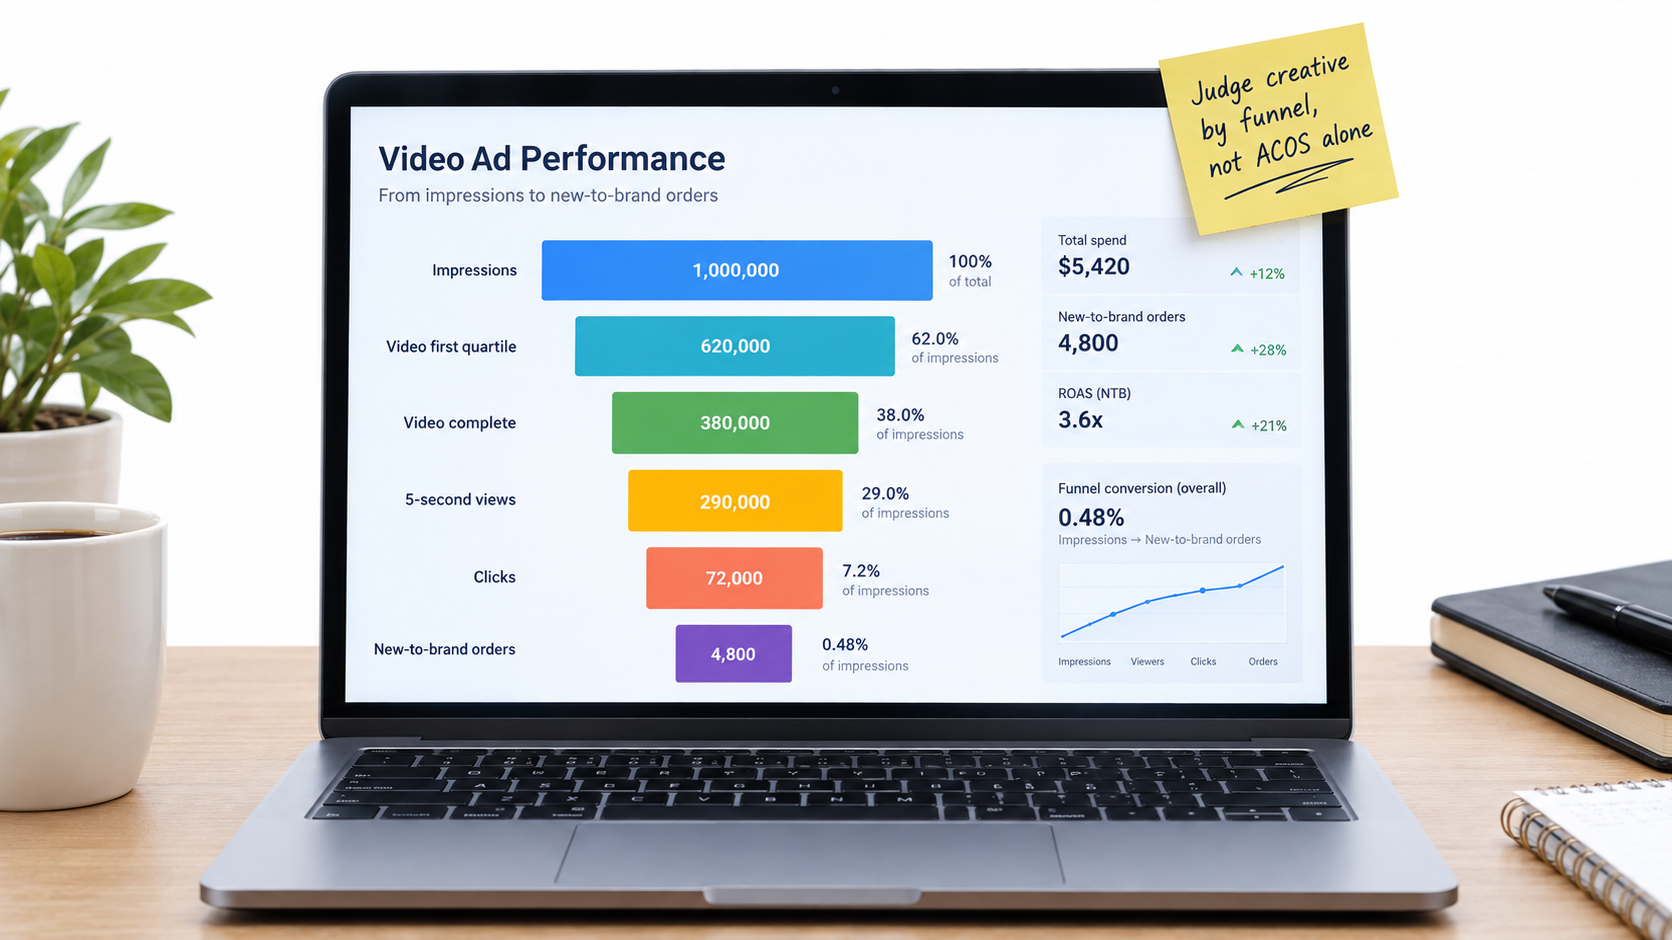
Sponsored Brands video reporting includes metrics such as:
- Impressions and viewable impressions: How often the ad loaded and how often it was actually on screen.
- Video quartile views: How many views reached 25%, 50%, 75%, and 100% of the video.
- 5-second views and 5-second view rate: How many shoppers watched at least five seconds, a useful signal that the opening held attention.
- Video unmutes: How many shoppers turned the sound on, a sign of strong interest.
- Clicks and click-through rate: Whether attention turned into action.
- New-to-brand orders and sales: Purchases from customers who hadn’t bought from your brand recently.
Metric names and availability can change, so check your console’s reporting columns.
Diagnosing problems stage by stage
Read the funnel in order. Where it drops off tells you what to fix:
- Low 5-second view rate: The opening isn’t stopping the scroll. Rework frame one and the first overlay.
- Good early views, sharp drop by midpoint: The middle section is slow or repetitive. Tighten the edit or shorten the video.
- Healthy views, low CTR: The video holds attention but doesn’t prompt action. The message may be interesting but not relevant to the search, or the listing signals next to it (price, rating) may be putting shoppers off.
- Good CTR, weak conversion: The problem is probably after the click, such as a mismatched landing page, weak listing content, or pricing. Changing the creative won’t fix that.
Beyond cost of sale
Judging SBV only on advertising cost of sale (ACOS) can undervalue it. Video often reaches shoppers earlier in their decision and brings in customers new to the brand. New-to-brand metrics help show that. If a video campaign has a slightly higher ACOS but a much higher share of new-to-brand orders, it may be building future repeat sales that a narrow ACOS view misses.
Branded search volume is another useful signal to watch. If searches for your brand name rise after you scale video, the ads are likely building awareness even when direct attribution looks modest.
Give tests enough data
Video metrics bounce around at low volume. Don’t pause a video after a few hundred impressions. Set a minimum threshold, such as a set number of clicks or a set spend per variant, before deciding. Compare variants within the same cluster and time period so seasonality and targeting don’t skew the results.
Testing Cadence and the Economics of Production
The cluster approach means more videos. That raises a fair question: how do you produce enough variants without a big budget? The answer is to rethink how you produce video, not to lower the quality bar.
Build a modular footage library
Rather than commissioning finished videos one by one, shoot a library of modular clips in a single session:
- Several opening shots, each showing a different benefit or use case.
- Close-ups of each major feature in action.
- Context shots showing the product in different settings and with different users.
- Clean closing product shots.
From one library, an editor can put together many cluster-specific versions by swapping openings and overlays. The cost of each extra variant drops sharply once the library exists.
Use Amazon’s creative tools where they fit
Amazon Ads now offers AI-powered creative tools in the console. The Sponsored Brands page, for example, highlights free AI image generation for branded creatives, and Amazon has added video generation tools as well. These can be useful for quick tests, seasonal refreshes, or smaller brands without production budgets. Treat AI-generated output like any other creative. Check it against the frame-one test, the silent-viewing test, and moderation policies before launch.
A sensible testing cadence
A workable rhythm for many brands looks like this:
- Launch: Two openings per top cluster, same body footage, run side by side.
- First review: Once each variant passes your data threshold, compare 5-second view rate and CTR. Keep the winner.
- Iterate: Test a new challenger against the winner, changing one thing at a time, such as the opening shot, the first overlay, or the length.
- Refresh: Watch for creative fatigue. If a proven video’s performance slips over time with steady targeting, bring in a new variant.
Change one thing at a time
If you change the opening, overlays, music, and length together, you won’t know what caused a result. Disciplined, single-variable tests build knowledge you can reuse across products. After a few rounds, you’ll learn patterns specific to your category, such as whether in-use openings beat close-up openings or whether numbers in overlays beat descriptive words.
What the Published Case Studies Actually Show
Amazon publishes Sponsored Brands case studies, and they’re worth reading carefully: for what they report, and for what they don’t.
HP: reach and clicks across a broad catalog
Amazon reports that HP, using Sponsored Brands video together with Sponsored Brands, Sponsored Products, and display ads, saw impressions grow 224% year over year and clicks rise 142% year over year. That included a 42% increase in clicks for Sponsored Brands video placements.
The takeaway is that video worked as part of a combined program, not alone. HP ran video alongside other sponsored ad types, so the results reflect a coordinated approach. For most brands, the lesson is to treat SBV as one layer in a full-funnel plan, not as a stand-alone fix.
Loftie: efficiency for a small business
Amazon’s case study on Loftie, described as a small business, reports a sponsored ads campaign with a return on ad spend of $5.66 and an advertising cost of sale of 17.68%. Those figures show that sponsored ads, Sponsored Brands included, can deliver efficient returns for smaller brands, not just large enterprises.
NF Imports: long-term brand building
Amazon also highlights NF Imports, a brand in Japan that has used sponsored ads since 2015. Amazon reports that 80% of its sales came from new customers over a multi-year period and that sales grew 30% across the period studied. The pattern is consistent use over years, not short bursts.
How to read case studies sensibly
Case studies are chosen to show success. They don’t tell you the median result, and they rarely break down which creative choices drove the numbers. Use them as evidence of what’s possible and as clues about structure. The recurring themes are combined ad types, consistent investment, and attention to new customers. Don’t treat them as benchmarks your campaigns should hit.
Your own data, gathered through disciplined cluster-based testing, is a far better guide than any published case study. The playbook in this article is built to help you produce that data quickly.
Putting It Together: A Practical SBV Workflow
Here is the approach condensed into a workflow you can run for each product line.
Step 1: Research
Pull search term and search query data. Group terms into intent clusters and rank them by volume and conversion. Pick the top two or three clusters.
Step 2: Brief
For each cluster, write the one-sentence answer to the shopper’s question. Define the opening shot and first overlay. Note any claims that need documentation.
Step 3: Produce
Shoot a modular library in one session. Edit cluster versions by swapping openings and overlays. Check every cut against the frame-one test, the silent-viewing test, current specs, and moderation policies.
Step 4: Structure
Build one campaign per cluster with tight match types and cross-cluster negatives. Choose the destination (detail page or focused Store subpage) based on the video’s promise. Keep video budgets separate.
Step 5: Measure
Read the full funnel: 5-second view rate, quartile completion, CTR, conversion, and new-to-brand share. Find where the drop-off happens and fix that stage.
Step 6: Iterate
Run single-variable tests against the current winner. Refresh when performance fades. Keep a rejection log and a learnings log that the whole team can use.
Conclusion: Win the Search, Not the Screening
The brands that get the most from Sponsored Brands video aren’t necessarily the ones with the biggest production budgets. They’re the ones that understand where their video plays: muted, among competing results, in front of a shopper who just said exactly what they want.
That understanding changes almost every decision. It moves the product into the first frame. It turns text overlays into the main script. It splits one hero video into several cluster-matched versions. It links each video to a landing page that continues its promise. And it replaces a single cost-of-sale number with a funnel that shows where things are going wrong.
Key takeaways to act on:
- Treat SBV as a search result. Build each video to answer a specific set of searches better than the listings around it.
- Map videos to intent clusters. Start with your two or three highest-value clusters and give each its own opening and overlays.
- Pass the frame-one test. Product visible, benefit clear, no logo intro, no black frames.
- Design for silence. Write overlays first, keep them short and specific, and make them readable at phone size.
- Prevent rejections early. Check claims, pricing, reviews, off-Amazon references, and current specs before export.
- Match destination to promise. Use detail pages for specific intent and focused Store pages for broad intent.
- Read the whole funnel. Use 5-second views, quartiles, CTR, and new-to-brand data to find the real bottleneck.
- Test one variable at a time. Build a modular footage library so variants are cheap to make.
Specs, formats, and policies on Amazon will keep changing through 2026 and beyond. The underlying logic won’t: a shopper scanning search results rewards the ad that answers the query fastest. Build your videos to be that answer, and the format works for you rather than against you.