Tag: amazon brand registry

  • The First Two Seconds: A Frame-by-Frame Approach to Amazon Sponsored Brands Video

    The First Two Seconds: A Frame-by-Frame Approach to Amazon Sponsored Brands Video

    Most Amazon sellers treat Sponsored Brands video as a production problem. They hire a videographer, film a polished 30-second clip, upload it, and wait. When results stall, they blame the bid, the keyword list, or the algorithm.

    The real problem usually shows up much earlier. It sits in the first two seconds of the video, while a shopper is scrolling a search results page on their phone with the sound off. That’s where Sponsored Brands video (SBV) campaigns are won or lost. Everything after that moment only matters if the opening frames did their job.

    This article approaches Sponsored Brands video from a different angle than most guides. It isn’t a campaign setup walkthrough or a list of general tips. It’s a frame-by-frame look at how SBV creative actually gets consumed on Amazon. It covers how placement shapes what your video needs to say, how to storyboard for muted autoplay, which metrics tell you where viewers drop off, and how to run a testing cycle that keeps creative fresh without burning budget.

    The stakes are real. Amazon’s own case studies show what well-executed video can do. HP, running Sponsored Brands video alongside Sponsored Brands, Sponsored Products, and display ads, reported a 224% year-over-year increase in impressions and a 142% increase in clicks, including a 42% increase in clicks specifically on Sponsored Brands video placements, according to Amazon Ads. Smaller brands have seen results too. Sleep-tech company Loftie reported a ROAS of $5.66 and an ACOS of 17.68% on a sponsored ads program with Amazon Ads.

    Those results didn’t come from uploading any video and hoping for the best. They came from creative that fits the way shoppers actually see it. Let’s break down what that means in practice.
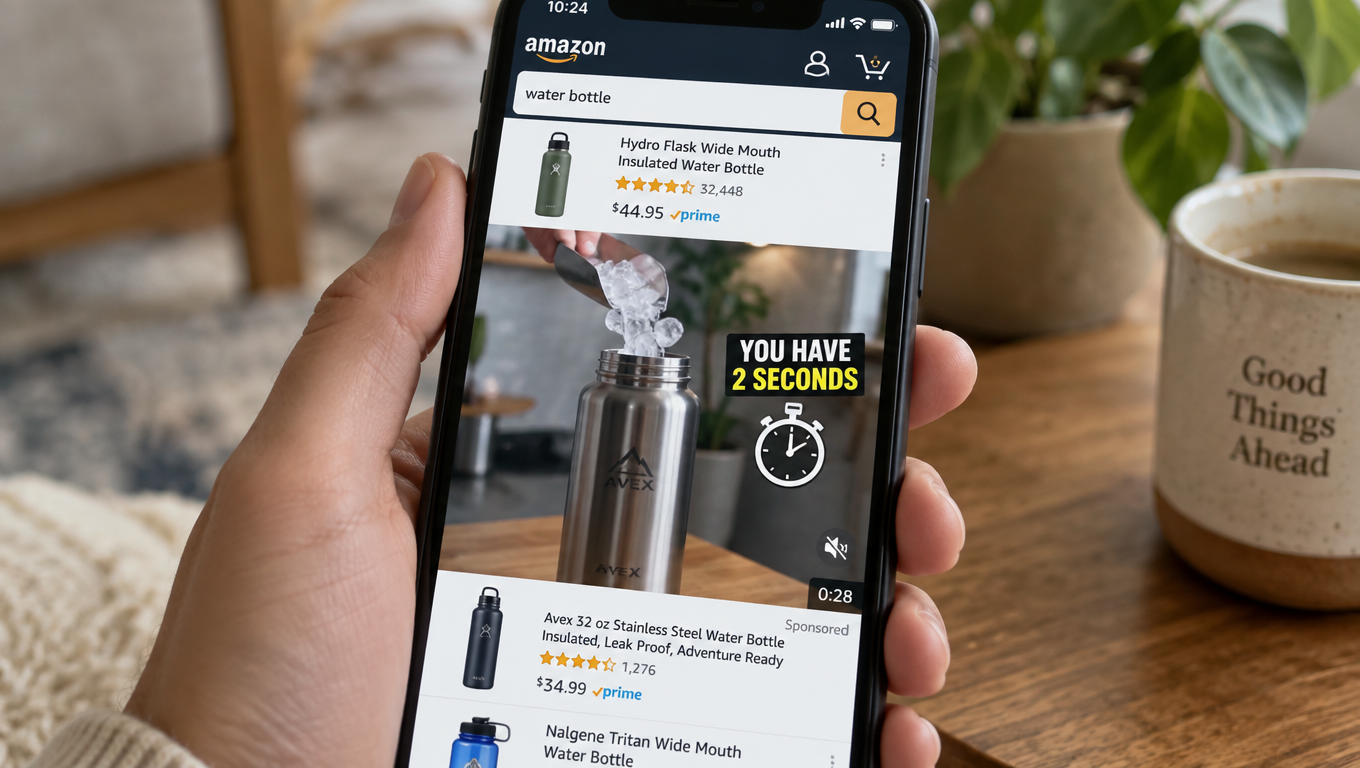
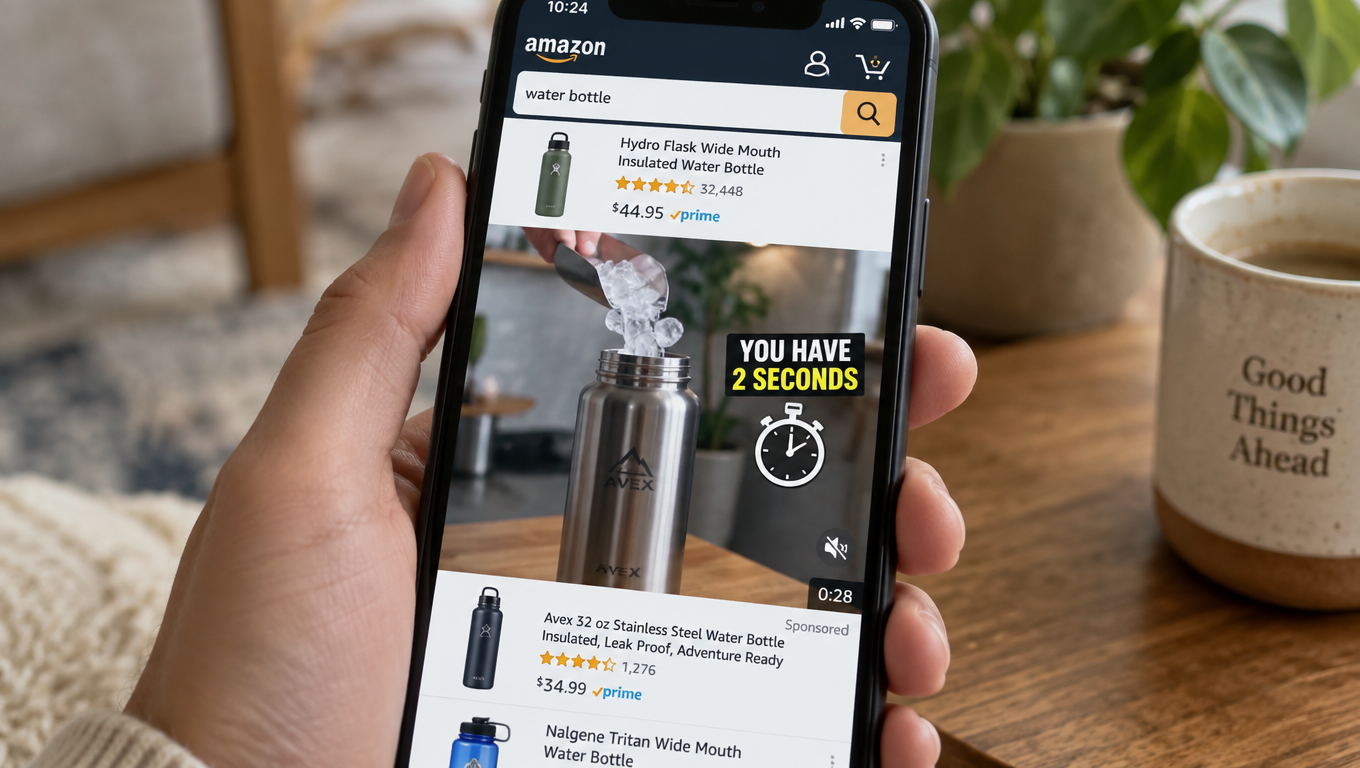
    Shopper scrolling Amazon search results on a phone with a muted autoplaying Sponsored Brands video ad and a 'You have 2 seconds' overlay

    Why Sponsored Brands Video Is a Different Animal from Other Amazon Ads

    Sponsored Products ads borrow the look of an organic listing. A shopper sees a main image, a title, a price, star ratings, and a small “Sponsored” label. The ad works because it blends in.

    Sponsored Brands video works for the opposite reason. It stands out. It’s the only moving element on a page full of static thumbnails, and it autoplays as soon as it scrolls into view. That’s a big advantage for grabbing attention. It’s also a liability if the motion doesn’t communicate anything useful.

    What Amazon says the format is for

    Amazon Ads describes Sponsored Brands as a solution “built to help customers discover your brand within the Amazon store,” with “rich display and video creatives that put your brand front and center.” It calls Sponsored Brands video “a powerful storytelling tool for brands to initiate, cultivate, and maintain relationships with shoppers.”

    That framing matters. Amazon positions SBV as a discovery and consideration format first and a conversion format second. In practice, it does both. But if you judge it only on the same ACOS target you use for exact-match Sponsored Products campaigns, you’ll likely underfund it or shut it off too soon.

    The eligibility gate

    Sponsored Brands, including video, is available to sellers enrolled in Amazon Brand Registry, as well as vendors and agencies that work with them. If you’re not brand-registered, this format isn’t available to you. That’s one reason SBV placements tend to be less crowded than Sponsored Products in many categories: fewer advertisers are eligible to compete for them.

    Three structural differences that change your approach

    • Motion creates attention, not persuasion. Autoplay gets eyes on the ad. The content still has to earn the click.
    • Video is usually watched muted. Amazon autoplays SBV without sound in search results. Unless a shopper actively taps to unmute, your audio track does nothing.
    • The ad sits beside competitors’ static listings. Shoppers compare your video against the products around it in real time. Your first frames are competing with price tags and star ratings a few pixels away.

    Each of these differences leads to a specific creative decision, which the rest of this article covers.

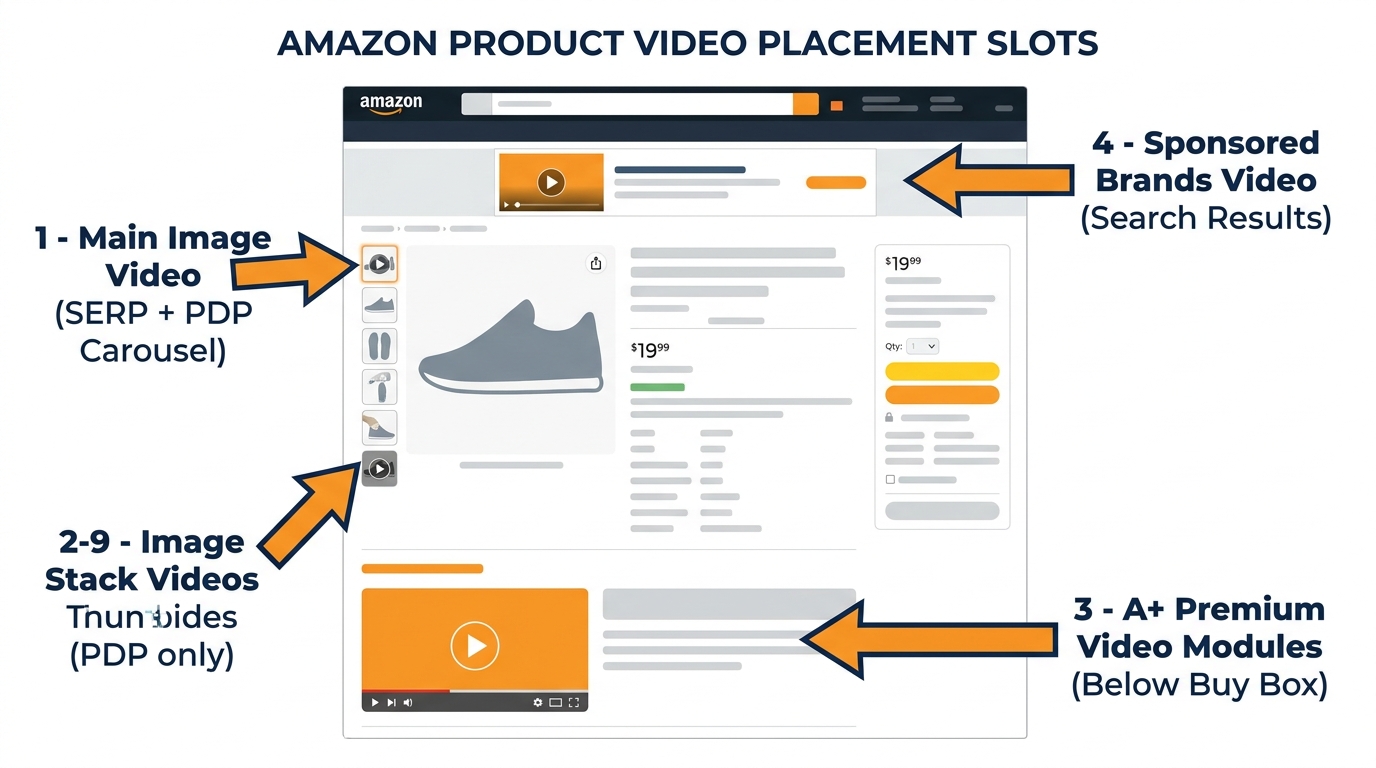
    Placement Dictates Creative: Where SBV Actually Appears

    According to Amazon Ads, Sponsored Brands creatives “appear in prominent placements like top of search and product pages,” and may be shown “above, alongside, or within shopping results” on desktop and mobile. For video specifically, that usually means three types of environments. Each puts the shopper in a different frame of mind.
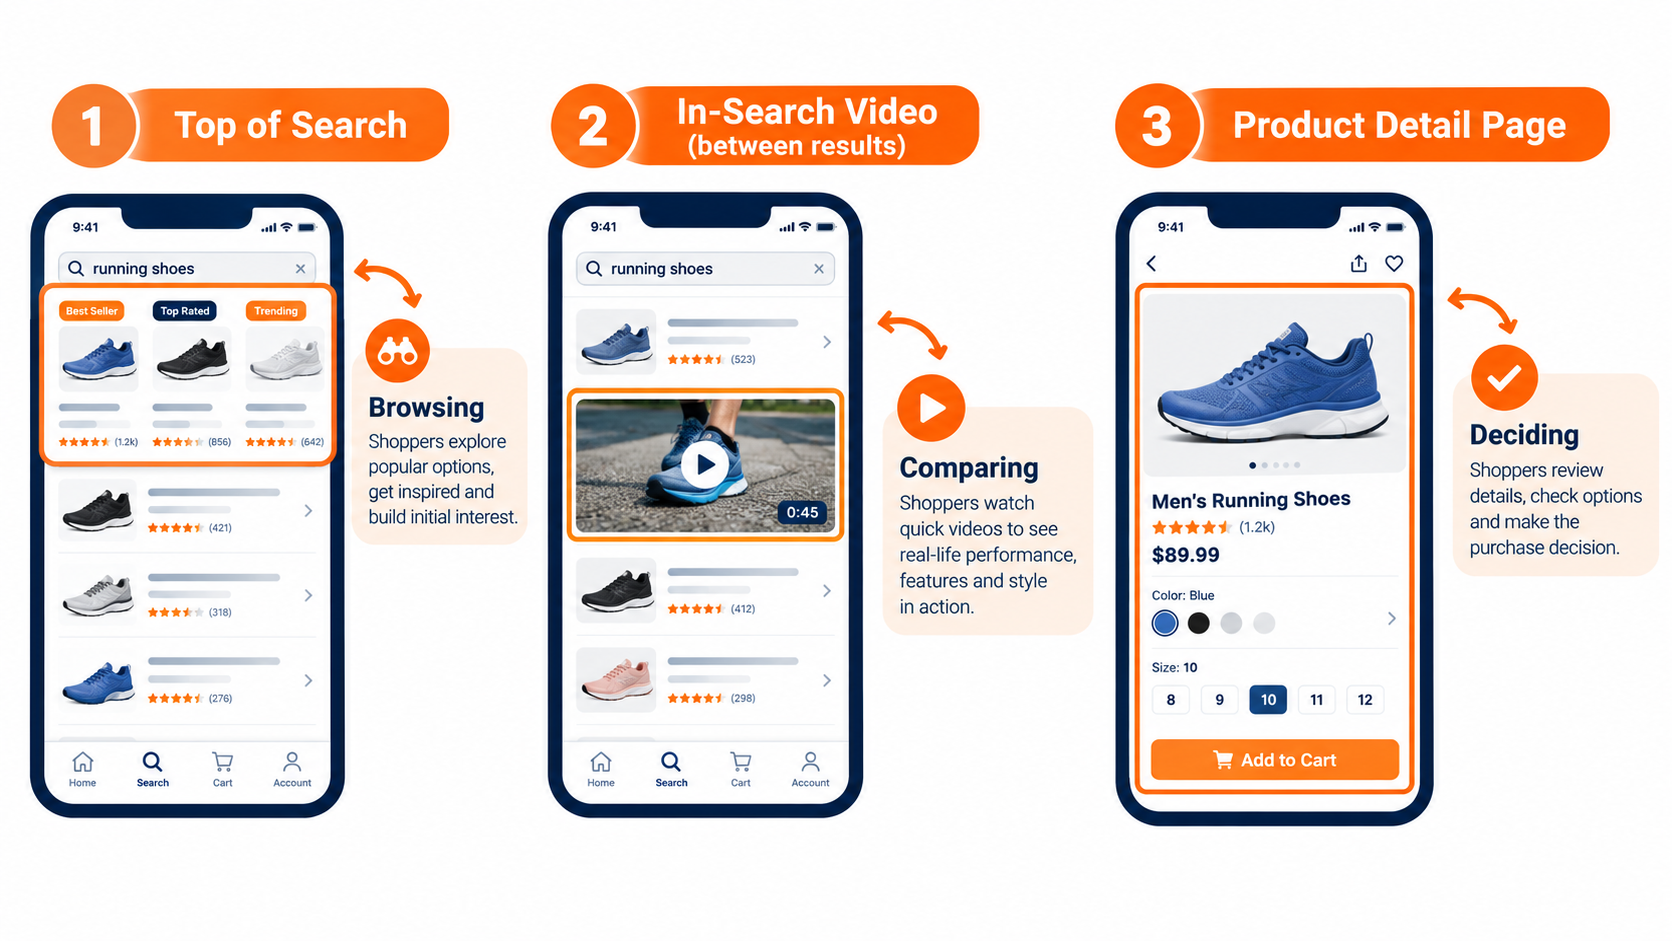
    Diagram of Sponsored Brands video placements: top of search, in-search video between results, and product detail page, each matched to a shopper mindset

    In-search placements: the browsing mindset

    The most familiar SBV placement is the video unit that appears between rows of search results. The shopper has typed a query, such as “insulated water bottle,” and is scanning options. They haven’t decided anything yet.

    Here, your video’s job is to answer one question quickly: why should I stop scrolling for this one? A clear visual of the product in use, paired with one distinguishing claim, usually beats a brand story. The shopper isn’t interested in your founding story at this stage. They want to know whether this product is different from the eight others on the screen.

    Top-of-search placements: the first impression

    When video appears at or near the top of results, it’s often the first thing a shopper sees after searching. That position carries weight because it frames how the shopper reads everything below it. If your video sets the standard, such as “this is what a leak-proof lid should look like,” competing listings get judged against it.

    Top-of-search visibility is valuable enough that Amazon offers a reserve share of voice option for Sponsored Brands. Brands can use it to secure top-of-search visibility for chosen keywords. For launches or seasonal peaks, that can be worth exploring. It’s a premium tactic, though, and should come after you’ve proven your creative works.

    Product detail page placements: the comparison mindset

    On product pages, the shopper is already looking at a specific item, often a competitor’s. Your video is interrupting a decision that’s already underway. That calls for a different message.

    Comparison-oriented creative tends to fit here: a feature the competitor lacks, a size or capacity advantage, or a demonstration of durability. You can’t name competitors in Amazon ads, and moderation will reject disparaging claims. But you can show what your product does well in a way that invites the comparison.

    The practical takeaway

    One video rarely fits all three contexts equally well. You don’t need three fully separate productions, though. You need one set of footage cut into versions with different opening frames and on-screen text. The in-search version leads with the product in action. The detail-page version leads with the standout feature. Same shoot, different edits.

    The Muted Autoplay Constraint (and Why It’s Actually Useful)

    Because SBV autoplays silently in search, sound is optional for the viewer. That one fact rules out a large share of conventional video advertising techniques. Voiceover-driven explainers, spokesperson monologues, and music-dependent emotional builds all lose most of their meaning without audio.

    Many brands still make the mistake of repurposing a video made for YouTube, a website hero banner, or a TV spot. Those videos were designed for audio. On Amazon, they become a person silently moving their mouth next to a product.
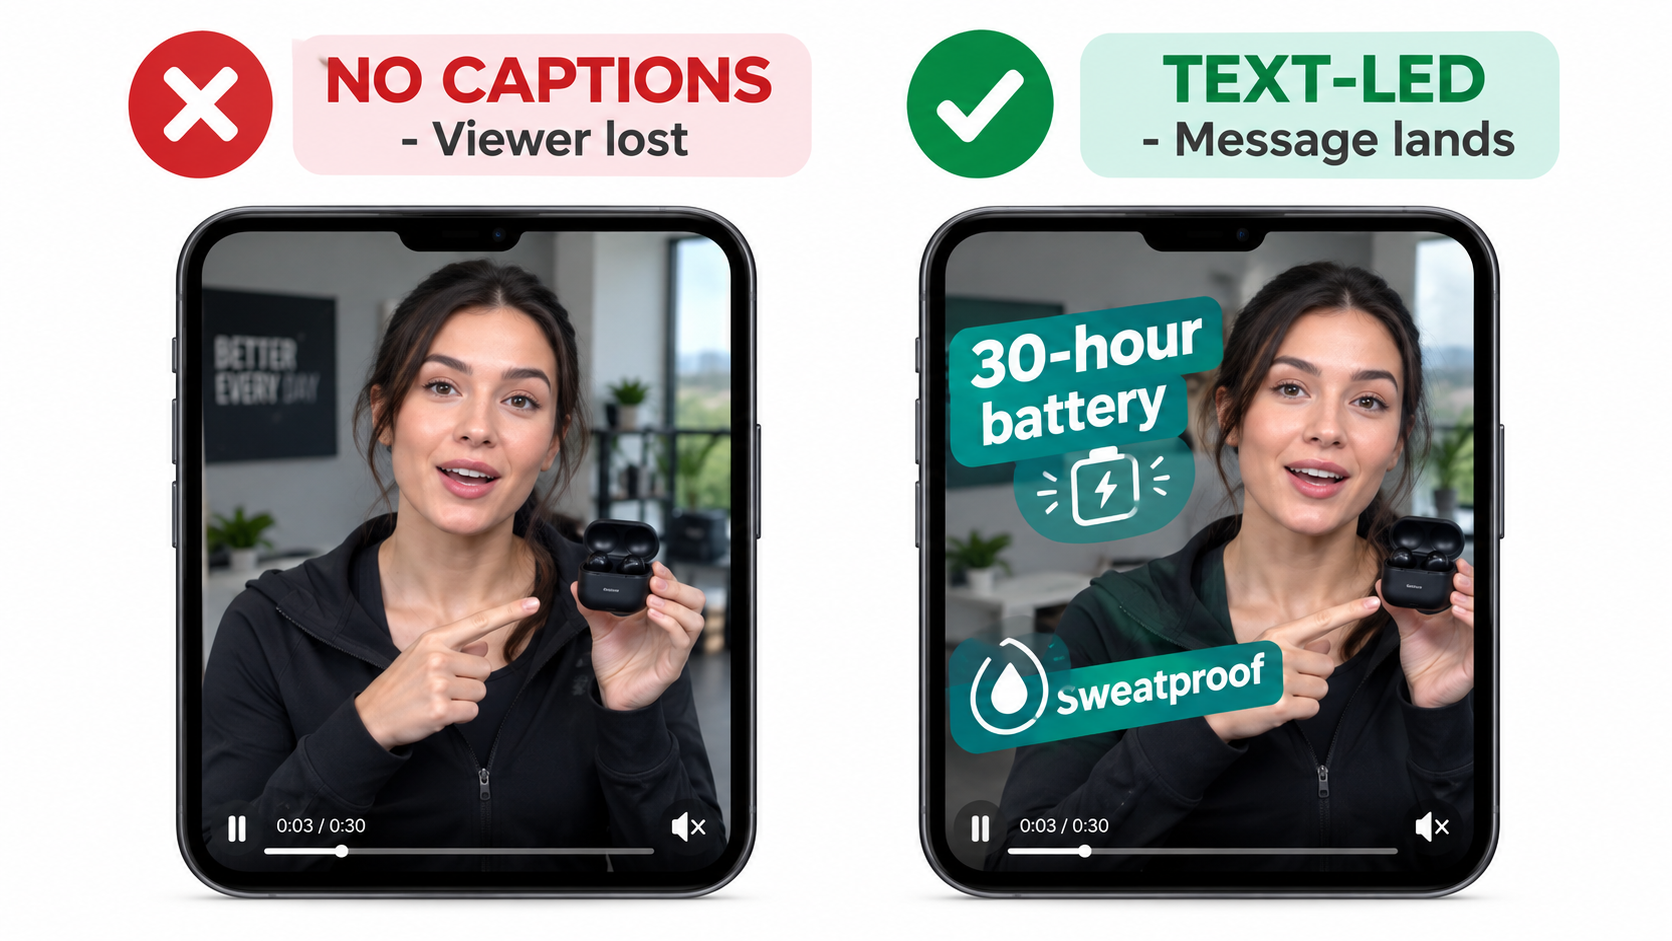
    Split-screen comparison of a muted video ad with no captions versus a text-led version with on-screen claims like 30-hour battery and sweatproof

    Design for silence first

    The fix is simple to state and harder to execute: build the video so it makes complete sense with the sound off. Then add audio as a bonus layer for the small share of viewers who unmute.

    In practice, that means:

    • On-screen text carries the message. Short phrases of three to six words, large enough to read on a phone screen, held on screen long enough to be read twice.
    • Visual demonstration replaces narration. Instead of saying “our blender crushes ice in seconds,” show ice going in and smooth liquid coming out.
    • Captions for any spoken content. If you do include a speaker, burn in captions. Don’t rely on the platform to add them.
    • Motion that tells a story. Before-and-after sequences, pouring, folding, assembling, and stress tests communicate without words.

    Why this constraint helps you

    Muted-first design forces clarity. When you can’t lean on a voiceover, you have to identify the single visual that proves your product’s value. That discipline often produces better creative than a sound-dependent script would.

    It also makes your video more reusable. A silent-first SBV cut works well in Sponsored Display video, on your Brand Store, in your listing’s video slot, and on social platforms where muted autoplay is also common. You’re producing one asset with several uses.

    A quick muted test

    Before uploading any SBV creative, watch it on your phone with the sound off at arm’s length. Then ask someone unfamiliar with the product to do the same and tell you, in one sentence, what the product is and why it’s better. If they can’t, the video isn’t ready.

    A Frame-by-Frame Storyboard for Sponsored Brands Video

    Amazon’s published guidance has generally recommended shorter videos for Sponsored Brands, with many advertisers working in the 15-to-30-second range. Whatever length you choose, the structure matters more than the runtime. Below is a four-part storyboard built around how attention actually decays in a scrolling feed.
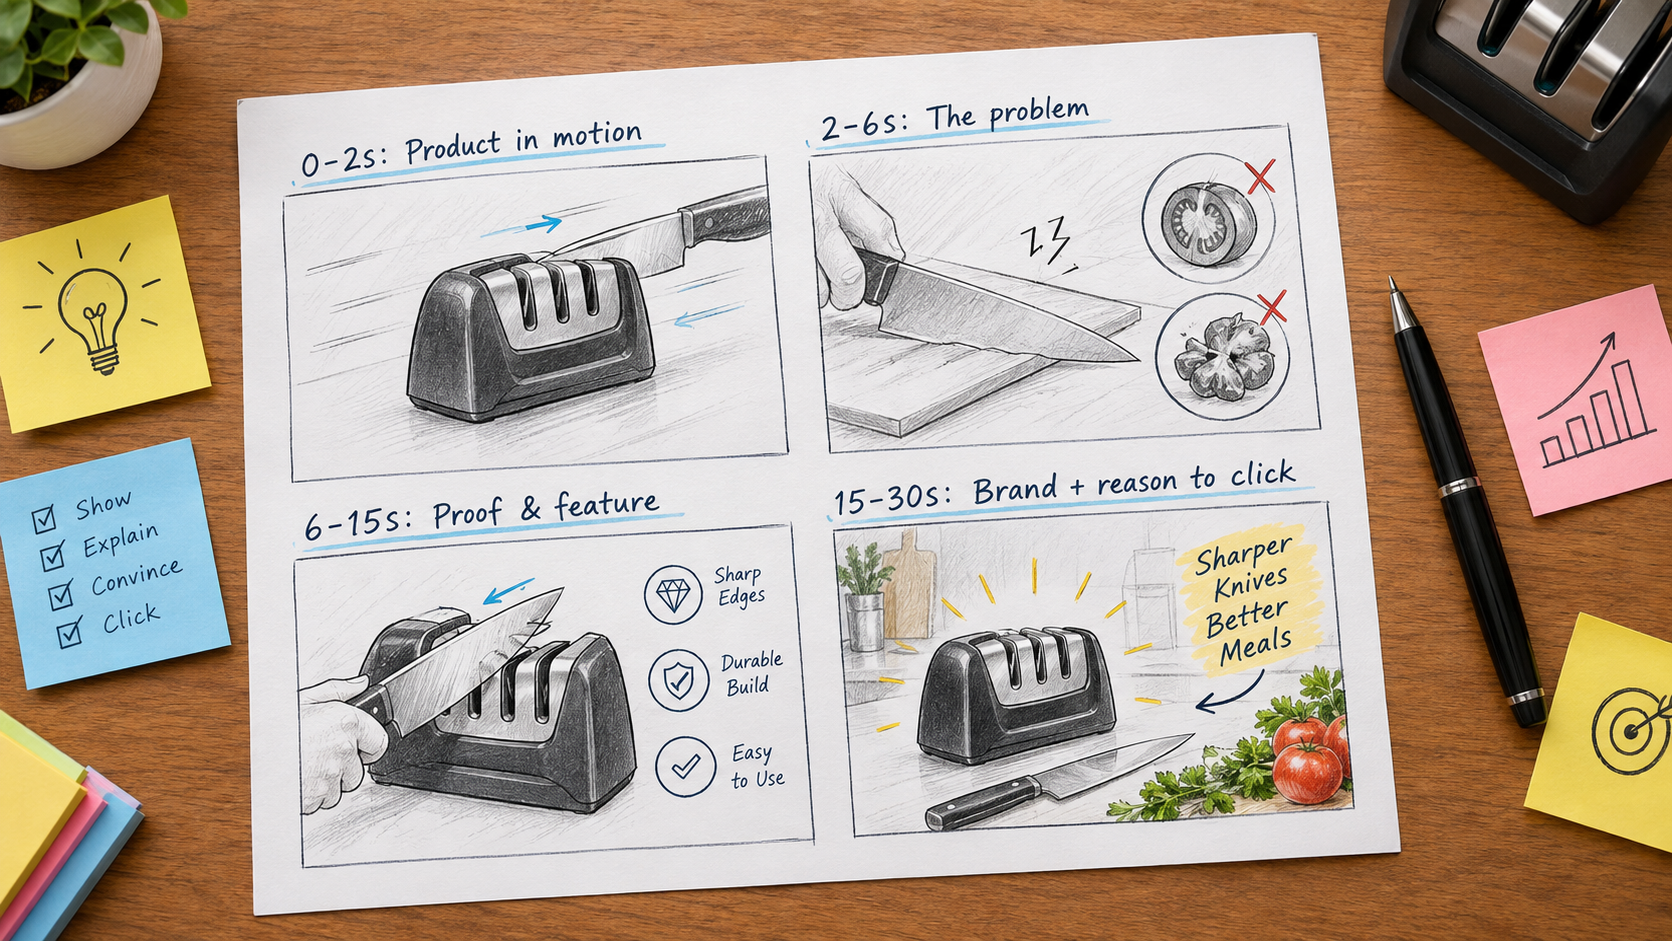
    Four-panel video storyboard for a Sponsored Brands video: product in motion, the problem, proof and feature, brand and reason to click

    Frames 0–2 seconds: the product in motion

    The opening must show the product, and it should already be moving. No logo animation, no lifestyle establishing shot, no slow fade-in from black. Those openings waste the only moment you’re guaranteed to have.

    Strong openings include the product being used mid-action, a close-up of the key feature working, or a dramatic visual contrast. Think coffee pouring into a mug that stays hot, a knife slicing a tomato cleanly, or a backpack being overstuffed and zipped shut. The shopper should recognize the product category in the first second.

    Frames 2–6 seconds: the problem or the promise

    Once you have attention, establish why it matters. This is where a short on-screen text line appears: a problem the shopper recognizes (“Tired of lukewarm coffee by 10 a.m.?”) or a clear promise (“Hot for 12 hours”).

    Keep it to one idea. Many videos try to list four features here. The viewer retains none of them. One problem, one promise, clearly shown.

    Frames 6–15 seconds: proof and differentiation

    Viewers who make it this far are interested. Now show proof. This section can hold two or three supporting features, each paired with a visual demonstration. It’s also where social proof can appear, such as a mention of awards or certifications, as long as the claims are accurate and can be substantiated for moderation.

    Avoid star ratings or review quotes unless you’ve confirmed they meet current Amazon advertising policies. Claims about reviews, pricing, and “best seller” status are common reasons for rejection.

    Frames 15–30 seconds: brand and reason to click

    The final stretch reinforces your brand and gives a reason to take action. Show the logo clearly, restate the core benefit, and if relevant, show the product range. That’s especially useful if the ad links to your Brand Store.

    Note that Amazon restricts certain call-to-action language and urgency claims in ads, so skip “Buy now, limited time!” style overlays. A simple closing frame showing the product, logo, and core benefit works well.

    Loop awareness

    SBV may loop in some placements. Design your last frame so it transitions reasonably into your first. An abrupt jump from logo card to action shot can look glitchy. A clean end frame that cuts naturally back to the product in motion keeps the loop watchable.

    Technical Specs and Moderation: Where Good Videos Get Rejected

    A strong creative concept is worthless if it doesn’t clear moderation. Amazon reviews every Sponsored Brands video before it goes live, and rejections can add days to a launch.

    Technical specifications to confirm before export

    Amazon updates its ad specs periodically, so always check the current Sponsored Brands video specification page before final export. Historically, the requirements have followed this general pattern:

    • Aspect ratio: 16:9 landscape has been the standard for SBV.
    • Resolution: HD minimum, with 1920×1080 widely used as the working standard.
    • File format: MP4 or MOV.
    • File size: A maximum limit applies (historically up to 500 MB).
    • Length: A minimum and maximum duration apply. Check the current limits, as they’ve changed over time.
    • No letterboxing or black bars, and no blank frames at the start or end.

    The common rejection triggers

    Beyond technical specs, most rejections come from content issues. Watch out for these in particular:

    • Blurry or low-quality footage. Upscaled phone clips often get flagged.
    • Unsubstantiated claims. “#1 rated,” “best on Amazon,” and “clinically proven” all require support.
    • Pricing and promotions in the video. Prices change; baked-in prices quickly become inaccurate.
    • Text that’s too small or on screen too briefly. Amazon expects on-screen text to be legible.
    • Content that doesn’t match the landing page. The product in the video should be the product shoppers land on.
    • Restricted categories and claims. Health, supplements, and personal care products face stricter review.

    Build a pre-moderation checklist

    Brands that launch video often save time with an internal checklist that mirrors Amazon’s policies. Before any upload, someone other than the editor reviews every claim, every text overlay, and the final frames. It’s a small step that prevents the most frustrating kind of delay: a rejection you could have caught yourself.

    Choosing the Destination: Product Page, Brand Store, or Multi-Product

    Where your SBV sends shoppers affects what the video should say and how you should judge its performance. Amazon notes that Sponsored Brands can drive “traffic to your Brand Store or detail pages,” supporting both product evaluation and catalog discovery.

    Single product detail page

    This is the most direct path. The video features one product, and a click takes the shopper straight to that listing. It’s the easiest setup to measure and usually the best fit for hero products with strong conversion rates.

    The creative should focus narrowly on that single product. Your listing then has to finish the job: strong main image, clear bullets, competitive price, and solid reviews. If the detail page is weak, a great video just sends shoppers to a disappointing destination.

    Brand Store destination

    Sending traffic to your Brand Store makes sense when the goal is discovery across a catalog. Think a cookware brand with pans, lids, utensils, and storage, or an apparel brand with multiple styles. Amazon explicitly pairs Sponsored Brands with Brand Stores to drive “discovery, consideration, and long-term engagement.”

    Expect lower immediate conversion rates from Store traffic compared to detail page traffic. Shoppers browse before buying. Judge Store-destination SBV with metrics like new-to-brand orders and total brand sales over a longer window, not just same-session ACOS.

    Multi-product video formats

    Amazon has expanded Sponsored Brands video to support formats where a video appears alongside several products from your catalog. This lets a brand show its range while still giving shoppers direct paths to individual listings.

    This approach works well for brands with product families, such as variants in different sizes, or bundles of complementary items. The video can tell a broader brand story while the product tiles handle the specifics.

    Match the message to the destination

    A simple rule helps here: the narrower the destination, the narrower the message. Single-product destinations need single-product videos. Store destinations can afford broader brand storytelling. Mismatches, like a brand-story video linked to one product page, confuse shoppers and waste clicks.

    Targeting Architecture Built for Video

    Sponsored Brands video supports keyword targeting and product targeting, which Amazon describes as ways to “reach shoppers who matter most to your business.” How you structure that targeting should reflect what video does well.

    Separate campaigns by intent

    Combining branded, category, and competitor keywords in a single SBV campaign makes it very hard to read performance. Each intent type behaves differently:

    • Branded keywords (your brand name plus product terms) usually convert well and cost less. Video here defends your territory against competitors bidding on your name.
    • Category keywords (“stainless steel water bottle,” “ergonomic office chair”) are where video’s attention advantage matters most. Shoppers are open to options, and a strong video can win them.
    • Competitor keywords and product targets are the hardest to convert but offer the best chance to win new customers. Comparison-style creative works best here.

    Running each in its own campaign lets you set different budgets, bids, and success criteria. It also lets you pair each intent with the creative version built for it.

    Start with mid-funnel category terms

    For most brands launching SBV, the most informative starting point is a focused set of mid-funnel category keywords. These are specific enough to signal buying intent but broad enough to reach new shoppers. Examples include “32 oz insulated water bottle with straw” instead of “water bottle” or your brand name.

    These terms give you clean data on whether your creative can win attention against unfamiliar competitors. That’s the core question you need answered before scaling budget.

    Product targeting for detail pages

    Product targeting lets your SBV appear on specific competitor or complementary listings. Choose targets carefully. The best candidates are products with higher prices, lower ratings, or weaker feature sets than yours, where a side-by-side comparison favors you.

    Complementary product targeting also works. A phone case brand might target specific phone models. A coffee grinder brand might target popular espresso machines. The shopper is already buying into a category where your product fits naturally.

    Use search term reports to refine

    Review the search term report regularly. Add converting search terms as new targets, and add irrelevant or consistently wasteful terms as negatives. Video budgets can drain quickly on broad terms that generate views without purchase intent.

    Reading the Video Metrics: Where Viewers Drop Off

    Sponsored Brands video reporting includes metrics beyond clicks and sales. Amazon says advertisers can “get insights into how and which shoppers engage with your ads to understand your brand’s impact.” These video-specific metrics are where you learn what’s actually going on inside your creative.
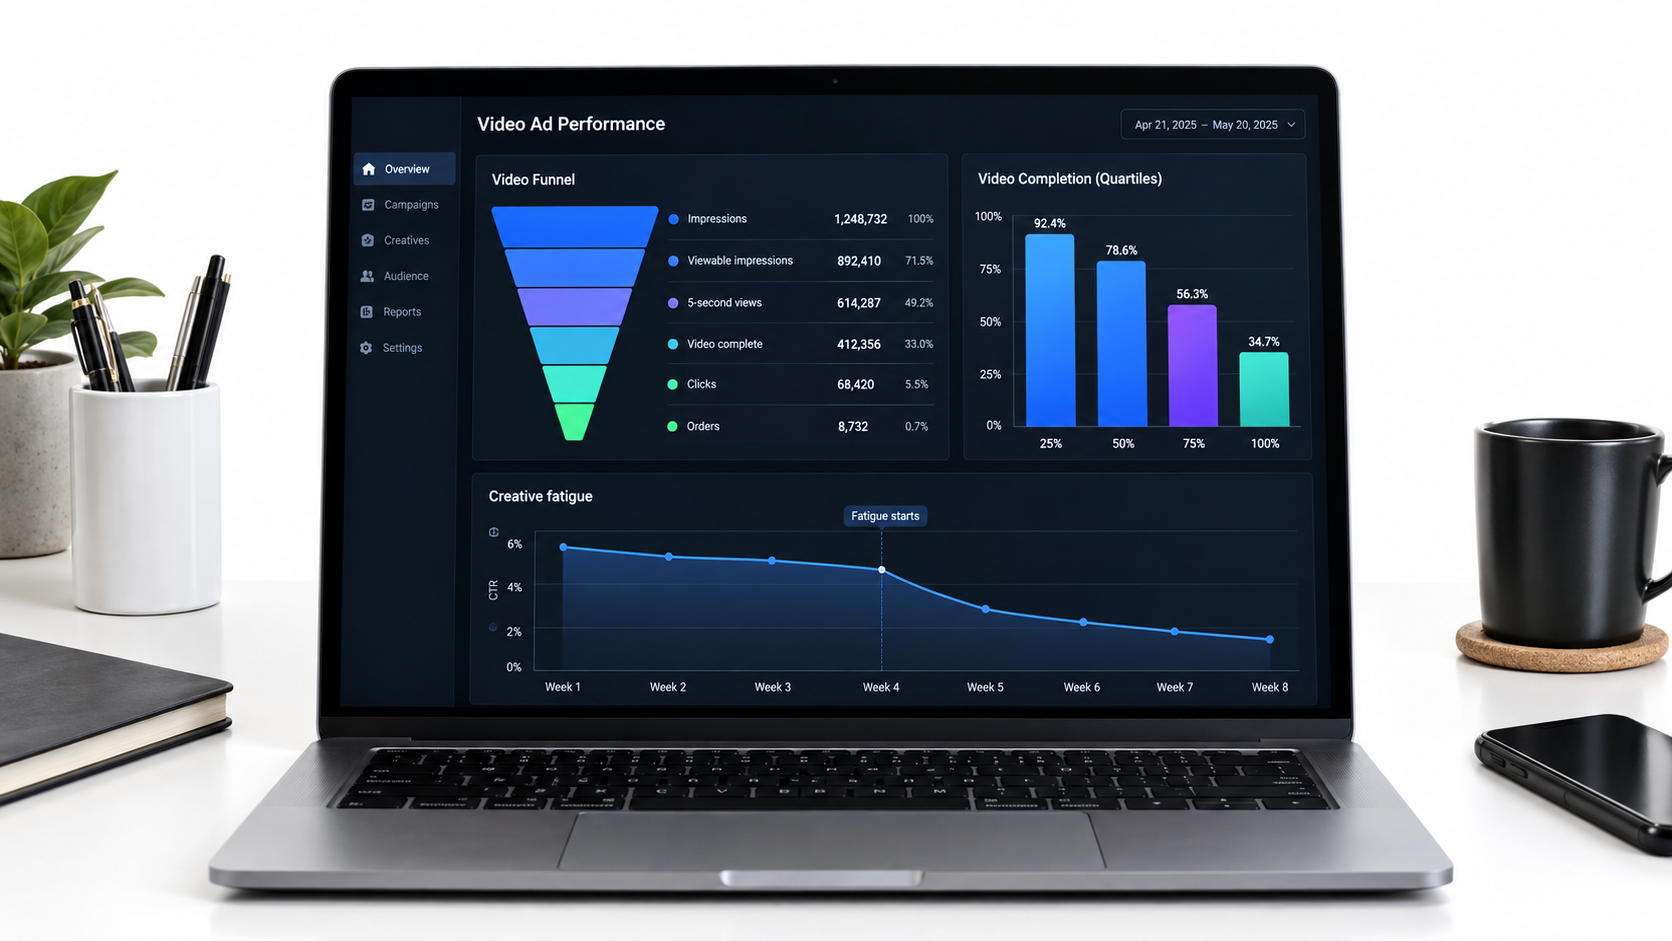
    Analytics dashboard showing Sponsored Brands video metrics funnel, quartile completion rates, and a creative fatigue trend line

    The key video metrics

    • Viewable impressions: Impressions where the video was actually visible on screen according to viewability standards. This is a more honest denominator than raw impressions.
    • 5-second views and 5-second view rate: How many viewers watched at least five seconds. This is your clearest read on whether your opening frames work.
    • Quartile completions: The share of viewers reaching 25%, 50%, 75%, and 100% of the video. These show where attention drops.
    • Viewable click-through rate (vCTR): Clicks divided by viewable impressions. A cleaner measure of creative appeal than standard CTR.
    • Unmutes: How many viewers tapped to turn on sound. Useful as an interest signal, and a reminder of how few viewers hear your audio.
    • New-to-brand metrics: Orders and sales from customers who haven’t bought from your brand in the lookback period.

    Diagnosing problems by where the drop happens

    Each metric points to a specific part of the storyboard:

    1. Low 5-second view rate: The opening isn’t working. Your first two seconds aren’t stopping the scroll. Recut the opening with a stronger product-in-motion shot.
    2. Good 5-second rate, sharp drop before 50%: The hook works, but the middle loses people. Your problem or promise section is probably too slow or too cluttered.
    3. Strong completion rate, low vCTR: People watch but don’t click. The ending lacks a clear reason to act, or the product doesn’t match what the video promised.
    4. Strong vCTR, weak conversion rate: The video works; the landing page doesn’t. Fix the detail page or Store before spending more on video.

    Don’t benchmark blindly

    Published benchmarks for video metrics vary widely by category, price point, and season. A 5-second view rate that’s strong for replacement vacuum filters may be weak for fashion accessories. The most reliable benchmark is your own history. Compare creative versions against each other within the same campaign, targeting, and time window.

    Attribution windows and new-to-brand

    Video often influences purchases that happen later. Sponsored Brands uses a 14-day attribution window for sales. New-to-brand metrics help show whether SBV is reaching fresh customers or just recapturing existing buyers. For brand-building campaigns, a rising new-to-brand share can justify a higher ACOS than you’d accept on a pure conversion campaign.

    Creative Testing and Fatigue: Keeping Video Fresh

    No video performs well forever. Shoppers in your category see the same ad repeatedly, and response declines over time. This creative fatigue is predictable, and a good testing process plans for it instead of reacting to it.

    Test one variable at a time

    When comparing video versions, change only one major element per test. If version A and version B have different openings, different text, and different music, you won’t know which change made the difference.

    The most useful variables to test, roughly in order of impact:

    1. Opening shot (first two seconds)
    2. Primary on-screen claim
    3. Video length (a shorter cut against a longer cut)
    4. Featured benefit order
    5. Closing frame and brand treatment

    Start at the top. Opening shots usually have the biggest influence on 5-second view rate, which affects everything downstream.

    Structure tests fairly

    Run competing creative versions in parallel campaigns or ad groups with identical targeting, bids, and budgets. Let each accumulate enough viewable impressions and clicks before drawing conclusions. Ending a test after two days on a handful of clicks usually leads to wrong conclusions.

    Amazon has also rolled out creative experimentation tools for some ad types, which let you split traffic between versions within the console. Check whether these are available for your account and campaign type. They make fair comparisons much easier.

    Spotting fatigue early

    Fatigue shows up as a gradual decline in 5-second view rate and vCTR while targeting and bids stay constant. When you see that trend over several weeks, it’s time to rotate in fresh creative.

    A practical approach is to keep a pipeline of two or three alternative cuts ready at all times. Because they come from the same footage, they’re cheap to produce. When the current winner starts to fade, swap in the next version and keep testing.

    Seasonal creative

    Seasonal refreshes also help. A water bottle video can feature hiking in summer and office use in the fall. A blanket brand can shift from gifting in December to cozy-home themes in January. The product stays the same; the context changes to match what shoppers are searching for.

    Budgeting and Bidding for Video Campaigns

    Sponsored Brands video is typically sold on a cost-per-click basis, with Amazon also offering impression-based options for certain campaign goals, such as growing brand impression share. The right approach depends on your objective.

    Match the bid strategy to the goal

    If your goal is sales efficiency, use CPC bidding and judge the campaign on ACOS and ROAS, accounting for a 14-day attribution window. If your goal is visibility and brand awareness, impression-based bidding and reserve share of voice options can make sense. Judge those on reach, viewable impressions, and new-to-brand metrics.

    Don’t mix goals within the same campaign. A campaign judged on both awareness and ACOS will disappoint on at least one.

    Set a learning budget

    New SBV creative needs enough traffic to generate meaningful data. Set aside a defined learning budget for the first few weeks and treat it as research spend. Its purpose is to answer questions: does this opening stop the scroll? Does this claim drive clicks? Does this targeting convert?

    Once you know which creative and targeting combinations work, move budget toward them and hold them to efficiency targets.

    Placement bid adjustments

    Sponsored Brands campaigns offer placement-level controls, including bid adjustments for top-of-search in many setups. If your data shows video performs much better in one placement, adjust bids accordingly. Review placement reports regularly, because placement mix can shift as competitors change strategy.

    Think in portfolio terms

    SBV rarely works best alone. HP’s reported results came from combining Sponsored Brands video with Sponsored Brands, Sponsored Products, and display ads. Video creates awareness and interest. Sponsored Products captures shoppers who come back to search more specifically. Display retargets those who viewed but didn’t buy.

    When evaluating SBV, look at its effect on your total brand performance, including branded search volume and overall new-to-brand orders, not just its own attributed sales.

    A 30-Day Rollout Plan for Your Next Sponsored Brands Video

    Here’s a practical sequence for launching or relaunching Sponsored Brands video, built on everything above.
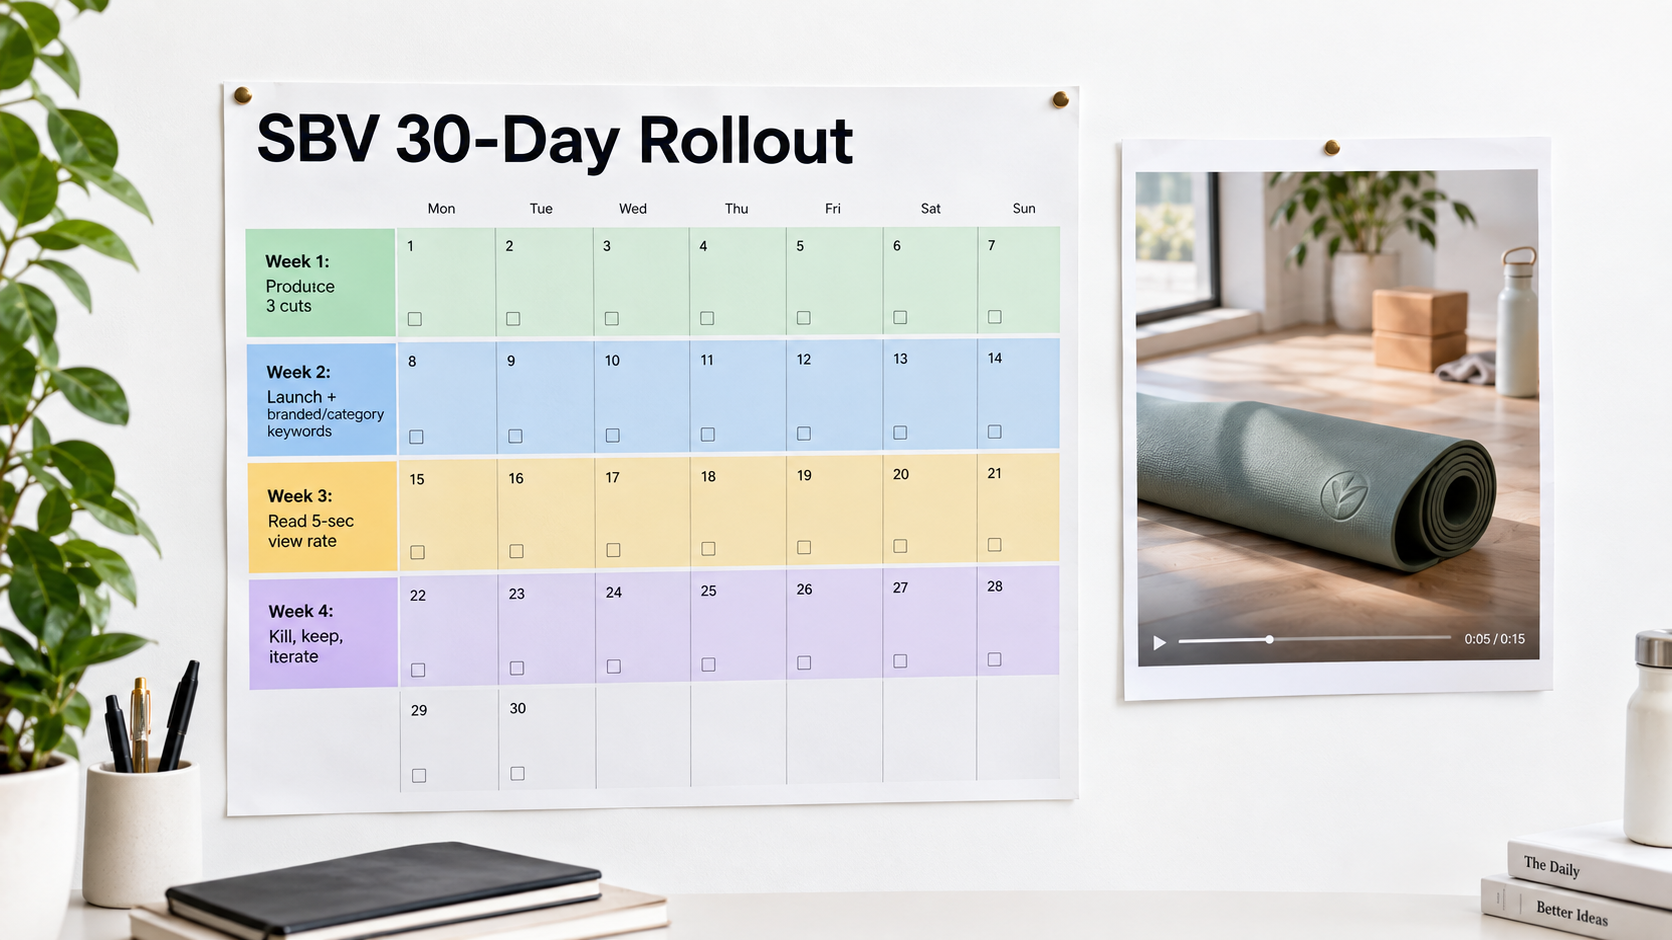
    30-day Sponsored Brands video rollout calendar: produce three cuts, launch on branded and category keywords, read 5-second view rate, then kill, keep, and iterate

    Week 1: Plan and produce

    • Pick one hero product with a strong detail page, good reviews, and healthy inventory.
    • Identify the single visual that best proves its value.
    • Shoot enough footage for at least three different openings.
    • Edit three cuts: a product-in-motion opening, a problem-led opening, and a feature-led opening.
    • Run the muted phone test on each cut with someone outside your team.
    • Check every claim and text overlay against Amazon’s current ad policies and specs.

    Week 2: Launch with clean structure

    • Submit all three cuts for moderation early to leave room for revisions.
    • Create separate campaigns for branded keywords and a focused set of mid-funnel category keywords.
    • Run the three creative versions with identical targeting and budgets.
    • Set a defined learning budget for the test period.

    Week 3: Read the early signals

    • Compare 5-second view rates across the three openings.
    • Check quartile completion to spot where viewers leave.
    • Review vCTR and conversion rate to identify whether the problem is the creative or the landing page.
    • Pull the search term report and add negatives for irrelevant terms.

    Week 4: Decide and iterate

    • Pause the weakest version.
    • Move budget toward the winning cut.
    • Build a new challenger that changes one variable from the winner.
    • Add product targeting campaigns using comparison-style creative.
    • Set a recurring review to watch for fatigue signals going forward.

    At the end of 30 days, you won’t have a perfect video. You’ll have something more valuable: a clear read on what your shoppers respond to and a repeatable process for improving on it.

    Conclusion: Treat the First Two Seconds as the Whole Ad

    Sponsored Brands video is one of the few Amazon ad formats that can actually stop a shopper mid-scroll. It moves in a feed of static images, it holds prominent placements, and it’s only available to brand-registered sellers. The competition is thinner and the attention potential is higher than in most of the ad console.

    That potential is wasted when brands treat SBV as a place to recycle TV spots or website videos. The format has its own rules: muted autoplay, placement-specific shopper mindsets, strict moderation, and metrics that show exactly where attention breaks down.

    Key takeaways

    • Win the first two seconds. Open with the product already in motion. No logo intros, no slow fades.
    • Design for silence. Make on-screen text and visual demonstrations carry the entire message. Treat audio as optional.
    • Cut for placement. Use the same footage to create different openings for in-search, top-of-search, and detail-page contexts.
    • Match message to destination. Single-product videos go to product pages. Brand stories go to Stores or multi-product formats.
    • Separate targeting by intent. Branded, category, and competitor campaigns each need their own budgets, creative, and success metrics.
    • Diagnose with video metrics. 5-second view rate tells you about the hook. Quartiles show the middle. vCTR and conversion rate show the ending and the landing page.
    • Plan for fatigue. Keep two or three alternative cuts ready and test one variable at a time.
    • Judge SBV as part of a portfolio. Measure its effect on new-to-brand orders and total brand sales, not just its own ACOS.

    The brands getting results from Sponsored Brands video in 2026 aren’t necessarily the ones with the biggest production budgets. They’re the ones who’ve worked out what a shopper sees in a muted, two-second glance and built everything else around that moment.
  • Why Most Amazon Sponsored Brand Videos Fail Before the First Second Is Over

    Why Most Amazon Sponsored Brand Videos Fail Before the First Second Is Over

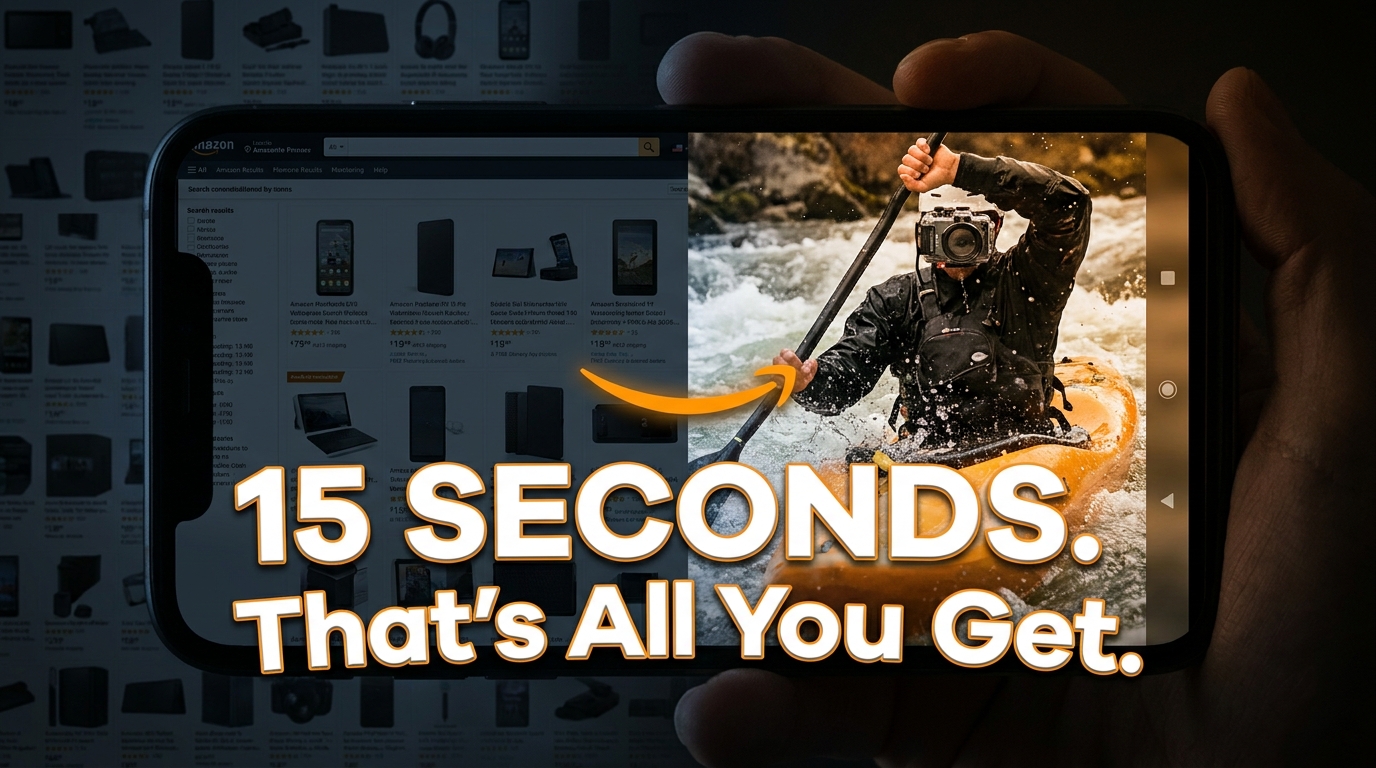
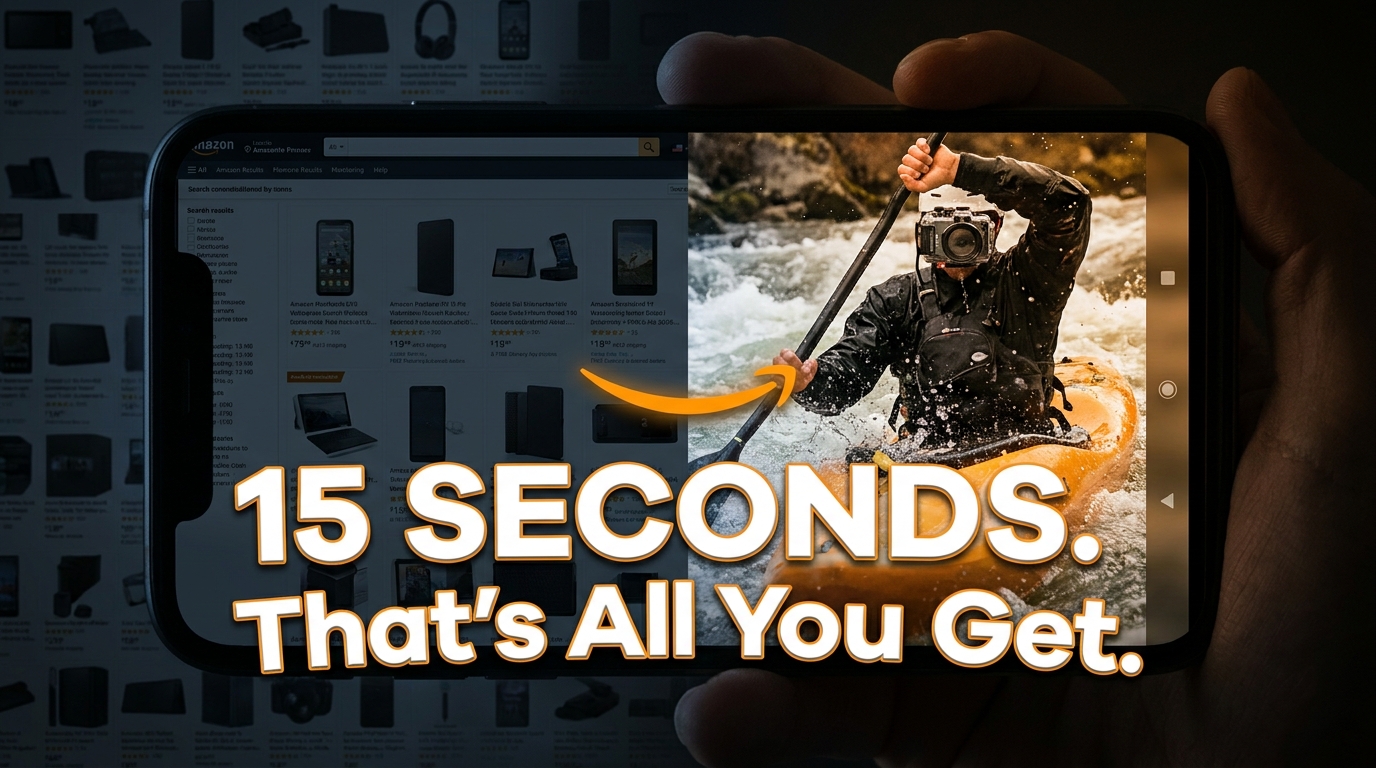
    Amazon Sponsored Brand Video ad appearing as autoplay in search results, contrasted against standard product listings — 15 seconds is all you get

    There is a moment, deep inside an Amazon search results page, where everything changes for a shopper. They’re scrolling past the usual grid of product images — white backgrounds, identical angles, the same price-point signaling — and then something moves. A video starts playing on its own. No tap required. No opt-in. It’s just there, filling the middle of the page, showing a product in actual use.

    That moment is the entire premise of Amazon Sponsored Brand Video (SBV). It is, on paper, the most attention-commanding ad format Amazon offers to sellers and vendors. In a feed built entirely out of static images, motion is a superpower. And yet, the overwhelming majority of Sponsored Brand Video campaigns either underperform their potential or actively waste budget — not because sellers chose the wrong format, but because they misunderstood what the format is actually doing.

    SBV isn’t a commercial. It isn’t a brand film. It isn’t a product demo in the traditional sense. It’s an interruption that happens to a shopper who is already in buying mode — someone who typed a keyword, hit search, and started evaluating options. Your video has roughly one second to justify its existence before that shopper keeps scrolling. One second. That’s not a creative challenge. That’s an engineering problem.

    This piece isn’t about why you should run Sponsored Brand Videos. By 2026, that conversation is largely settled. The question worth examining is why so many SBV campaigns fail creatively, technically, and strategically — and what the sellers who actually make the format work are doing differently. We’ll cover the mechanics of how the ad unit works, the science of attention at scroll speed, the targeting architecture that separates SBV from Sponsored Products, the measurement framework most sellers ignore, and a production approach that doesn’t require a film crew.

    What Sponsored Brand Video Actually Is — and What It Isn’t

    Before diagnosing what goes wrong, it helps to understand the format precisely. Sponsored Brand Video is a sub-type of Amazon’s Sponsored Brands ad product, which historically ran as a banner-style unit across the top of search results. When Amazon introduced the video variant, it added something categorically different: a full-width, auto-playing video unit that appears within search results, typically in the middle of the results page rather than anchored to the top.

    The Technical Mechanics

    SBV ads autoplay without sound by default on both desktop and mobile. This is not an accident or a limitation — it’s a deliberate design decision that mirrors how video content works across social platforms. Shoppers have learned, through years of scrolling Facebook, Instagram, and TikTok, that video plays silently and they can tap to unmute if interested. Amazon is working within that behavior pattern, not against it.

    The video specs Amazon enforces are worth understanding in detail because they shape creative strategy:

    • Duration: Minimum 6 seconds, maximum 45 seconds. The effective sweet spot based on engagement patterns is 15 to 30 seconds.
    • File format: MP4 or MOV
    • Resolution: Minimum 1920 x 1080 pixels (1080p). Amazon recommends 16:9 aspect ratio for desktop; vertical formats are increasingly supported for mobile placements.
    • File size: Maximum 500MB
    • Frame rate: 23.976, 24, 25, 29.97, or 30 fps
    • Audio: While the video autoplays muted, audio must still be present in the file — and must be clear, because shoppers can and do unmute. Voiceover narration that clearly reinforces the visuals is considered best practice.

    Where SBV Ads Actually Appear

    The placement behavior of SBV is one of the most misunderstood aspects of the format. Unlike top-of-search banner ads, SBV units appear in the middle of keyword search results pages — specifically in the area below the first row of organic results, mixed in with the product grid. On mobile, this placement dominates screen real estate. The ad expands to fill the full width of the search page, making it impossible to scroll past without registering visually.

    SBV is keyword-targeted, not product-targeted by default (though product targeting is an option). This means you’re reaching shoppers at the exact moment of active category search — not passively browsing a detail page. That intent signal is what makes the format fundamentally different from display advertising.

    Who Can Run SBV

    Access to Sponsored Brand Video requires enrollment in Amazon Brand Registry. This applies to both sellers (third-party) and vendors (first-party). Brand Registry requires a registered trademark in the relevant marketplace country. For most legitimate brands, this is a standard compliance step — but it does mean SBV is not available to unregistered resellers or arbitrage accounts. This effectively makes SBV a brand-building tool in both form and access structure.

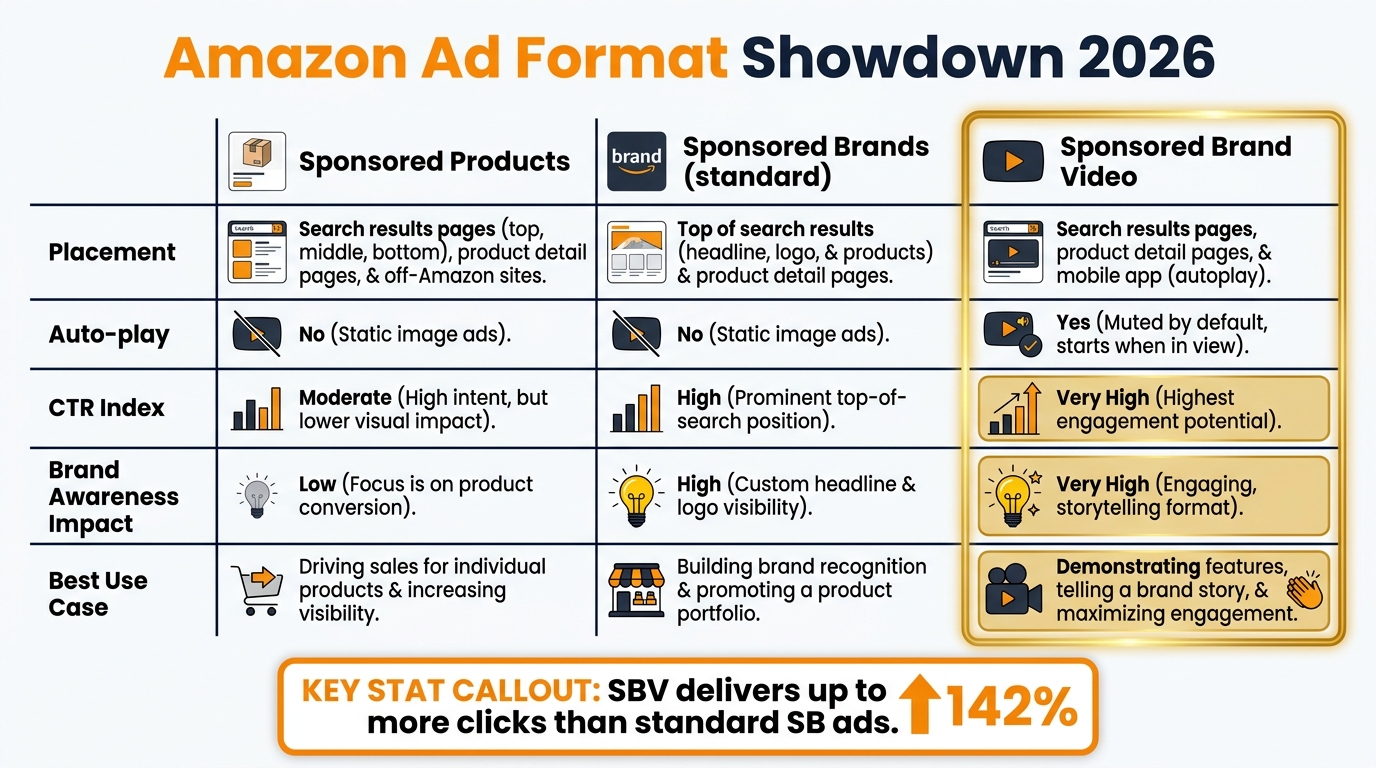
    Amazon ad format comparison chart showing Sponsored Products vs Sponsored Brands vs Sponsored Brand Video across placement, auto-play, CTR, and best use cases

    SBV vs. Sponsored Products vs. Standard Sponsored Brands: When to Use Each

    One of the most persistent mistakes in Amazon advertising is treating all three ad types as interchangeable tools that just happen to look different. They’re not. Each format operates at a different stage of the shopper’s decision process, and allocating budget without understanding that distinction leads to consistently misread performance data.

    Sponsored Products: The Closer

    Sponsored Products (SP) is Amazon’s highest-volume, lowest-funnel ad unit. It looks like an organic listing. It appears in organic results. Shoppers frequently can’t distinguish it from non-paid results, which is exactly what makes it effective for capturing demand that already exists. If someone types “stainless steel water bottle 32oz” and your SP ad appears at position 2, you’re fishing where the fish are already hungry.

    SP campaigns are generally the first thing any brand should optimize because they directly impact organic ranking velocity. Every SP sale contributes to sales history, conversion rate data, and keyword relevance signals that Amazon’s algorithm reads when deciding organic placement. They should anchor any brand’s baseline advertising — but they are not a brand-building tool. A shopper who clicks a Sponsored Products ad and buys your product may not remember your brand name three days later.

    Standard Sponsored Brands: The Billboard

    Standard SB ads — the banner units with brand logo, custom headline, and up to three product images — function more like traditional awareness advertising. They run primarily at the top of search results and on product detail pages. Their strength is visibility at the category level: a shopper who searches “protein powder” sees your brand name before they see any specific product.

    Standard SB is useful for brand recall, especially in categories where trust and familiarity drive the final click. But static banner ads on a shopping platform have a significant limitation: they’re fighting the natural scanning behavior of a shopper whose eyes are trained to jump straight to product images and prices. A banner that doesn’t immediately answer “why should I care about this brand?” gets mentally filtered out in milliseconds.

    Sponsored Brand Video: The Conversation Starter

    SBV sits between the two. It has the keyword targeting precision of Sponsored Products but the brand-presence impact of Sponsored Brands. More importantly, it creates something neither of the other formats can: a moment of genuine product understanding. Shoppers who watch a well-made SBV ad come away knowing not just what the product is, but how it works, what problem it solves, and what kind of person it’s for. That understanding drives higher-quality clicks — people who land on your detail page already convinced, not just curious.

    The practical implication for budget allocation: SBV rarely replaces SP campaigns. It supplements them. A shopper might see your SBV ad, not click, then encounter your Sponsored Product in a subsequent search and convert. The awareness moment matters even when it doesn’t directly produce a same-session click.

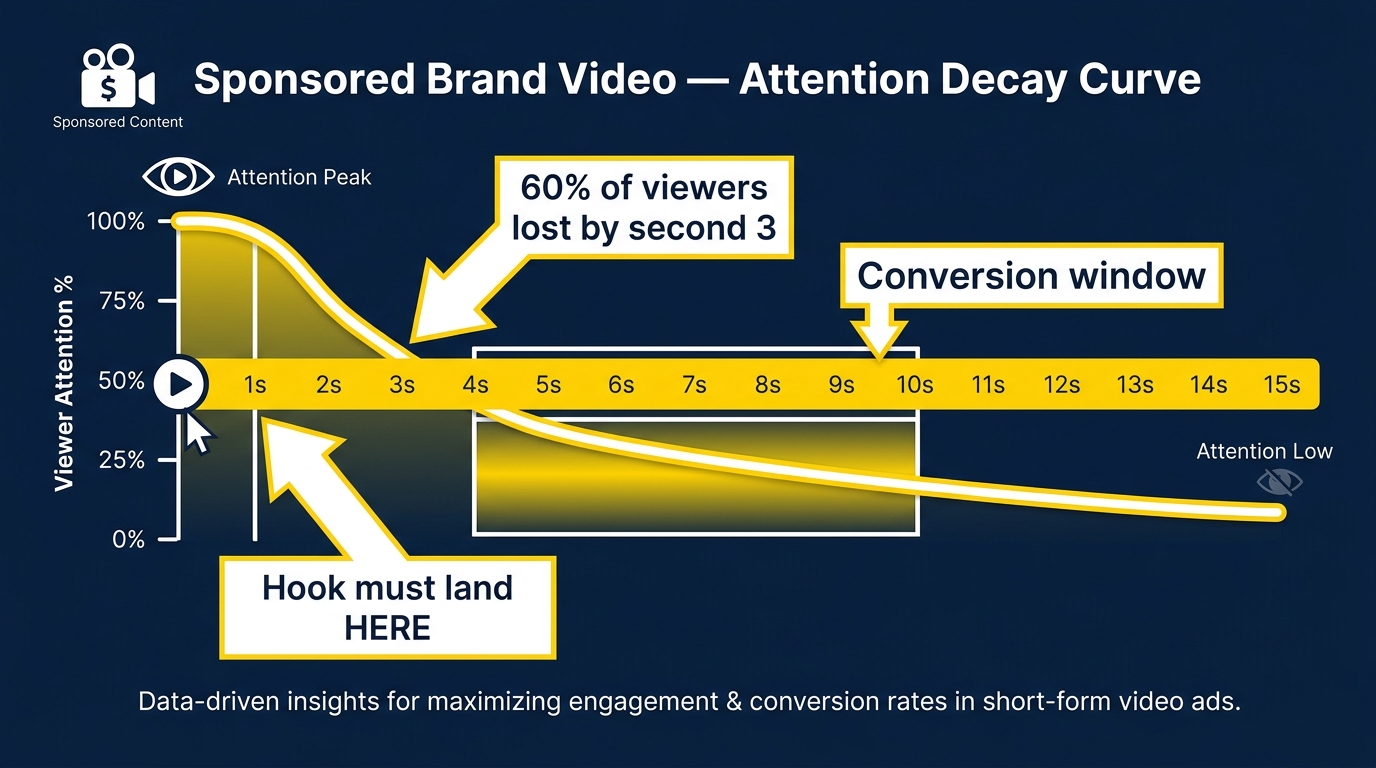
    The Real Reason SBVs Fail: The First Three Seconds Problem

    Sponsored Brand Video attention decay curve showing 60% of viewers lost by second 3 with hook zone highlighted at 0-1 seconds and conversion window between seconds 4-10

    Ask a typical brand team what their SBV creative looks like and you’ll hear some version of this: a two-second logo reveal, then a lifestyle shot, then a product hero moment, then a voiceover explaining the brand story. The video is well-produced. It’s on-brand. It probably cost a few thousand dollars to make.

    And it fails. Not because it’s bad creative in the abstract, but because it’s built for a different context — one where the viewer has already opted in to watching. An SBV ad earns zero opt-in. It starts playing in the middle of a page where the shopper’s goal is to evaluate and buy products, not watch brand content. That context changes everything about how the creative needs to be structured.

    The Scroll Speed Reality

    On mobile — which accounts for the majority of Amazon shopping traffic — a page scroll takes roughly 300 to 500 milliseconds. In that time, the human visual system is making low-effort assessments: Is this relevant? Should I stop? Does this deserve my attention? Those assessments happen before conscious evaluation kicks in. By the time a shopper’s prefrontal cortex is deciding whether to engage with your video, the video has already been playing for 1 to 2 seconds. The subconscious decision has already been made.

    This is why the first second isn’t just important — it’s the entire ballgame for a large percentage of your audience. Research into video ad attention across digital platforms consistently shows that viewership drops sharply within the first three seconds. The exact numbers vary by category and platform, but the shape of the curve is universal: steep initial drop, then a gentler decline among those who stayed past the hook.

    What Amazon’s Own Data Suggests

    Amazon doesn’t publish granular view-through data broken down by second, but the Video Completion Rate (VCR) metric available in the advertising console reveals the pattern. Brands running SBV campaigns regularly report a significant gap between video impression volume and completion volume — meaning a large proportion of shoppers scroll past before the video hits the midpoint. The brands that see stronger VCR numbers share a common creative trait: they put the product in motion immediately, before any branding, title card, or music fade-in.

    The Logo-First Trap

    The instinct to lead with a brand logo makes sense from a traditional advertising standpoint. Brand recognition requires repeated exposure to brand identifiers, and the logo is the primary identifier. But on Amazon, the logo-first approach has a specific problem: it signals to the shopper that they’re watching an ad rather than getting information. That signal triggers scrolling behavior rather than stopping behavior.

    The counterintuitive fix: lead with the product doing something interesting, then reveal your brand. Shoppers who stay to watch a compelling product moment are more receptive to brand information that comes after. The sequence matters more than the content.

    The Creative Framework That Actually Converts

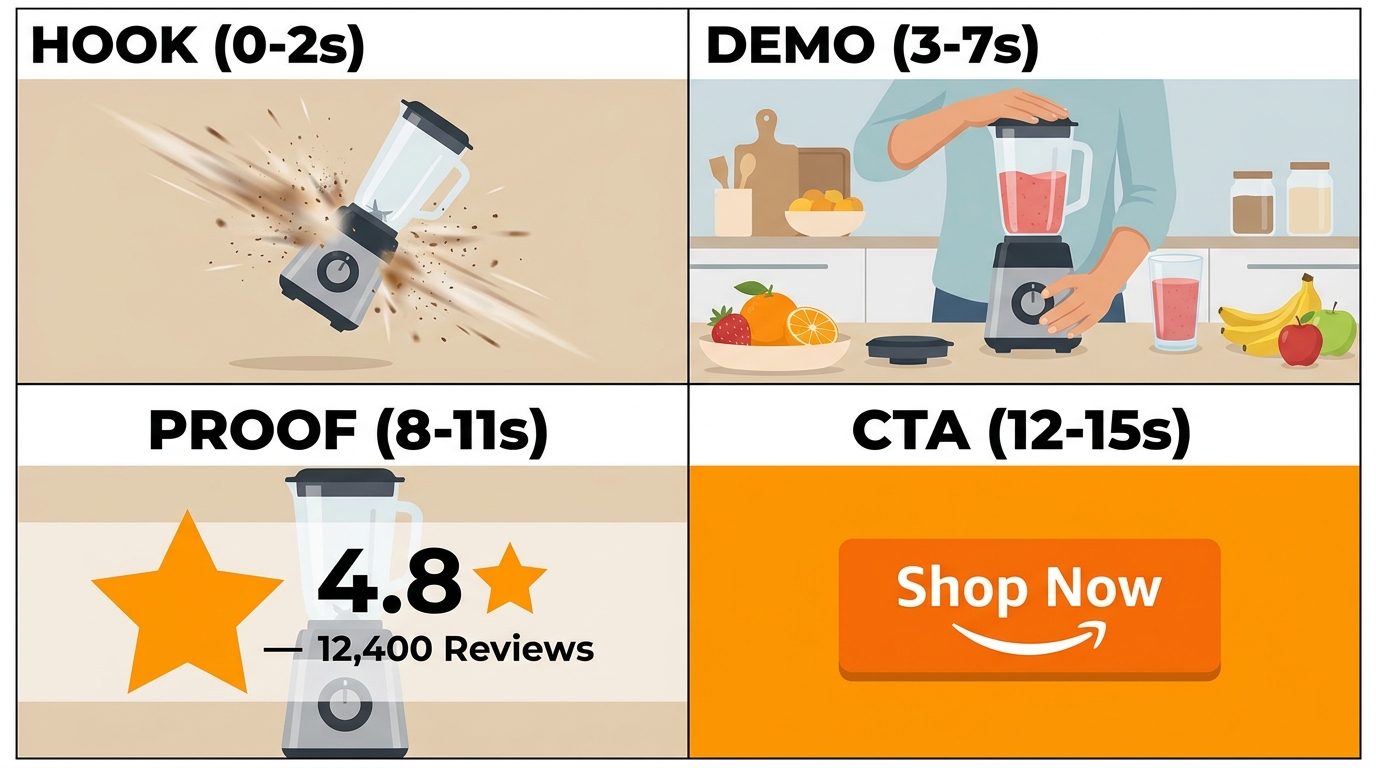
    Four-panel storyboard for Amazon Sponsored Brand Video: Hook 0-2 seconds, Demo 3-7 seconds, Proof 8-11 seconds, CTA 12-15 seconds

    After working through the attention dynamics, the creative structure that consistently outperforms becomes fairly logical. It’s not a formula in the rigid sense — execution still matters enormously — but the underlying sequence holds across categories.

    Phase 1: The Hook (Seconds 0–2)

    The hook’s job is to stop the scroll. That’s it. Not to explain the product, not to establish brand identity, not to set a mood. To stop the scroll.

    What stops scrolls? Motion that creates a question in the viewer’s mind. A product being used in an unexpected way. A problem being demonstrated so clearly that the viewer recognizes it as their own. A visual contrast — the “before” state that makes you wince, immediately followed by a transition.

    Effective hooks tend to share a few characteristics:

    • They show the product immediately. Not in packaging. Not being unboxed. In use. The viewer should be able to identify what they’re looking at within the first half-second.
    • They imply a payoff. The opening visual should create a sense of “I need to see where this goes.” This can be as simple as a blender in motion, a cleaning product attacking a visible mess, or a garment being worn in an aspirational setting.
    • They work muted. Because most viewers won’t unmute in the first second, the hook must land visually, without relying on audio or voiceover. On-screen text can reinforce the hook if it’s large enough to read at scroll speed.

    Phase 2: The Demonstration (Seconds 3–8)

    With the viewer’s attention secured, the demonstration phase earns its real estate. This is where you show the product solving the problem or delivering the experience it promises. The key principle here is specificity over generality.

    A common mistake: showing the product in a beautiful lifestyle context without actually demonstrating how it works. Soft-focus shots of people smiling while holding your product tell shoppers very little. Close-up shots of the product mechanism, the material quality, the ease of use, the measurable result — those tell shoppers everything they need to decide.

    On-screen text should accompany the demonstration, not as subtitles of an audio track, but as functional callouts. Labels like “leakproof seal,” “BPA-free stainless steel,” or “fits standard car cupholders” do more in three words than five seconds of voiceover can. Think of this section like an annotated product demo — you’re both showing and explaining simultaneously.

    Phase 3: Social Proof (Seconds 9–12)

    For most categories, trust signals close the gap between interest and click. The proof phase should be brief and concrete. Star ratings with review counts, third-party certifications, notable claims (“Amazon’s Choice,” “#1 Best Seller in [category]”), or specific performance stats relevant to the product.

    Avoid vague superlatives. “The best water bottle you’ll ever own” is ignored. “4.8 stars across 14,000 reviews” is processed and retained. The specificity of the number signals authenticity in a way that adjectives cannot.

    Phase 4: The Call to Action (Seconds 13–15)

    SBV ads link to a product detail page or Amazon Brand Store when clicked. The CTA should reflect that destination. “Shop now,” “See all sizes,” or “Explore the collection” are appropriate. Avoid off-Amazon language like “Visit our website” — it creates cognitive friction because the shopper knows they’re on Amazon.

    The product should be visible during the CTA phase, ideally paired with pricing information if the price is competitive. Many shoppers make their final click decision based on price, and showing it in the video can eliminate a step between the ad and the purchase decision.

    Targeting Architecture: Why Keyword Strategy for SBV Is Different

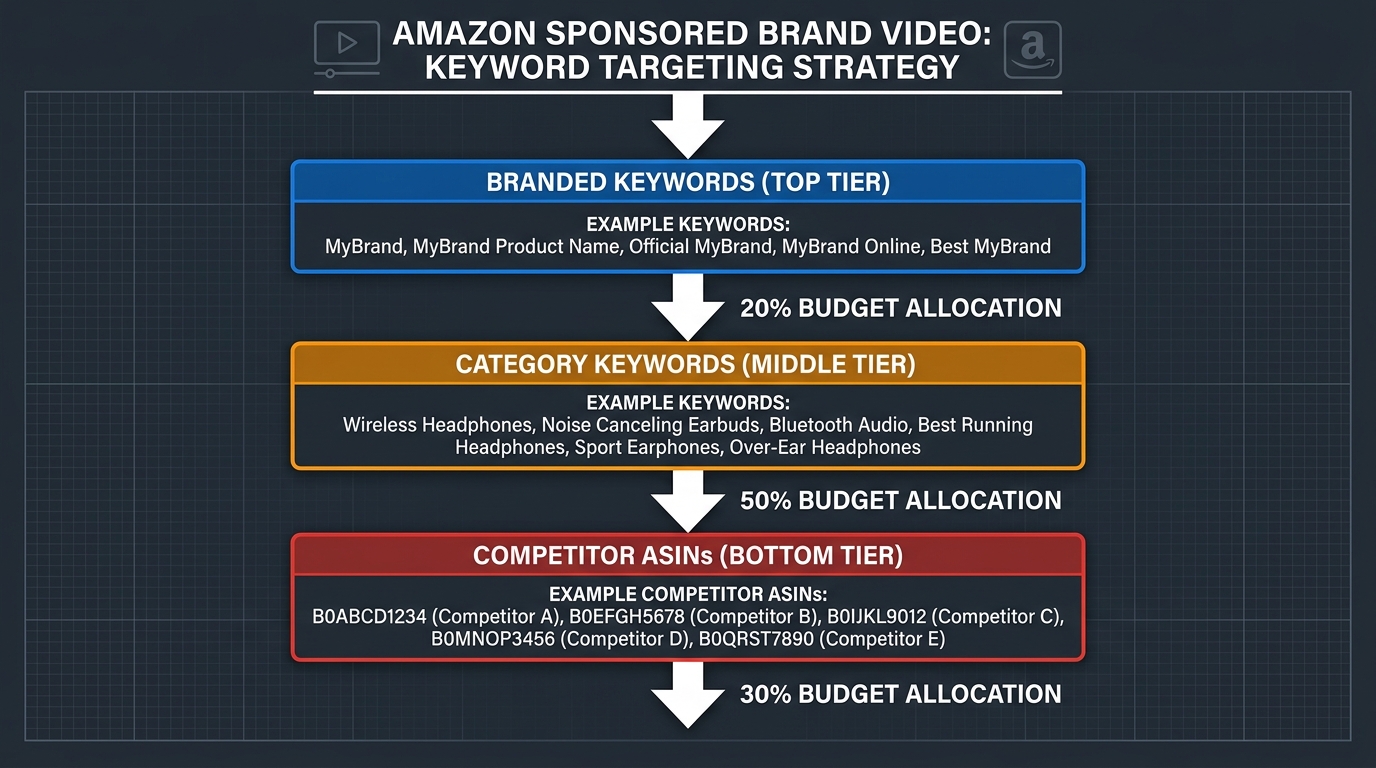
    Three-tier keyword targeting architecture for Amazon Sponsored Brand Video campaigns: branded keywords, category keywords, and competitor ASINs with budget allocation percentages

    One of the most common SBV mistakes is importing the same keyword lists from Sponsored Products campaigns and running them in SBV without modification. This approach works — in the same way that a hammer technically works as a screwdriver. You’ll get some results, but you’re leaving the format’s unique strengths almost entirely unused.

    Understanding the Intent Mismatch

    Sponsored Products keyword targeting works because the format looks organic. When a shopper searches “best air fryer” and clicks on what appears to be a regular product listing, the transition feels natural. With SBV, the shopper is aware they’re watching an advertisement. That awareness changes the intent dynamic. High-transactional keywords — terms used by shoppers who are ready to buy right now — may actually underperform in SBV relative to SP because those shoppers are in “decide and buy” mode, not “learn about options” mode. Watching a 15-second video feels like a detour to a purchase-ready shopper.

    This doesn’t mean transactional keywords don’t belong in SBV campaigns. It means the video creative needs to be structured differently depending on the keyword type. A viewer who searched a highly specific product term (“32oz insulated water bottle black with straw lid”) doesn’t need to be convinced the category is worth considering — they need to be convinced your specific version is the right one. The demonstration phase of the video becomes critical for those keywords.

    A Three-Tier Keyword Architecture

    A structurally sound SBV targeting approach typically involves three distinct campaign types running in parallel:

    Tier 1 — Branded keyword defense: Your brand name and product line names. Budget allocation here is primarily defensive — you’re ensuring that shoppers who search specifically for your brand see your own content rather than a competitor’s. Bidding on your own brand terms in SBV is particularly important if competitors are running SBV ads targeting your branded keywords (which is allowed and common).

    Tier 2 — Category and problem-based keywords: These are the broad-to-phrase match keywords that describe what your product does or the problem it solves. “Insulated water bottle,” “leakproof bottle for gym,” “stainless steel tumbler.” These keywords reach shoppers at the consideration stage — they know what category they want but haven’t committed to a specific product or brand. SBV performs exceptionally well at this tier because the video format can shape early-stage decision-making in ways that a static image cannot. Budget allocation here should typically be the heaviest, because this is where new-to-brand customer acquisition happens.

    Tier 3 — Competitor ASIN and brand targeting: SBV allows product targeting, which lets you serve your video ad to shoppers browsing a competitor’s product detail page. This is a more aggressive tactic and requires careful creative consideration — your video needs to make a clear comparative case for why your product is worth a second look. The click-through rate on competitor targeting is typically lower, but the conversion intent of shoppers who do click is high.

    Match Type and Negative Keyword Management

    For SBV, phrase and exact match types generally outperform broad match because the format’s effectiveness depends on relevance. A broadly targeted SBV campaign that serves video ads for loosely related searches wastes both budget and impressions. The cost per view (CPV) model means you’re paying even for quick scroll-pasts, so relevance discipline matters more than in cost-per-click models.

    Negative keyword management for SBV should be run as a separate exercise from SP campaigns. The search terms that convert well in SP may be irrelevant or low-performing in SBV, and vice versa. Run search term reports for SBV campaigns independently and prune aggressively in the first 30 to 60 days.

    Budget, Bidding, and ACoS Benchmarks for SBV in 2026

    Setting realistic budget and performance expectations for SBV is harder than for Sponsored Products because the format operates across multiple funnel stages simultaneously. A single SBV campaign can generate both direct conversions (click → purchase within the same session) and assisted conversions (view → return visit → purchase) — and Amazon’s standard ACoS metric only captures the former.

    Starting Bid Strategy

    SBV uses a cost-per-click (CPC) model, not cost-per-view. This means you only pay when a shopper clicks your ad, not when they watch it. That makes the economics more straightforward than they might appear: even if 95% of shoppers who see your video don’t click, they’ve received an impression of your product in motion. You paid for that impression at zero cost.

    This also means that aggressive bidding in SBV is generally justified in a way it might not be in display formats. Because you’re only charged for clicks, high bids primarily drive your auction competitiveness and placement quality — they don’t inflate costs from view-heavy but click-light impressions.

    For category keyword targeting, starting bids should typically run 10 to 20% higher than your comparable Sponsored Products bids for the same keywords. The rationale: SBV placements are less numerous than SP placements, so competition for premium positions is intense. Underbidding in SBV doesn’t just lower placement — it can result in your ads not serving at all during peak traffic windows.

    What to Expect for ACoS

    SBV campaigns typically run at higher ACoS than Sponsored Products campaigns in the same category, particularly during the first 60 to 90 days. This is a structural reality, not a sign of failure. SP campaigns benefit from direct-response targeting in an established context; SBV is partially doing awareness work, and that work doesn’t always convert within the attribution window.

    Amazon’s standard attribution window for sponsored ads is 7 days for keyword-targeted campaigns (a shopper who clicks your ad and purchases within 7 days is credited as an ad-attributed sale). In practice, SBV’s influence on purchase behavior often extends beyond that window, particularly for higher-consideration products. A shopper who watches your video ad, doesn’t click, searches again three days later, and converts through an organic listing or SP ad — that sale doesn’t appear in your SBV ACoS, but SBV contributed to it.

    For most categories in 2026, SBV ACoS in the 20 to 35% range during the first 60 days is not alarming if new-to-brand customer acquisition rates are strong. SBV campaigns that show 60 to 70%+ new-to-brand order rates are performing their intended function — growing the customer base rather than retargeting existing buyers.

    Daily Budget Floors

    SBV campaigns require sufficient daily budget to generate statistically meaningful data quickly. Amazon’s algorithm needs volume to optimize delivery, and SBV’s higher CPC relative to SP means thin budgets produce thin data. For most sellers, a minimum daily budget of $30 to $50 per SBV campaign is needed to generate enough impressions for meaningful week-over-week analysis. Campaigns running on $5 to $10 daily budgets may generate useful brand impressions but won’t produce the click and conversion volume needed to optimize targeting or creative performance.

    The Amazon Creative Approval Gauntlet

    Amazon’s video creative review process has become significantly more stringent since SBV launched, and rejections are common enough that they deserve a dedicated section. Knowing what gets flagged before you shoot and edit is far cheaper than learning it after video production is complete.

    Common Rejection Reasons

    Amazon’s content review team rejects SBV creatives for both technical and content-related reasons. The technical failures are usually straightforward to fix: incorrect resolution, audio levels that are too low, frame rate mismatches, or letterboxing that leaves black bars on the frame. These are pre-submission checklist items.

    The content-related rejections are more nuanced and more frustrating:

    • Claims that require substantiation: Any health, safety, or performance claim that isn’t substantiated on the product detail page or through recognized certification can trigger rejection. “Clinically proven to reduce inflammation” requires FDA or equivalent documentation. “Helps you stay hydrated” does not. The line between acceptable and rejected claims often feels arbitrary, but the underlying principle is that the video cannot make claims the product page doesn’t back up.
    • Competitor references: Direct naming or showing of competitor products in a comparative context is prohibited. You can show your product is better than “the competition” in an implied way, but explicit side-by-side with a named competitor brand is not allowed.
    • Price or promotional claims: Time-sensitive price claims (“only $19.99 this week!”) are rejected because video creatives aren’t updated in real-time and a stale price claim would mislead shoppers. Evergreen value claims (“under $25”) are generally acceptable if accurate.
    • Lifestyle depictions: Videos depicting activities that could be considered dangerous, or showing product use in contexts that imply claims (like showing a skincare product used by a person with dramatically clearer skin before/after) can be flagged depending on the category.
    • Text density: Videos that are primarily text overlays with minimal visual content — essentially animated infographics — may be rejected as insufficiently “video” in nature. The format requires genuine motion content.

    The Resubmission Process

    Amazon typically provides a rejection reason when a video fails creative review, though the specificity varies. In some cases the feedback is precise (“claim on screen at 0:08 requires substantiation”); in others it’s broad (“content does not meet our guidelines”). When rejection feedback is vague, the fastest path to resubmission is removing any claim that could even loosely be considered a performance statement and resubmitting.

    Review timelines average 1 to 3 business days for initial submissions. Resubmissions typically process within 24 to 48 hours. Budget 5 to 7 business days from final creative delivery to campaign launch to account for review cycles, particularly if the video includes any health, safety, or performance claims.

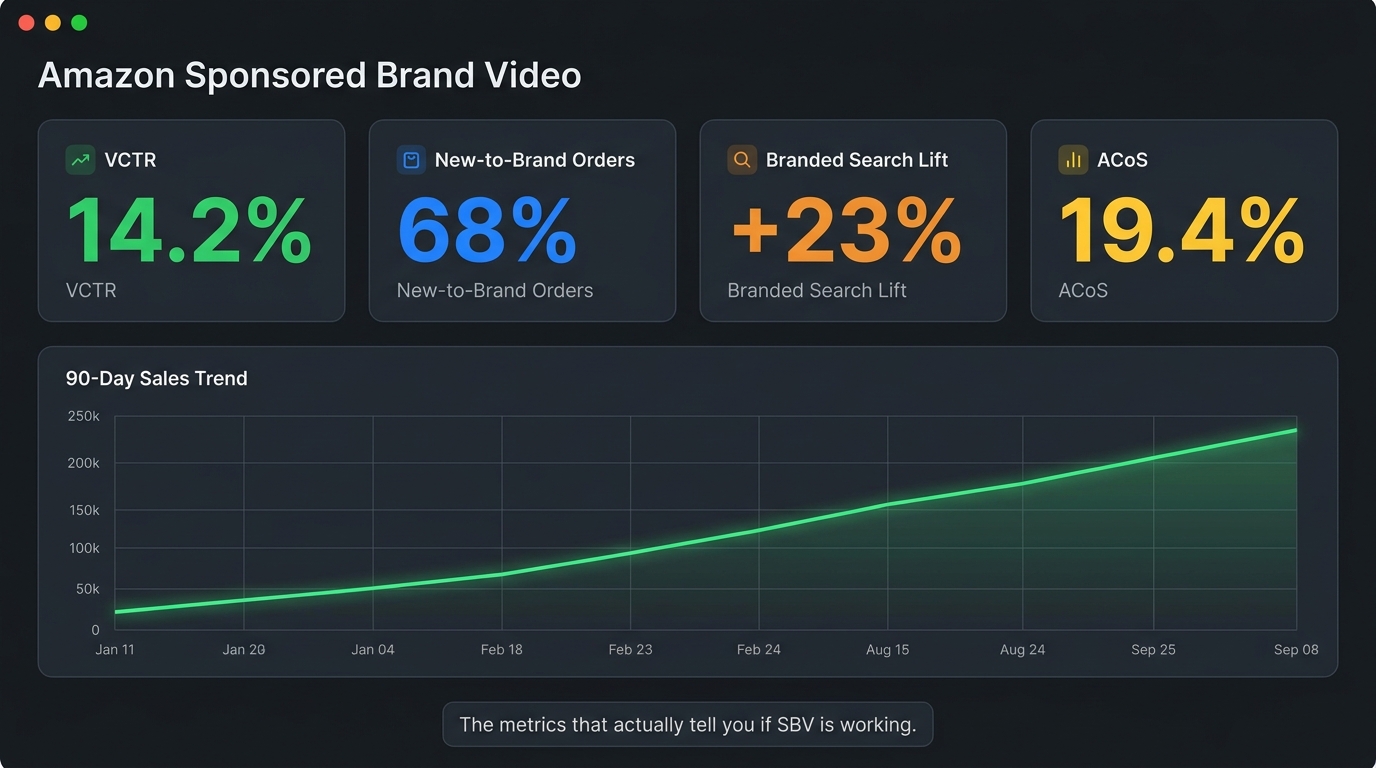
    Measuring SBV Performance: The Metrics That Actually Matter

    Amazon Sponsored Brand Video performance dashboard showing VCTR, New-to-Brand Order rate, branded search lift, and ACoS metrics with 90-day sales trend graph

    The default metrics in Amazon’s advertising console — impressions, clicks, spend, sales, ACoS — are necessary but insufficient for evaluating SBV performance. Treating SBV like a Sponsored Products campaign and optimizing purely on ACoS will consistently lead to premature campaign shutdowns for formats that are actually working.

    The Metrics That Tell the Real Story

    Video Completion Rate (VCR): The percentage of video impressions where the full video was watched. Available in Amazon’s campaign reporting for video ad types. VCR is the clearest signal of creative quality — a video that loses people in the first three seconds will have poor VCR, and no amount of bidding adjustment will fix that. The remedy is creative, not campaign structural. Industry benchmarks for SBV VCR vary widely by category, but a healthy creative generally targets 15% to 30% VCR.

    Video Click-Through Rate (VCTR): The ratio of clicks to video impressions (not standard CTR, which would be clicks to ad impressions). VCTR isolates the conversion effectiveness of the video itself. A high VCTR with a low VCR suggests your hook is working but your demonstration is weak — people are clicking early without finishing the video. A high VCR with a low VCTR suggests people are watching but not being prompted to act — the CTA needs work.

    New-to-Brand (NTB) Order Rate: The percentage of sales attributed to SBV that came from customers who hadn’t purchased from your brand on Amazon in the prior 12 months. This is arguably the most strategically important metric for SBV campaigns. If NTB rates are high (60%+), SBV is doing its job of expanding your customer base. If NTB rates are low, you’re likely running SBV against branded keywords and retargeting existing customers — which is less efficient than using Sponsored Products for that purpose.

    Branded Search Lift: Not directly available in the advertising console, but measurable through Amazon Brand Analytics (available to Brand Registry enrollees). Look for increases in branded search volume during and after SBV campaign periods. SBV’s awareness function should, over time, produce measurable increases in the number of shoppers searching your brand name directly — a signal that the video content is driving brand recall.

    Detail Page View Rate from Video: Available in some reporting configurations, this shows how many shoppers who viewed the SBV ad then visited the product detail page — including those who didn’t click the ad directly but searched and found the product organically. This metric captures some of the awareness-to-consideration conversion that standard click attribution misses.

    The Optimization Timeline

    SBV campaigns require a different optimization cadence than SP campaigns. For SP, weekly bid adjustments based on keyword performance are standard practice. For SBV, the first three weeks should be largely observational — you need sufficient impression and click volume to draw conclusions, and premature optimization creates unstable data sets.

    By week four, the following decisions should be data-supported: Which keyword tiers are driving the highest NTB rates? Which keyword groups show strong VCR but weak VCTR (suggesting a creative-to-keyword mismatch)? What is the average cost per new-to-brand customer acquisition, and how does it compare to other channels?

    Creative testing should be structured carefully. Amazon allows multiple video creatives within a campaign, but running too many variables simultaneously makes it impossible to isolate what’s driving performance differences. Test one creative variable at a time: different hooks, different CTA copy, different voiceover approaches. Treat creative testing with the same discipline you’d apply to listing A/B testing.

    Real-World Results: What the Data From HP, Loftie, and Others Shows

    Amazon’s publicly available case studies provide useful benchmarks for what strong SBV performance looks like at scale and at the small brand level.

    HP’s Global SBV Expansion

    HP Electronics deployed Sponsored Brand Video as part of a broader multi-format Amazon advertising strategy, combining SBV with standard Sponsored Brands, Sponsored Products, and Display ads across multiple global markets. The results for SBV specifically are notable: impressions grew 224% year-over-year, and total clicks increased 142% year-over-year, with the SBV placement specifically contributing a 42% increase in clicks for the Sponsored Brands video category.

    The HP case illustrates a point worth emphasizing: SBV works best as part of a coordinated format strategy, not as a standalone campaign type. The 224% impression growth didn’t come from SBV alone — it came from SBV being the top-of-funnel awareness driver that made the SP and display touchpoints more effective. Shoppers who had already seen an HP video were more likely to click an HP SP ad further down the funnel.

    Loftie’s Efficiency Case Study

    Loftie, a small-business brand selling a smart alarm clock designed to improve sleep habits, ran an Amazon advertising campaign that included Sponsored Brand Video as a primary format for awareness and consideration. The results: a return on ad spend of $5.66 and an advertising cost of sale of 17.68%.

    For a brand selling a premium, higher-consideration product in a category (sleep tech) where shoppers need to understand the product’s features to justify the price point, SBV was a natural fit. A 17.68% ACoS for a product that requires education before purchase is genuinely strong performance — it suggests the video creative was doing effective pre-qualification, meaning shoppers who clicked were already largely convinced.

    NF Imports: Long-Term Brand Building

    NF Imports, a Japan-based brand that began advertising on Amazon in 2015, incorporated Sponsored Brands (including SBV) into a long-running advertising strategy. Their data shows 80% of sales coming from new customers between 2018 and 2022, and steady 30% annual sales growth over the same period. While not exclusively attributable to SBV, the new-to-brand rate is the key indicator: a format strategy centered on awareness advertising consistently produces customer bases weighted toward new buyers rather than repeat purchasers.

    Production Without a Big Budget

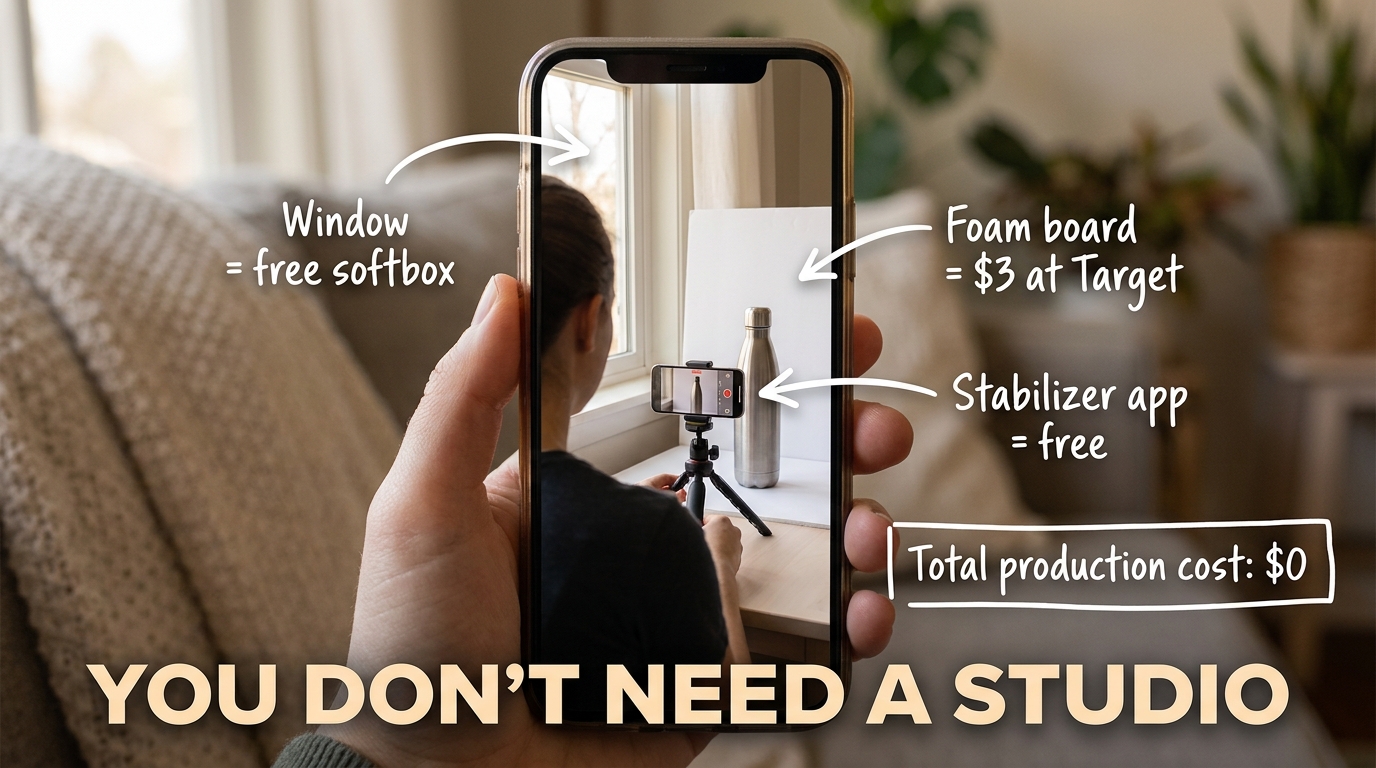
    Smartphone filming a product video with DIY home setup: foam board backdrop, window lighting, free stabilizer app — total production cost zero

    The most common objection to SBV from small and mid-size sellers is production cost. The assumption is that running video advertising requires either an expensive agency engagement or a professional production crew — neither of which fits a $500-per-month advertising budget. This assumption is increasingly untrue, and it’s costing sellers who hold it a meaningful competitive disadvantage.

    What Actually Makes a Good SBV Creative

    The creative quality that matters for SBV is not production polish. It’s clarity and motion. A video shot on a modern smartphone (iPhone 14 or later, any current Samsung flagship, or equivalent) at 1080p 30fps meets Amazon’s technical requirements. The variables that determine performance — hook strength, demonstration clarity, proof presentation, CTA legibility — are scripting and editing decisions, not equipment decisions.

    What genuinely requires investment:

    • Lighting: Flat, even lighting that shows the product clearly. This can be achieved with a north-facing window on a cloudy day (diffuse, even light source), a single LED ring light ($30 to $60), or a foam core reflector board ($3 to $5). A $3,000 studio lighting kit produces the same functional result for a 15-second product video.
    • Stabilization: Handheld shakiness is the fastest way to make a video look unprofessional. A basic phone tripod ($15 to $25) eliminates this entirely. For moving shots, a simple gimbal stabilizer costs $80 to $150.
    • Editing: Text overlays, transitions, music, and color grading all matter. Free options (CapCut, DaVinci Resolve) handle all of these. Paid options (Adobe Premiere, Final Cut) add efficiency for sellers who plan to produce regularly. Either way, the cost of editing software is not a barrier.

    The UGC Approach

    User-generated content style videos — shot to look like an authentic individual review or demonstration rather than a polished brand advertisement — have shown strong performance in SBV placements for certain categories. The authenticity signal of a UGC-style video can be effective in categories where shoppers are skeptical of brand claims (supplements, skincare, pet products, food). Platforms like Billo, Fiverr, and various UGC creator marketplaces can connect brands with content creators who produce short product videos for $50 to $200 per asset. For brands that haven’t yet built internal video capability, this is a low-risk entry point.

    Script-First, Shoot-Second

    The single most valuable investment in SBV production is scripting time. Before any camera is picked up, the video should be mapped second-by-second: what is on screen at 0 seconds, at 2 seconds, at 5 seconds, at 10 seconds, at 14 seconds. What text overlays appear and when. What the voiceover says and what visual it’s paired with.

    This level of pre-production planning sounds excessive for a 15-second video. It isn’t. A 15-second video that hasn’t been scripted at the second level is a 15-second collection of hopefully related shots, and that’s exactly what most failing SBV creatives look like. A scripted video has intentionality at every moment, and intentionality is the single biggest driver of SBV performance that doesn’t show up in production budgets.

    The Competitive Defense Dimension: Why SBV Is Also a Moat

    Most of the conversation around SBV centers on customer acquisition — using video to introduce your product to shoppers who don’t yet know it exists. That’s valid and important. But there’s a second function of SBV that receives far less attention: brand defense.

    Competitors Are Already Targeting Your Customers

    Amazon’s advertising system allows any brand to target competitor keywords and ASINs. This means that when a shopper searches your brand name — someone who already knows you, possibly a loyal customer — your competitors can serve SBV ads to that shopper. Without your own branded keyword SBV campaigns running, you are leaving your most valuable search real estate undefended.

    The math here is stark. If a competitor is running SBV ads on your branded keywords, shoppers searching specifically for your brand see a competing product in motion before they find you. Some percentage of those shoppers — particularly those who were considering repurchasing but hadn’t fully committed — will be diverted. The cost of losing an existing customer to a competitor who outbid you on your own brand name is almost always higher than the cost of the defensive SBV campaign bid.

    Category Presence as Barrier to Entry

    For established brands in competitive categories, maintaining SBV presence across top-volume category keywords creates a form of brand recall that accumulates over time. Shoppers who see your product in motion — even without clicking — register your brand in the context of that category search. Repeated exposure across multiple shopping sessions builds the kind of familiarity that affects organic purchase decisions. This is awareness advertising’s long game, and SBV on Amazon is one of the few places it can be played against in-market shoppers with documented purchase intent.

    New entrants to a category can use SBV aggressively to establish presence in the same way that traditional advertising spend built brand recognition — but compressed into a channel where every impression is attached to a specific category search. A brand that runs consistent SBV campaigns against its core category keywords for 12 to 18 months is building something that a competitor who enters later will need significant spend to overcome.

    Conclusion: The Seconds That Compound

    Amazon Sponsored Brand Video is, in aggregate, a deceptively simple ad format. You create a short video. You target keywords. You pay when shoppers click. The mechanics fit in a paragraph. But the gap between understanding the mechanics and running campaigns that actually perform is wide, and it’s filled with creative missteps, targeting mismatches, measurement blind spots, and production assumptions that don’t hold up in practice.

    The brands that make SBV work are thinking about it differently. They’re not asking “how do we make a great video?” They’re asking “what does a shopper who searched this keyword need to see in the first second to stay and watch?” They’re treating each second of video as a deliberate piece of decision architecture rather than a creative canvas. They’re measuring NTB rates and VCR alongside ACoS. They’re running branded keyword defense alongside category acquisition. They’re testing hooks on smartphones before commissioning polished productions.

    The format rewards that kind of thinking disproportionately. A brand with a $2,000 SBV production budget and a well-scripted, intentionally structured video will consistently outperform a brand with a $20,000 production budget and a logo-first brand film. The shopper in the search results doesn’t know what the video cost. They know if it answered their question in the first two seconds.

    For sellers who haven’t yet committed to SBV, the competitive argument is strengthening. Video content in search results is becoming an expectation rather than a novelty. The categories where SBV hasn’t yet been widely adopted are narrowing. The cost of entry — in both production and advertising spend — is lower than it has ever been. The window for building SBV brand presence before your category becomes saturated with video ads is real, and it won’t stay open indefinitely.

    Run one campaign. Script it carefully. Measure the right metrics. Let it run long enough to generate data. Then iterate from what you learn. The seconds add up.

  • Amazon A/B Testing for Images: How to Run a 7-Day Sprint That Actually Teaches You Something

    Amazon A/B Testing for Images: How to Run a 7-Day Sprint That Actually Teaches You Something

    Most Amazon sellers who run image A/B tests are doing it backwards. They create a new photo, swap it in, watch the first week’s numbers, declare a winner or a loser, and move on. Sometimes they get lucky. More often, they collect a data point that doesn’t actually mean what they think it does — and build future creative decisions on a foundation that was never stable to begin with.

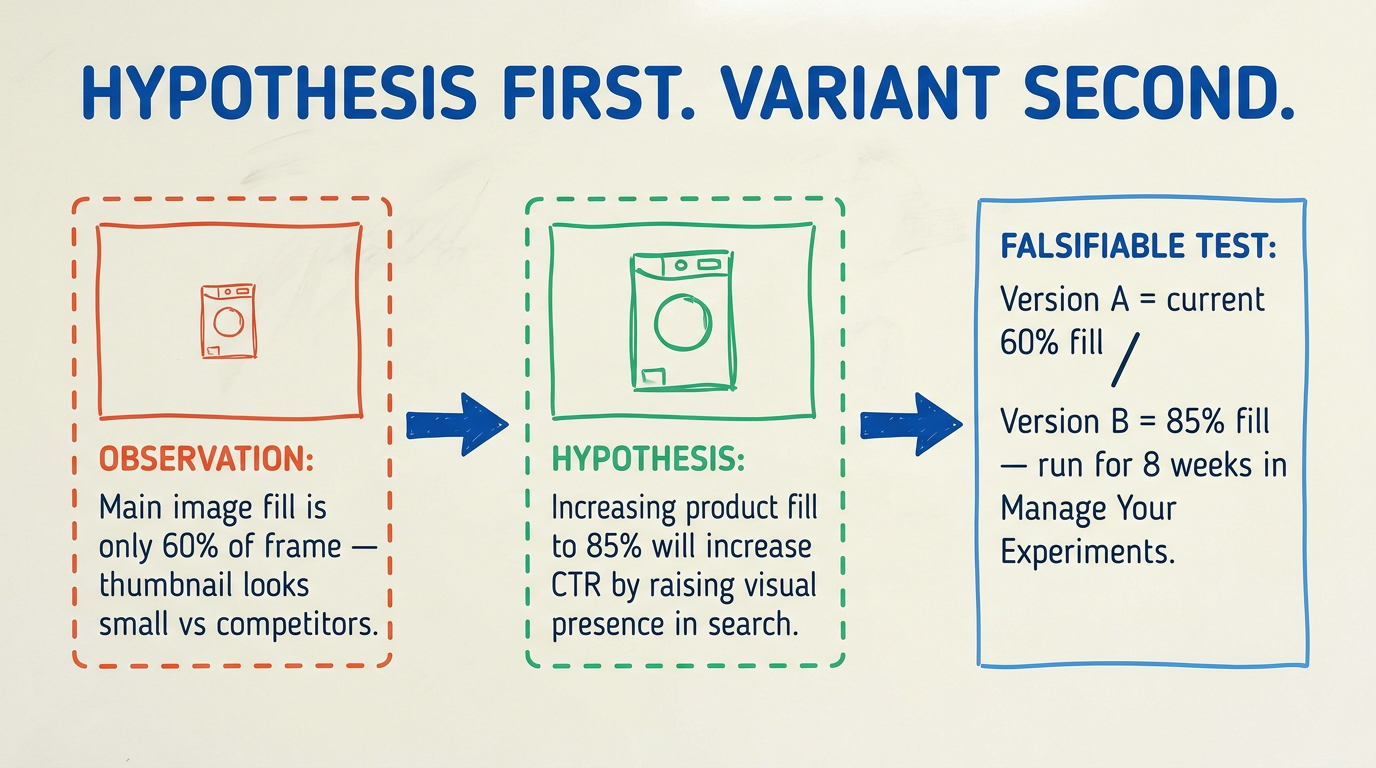
    The “7-day sprint” concept for Amazon image testing has real value, but not for the reason most people assume. Seven days is not enough time to reach statistical significance on a live Amazon experiment for most ASINs. Amazon’s own guidance recommends 8 to 10 weeks for Manage Your Experiments to reach 95% confidence. What seven days is enough time for is building the infrastructure around your test — the hypothesis, the variant design, the pre-flight validation, the launch protocol, and the early-signal monitoring discipline that separates sellers who learn from their experiments from those who just generate expensive confusion.

    This post treats the 7-day sprint for exactly what it should be: a structured operational ramp. Day by day, you’ll build a test that is worth running — one with a falsifiable hypothesis, properly isolated variables, a clean launch inside Manage Your Experiments, and a reading framework that won’t mislead you when the early numbers come in. By the time you finish the sprint, your experiment will be live and well-configured. The data will then do its work over the following weeks, giving you a result you can actually act on.

    That’s a meaningfully different outcome than most sellers are getting right now.

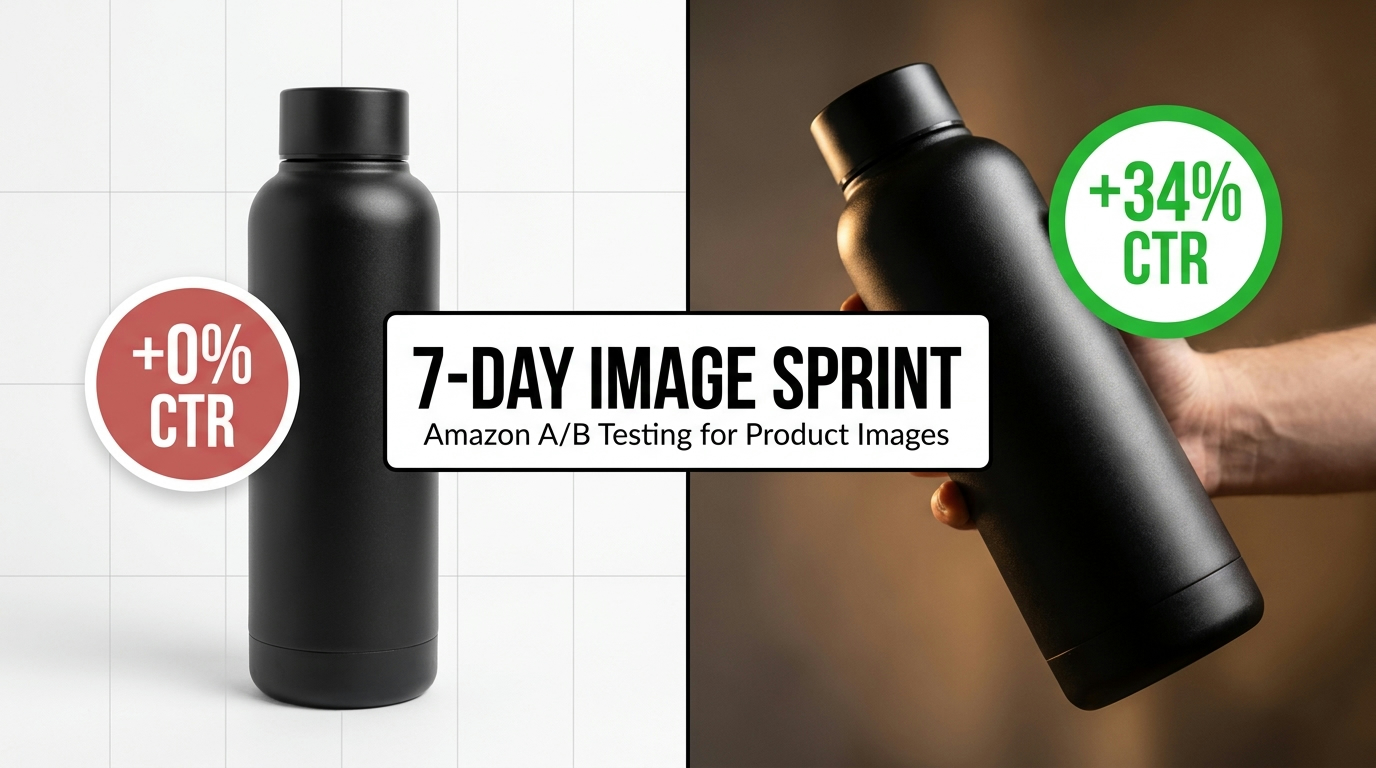
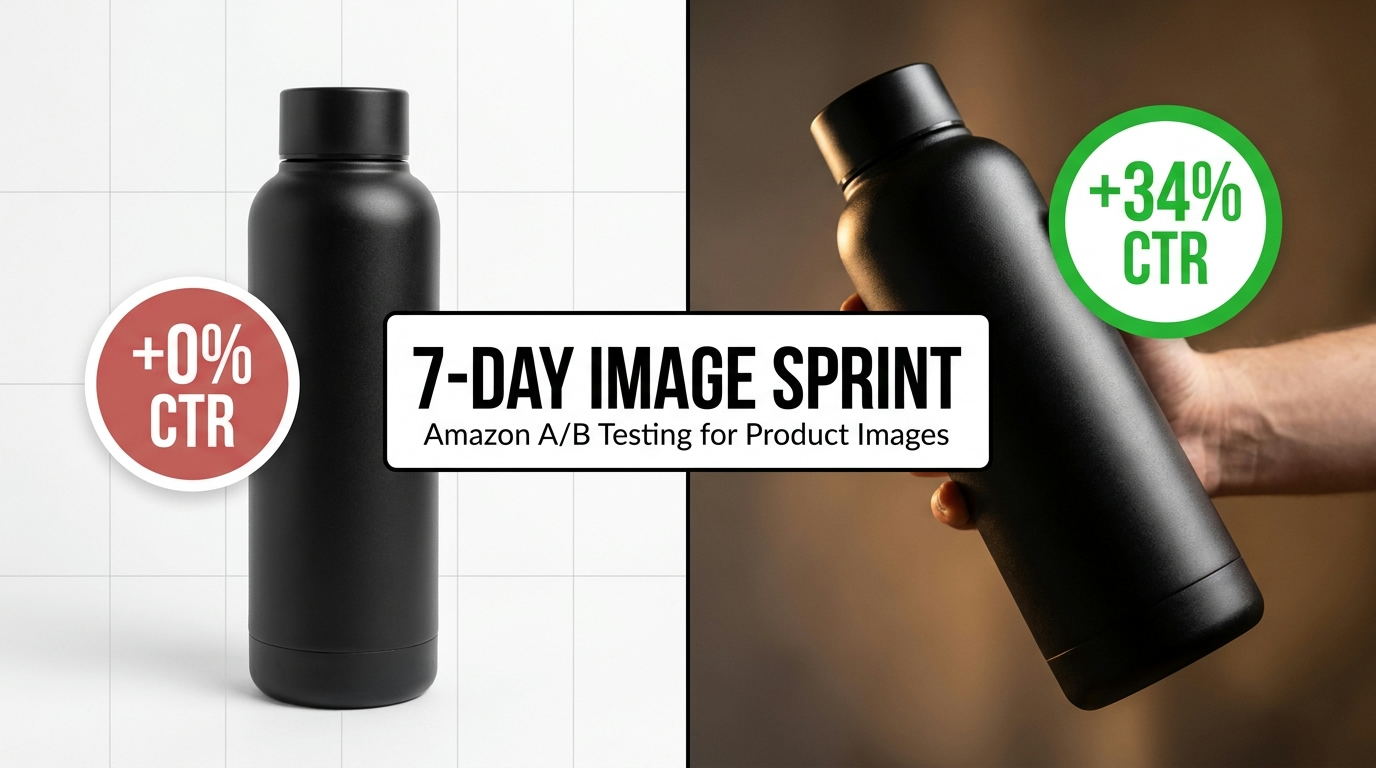
    Split-screen Amazon product image A/B test comparison showing CTR impact of main image optimization — 7-Day Image Sprint

    Why Images Are the Highest-Leverage Variable You’re Not Testing Rigorously

    There is a hierarchy of leverage on Amazon, and images sit near the top of it — especially the main image. Before a shopper reads your title, before they see your price, before any bullet point or A+ content has a chance to do its job, your main image has already made or broken the click. In a typical Amazon search results page, the thumbnail grid gives each product roughly 300 milliseconds of attention from a shopper scanning vertically. Your main image is the entire argument you make in that window.

    Mobile funnel infographic showing 79% of Amazon shoppers browse on mobile and main image drives click decision in search results

    The Mobile Compression Problem

    As of 2026, approximately 79% of Amazon shoppers browse on mobile devices. That figure has direct consequences for how you think about image quality. A product photo that looks impressive on a 27-inch desktop monitor — rich in detail, layered in texture, professionally lit — may render as a muddy, indistinct smear at the 160×160 pixel size of a mobile thumbnail. The detail you spent money on becomes noise. What survives compression is contrast, product fill, and silhouette clarity.

    This is why simplified hero images — high product fill (roughly 85–90% of the frame), clean backgrounds, strong lighting contrast — consistently outperform elaborate compositions in mobile-first testing contexts. One 2026 practitioner review covering 40+ image A/B tests reported a 0.4 percentage-point average CTR lift from simplified hero images, with simplified variants winning in approximately 72% of head-to-head tests against more visually complex alternatives. That may sound like a small lift, but across a catalog of high-traffic ASINs, a 0.4-point CTR improvement compounds into significant incremental revenue.

    The Conversion Multiplier

    The main image does double duty. It drives CTR in search, but once a shopper lands on your product detail page, the gallery as a whole — main image plus secondary slots — continues the conversion argument. A back-to-school study covering 847 ASINs and 2.4 million impressions found a 34% CTR lift from optimized images. Practitioner-reported conversion lifts from image changes range from 2–10% on well-optimized listings to 5–25% when the baseline image is notably weak, with occasional outliers above 40% on ASINs where the original photo was genuinely poor quality.

    The point is not that any image change will generate dramatic results — it won’t. The point is that image quality is one of the few levers that affects both top-of-funnel behavior (search CTR) and bottom-of-funnel behavior (product page conversion) simultaneously. That dual impact is what makes rigorous image testing so important and so often neglected by sellers who treat photography as a one-time launch expense rather than an ongoing optimization variable.

    Why Sellers Don’t Test Images Rigorously

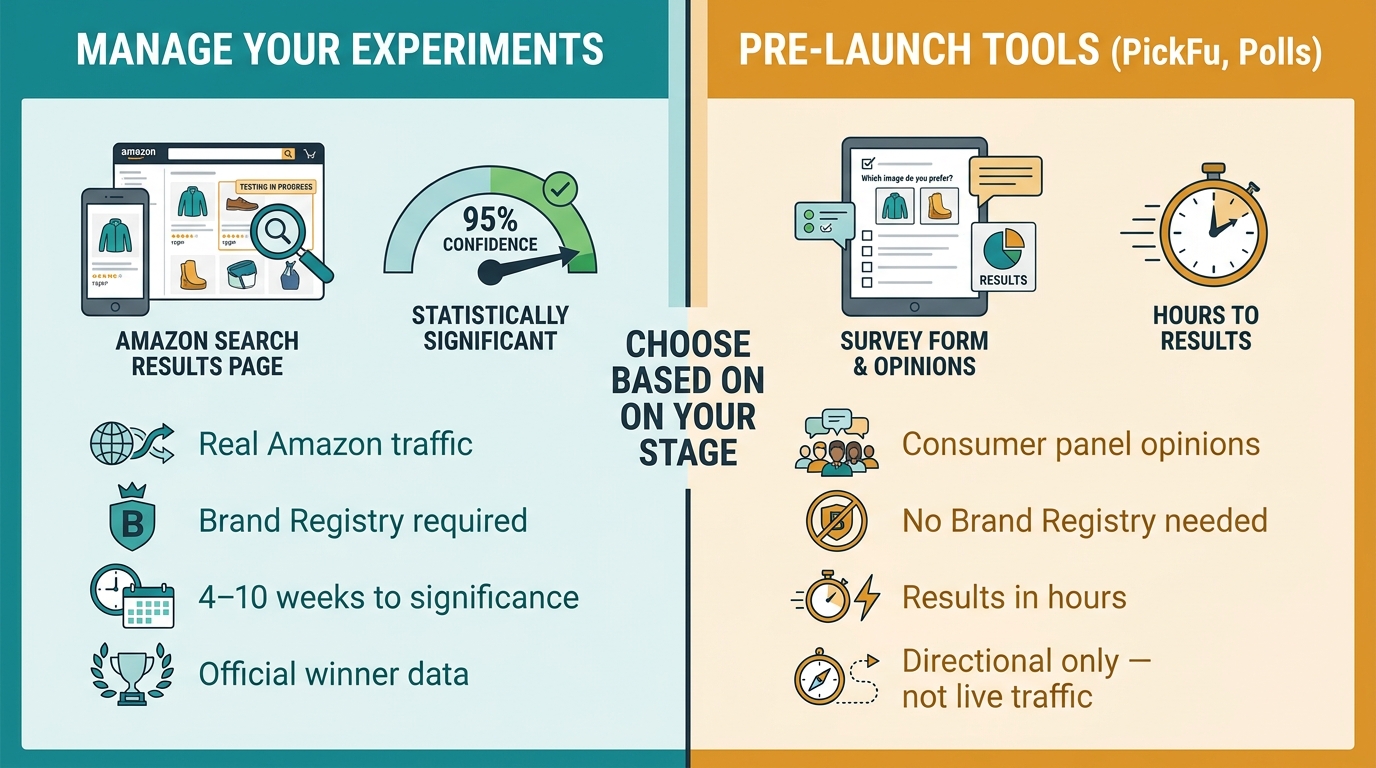
    Most sellers cite three reasons: they don’t know what to test (so they test everything at once and learn nothing), they don’t want to wait 8–10 weeks for results (so they stop early and get noise instead of signal), or they don’t have Brand Registry access to use Manage Your Experiments (so they run informal sequential tests that can’t control for time-based confounds). The 7-day sprint framework addresses all three of these directly. It forces a clear hypothesis before any creative work begins, it structures the launch so the experiment is built to run correctly for as long as it needs to, and it provides an external pre-launch track for sellers who haven’t yet qualified for Manage Your Experiments.

    What “7 Days” Actually Means in This Context

    To be explicit about what this framework is and is not: the 7-day sprint is a preparation and launch protocol, not a completion window. At the end of seven days, you will have a correctly structured experiment running inside Amazon’s native testing infrastructure. The experiment will then continue for however long it needs to reach statistical significance — typically 8 to 10 weeks for most eligible ASINs, potentially longer for lower-traffic products.

    Why Amazon Recommends 8–10 Weeks

    Amazon’s recommended experiment duration isn’t arbitrary. To reach 95% confidence — the standard significance threshold — you need enough observations to make the difference between variants statistically reliable rather than a product of random variation. The required sample size depends on your baseline conversion rate and the minimum lift you need to detect. For a product converting at 8% with a goal of detecting a 2-percentage-point improvement, you need roughly 2,500–3,000 sessions per variant. At 300 weekly sessions — the practical minimum for a meaningful experiment — that takes approximately 8–10 weeks to accumulate for each side of the test.

    ASINs with fewer than 100 weekly sessions are unlikely to qualify for Manage Your Experiments at all. Amazon requires a minimum volume of recent traffic — seller forum reports generally cite 1,000 detail page views in the preceding 30 days as a typical eligibility threshold, though Amazon has not published a universal public floor. If your ASIN doesn’t meet that bar, there’s a parallel workflow using pre-launch panel tools like PickFu that can still generate directional insight at much faster timescales. Both tracks are covered in this framework.

    The Sprint’s Actual Job

    The sprint disciplines the work that happens before an experiment goes live. Most failed Amazon image tests fail because of decisions made before the test starts — bad hypothesis, untested variants, wrong variable isolation, missing baseline documentation. By dedicating seven structured days to getting those decisions right, you dramatically increase the probability that the data you collect over the following weeks will be interpretable, credible, and actionable. The sprint is quality control for your experiment design. Think of it as an investment in the signal-to-noise ratio of results you won’t see for two months.

    Day 1–2: Audit, Hypothesis, and the One-Variable Rule

    The first two days of the sprint are entirely analog. No new photography, no Canva files, no Photoshop. Just an honest audit of your current listing images and the development of a single, falsifiable hypothesis that will guide everything that follows.

    Whiteboard diagram showing the three-part anatomy of a good Amazon image A/B test hypothesis — observation, hypothesis, falsifiable test

    The Current-State Audit

    Start by documenting the baseline state of your listing before anything changes. This sounds obvious but is routinely skipped, which means sellers have no clean reference point when results come in. Record your current conversion rate, your session count over the past 30 days, and your unit session percentage — Amazon’s term for units sold per unique visitor, which is one of the primary metrics Manage Your Experiments reports. Pull this from your Business Reports in Seller Central (Reports → Business Reports → Detail Page Sales and Traffic by ASIN).

    Next, audit the visual itself. Look at your main image at thumbnail size — not full resolution, but at roughly 160×160 pixels, which is approximately how it renders on a mobile search results page. Ask these questions: Is the product clearly identifiable at this size? Does it fill at least 80% of the frame? Does it have a clean white background that reads as pure white (RGB 255,255,255), not slightly gray or cream? How does it look against the three or four adjacent products in a typical search results grid for your main keyword?

    Also audit your competitors. Take a screenshot of your main keyword’s search results page on mobile and study the visual patterns of the top 10 results. Are the top performers using isolation shots, lifestyle angles, or infographic-style compositions? Is there a consistent visual expectation in your category, and does your image meet it — or could there be an opportunity to differentiate meaningfully without violating compliance rules?

    Writing the Hypothesis

    A hypothesis for an image test has three parts: an observation about the current image, a specific claim about what you expect to change if you alter one variable, and a falsifiable test design with explicit pass/fail criteria. Here’s an example of a weak hypothesis versus a strong one:

    Weak: “Our new lifestyle photo looks better and will probably convert more.”

    Strong: “Our current main image shows the product at approximately 65% frame fill against a slightly off-white background. Our hypothesis is that increasing fill to 85% on a pure white (255,255,255) background will increase unit session percentage by at least 1.5 percentage points within 8 weeks of the experiment. Pass condition: Version B achieves ≥1.5pp lift at ≥90% probability to beat control. Fail condition: <1pp lift or negative result at any significance level.”

    The difference is specificity and accountability. A strong hypothesis tells you, before the test starts, exactly what result would confirm or refute your expectation — which means you can learn from the result regardless of which way it goes. A weak hypothesis just records what happened without generating any insight about why.

    The One-Variable Rule

    This cannot be overstated: test exactly one visual variable at a time. Changing your product angle, your background, your lighting, and your prop styling all in one test creates a result you cannot interpret. If the new image wins, which change drove the lift? You don’t know. If it loses, what specifically failed? You don’t know that either. You’ve spent 8–10 weeks collecting a data point that tells you nothing learnable.

    The one-variable rule feels inefficient. It means your testing roadmap will take months to work through multiple hypotheses. That’s the correct pace for a discipline that produces reliable cumulative knowledge. The shortcut — testing bundles of changes — feels faster and produces worthless results faster. Pick one variable. Test it properly. Move to the next.

    Day 3–4: Variant Creation and Pre-Flight Validation

    With a clear hypothesis and one isolated variable defined, Days 3 and 4 are for producing the challenger variant and running it through a systematic pre-flight check before it goes anywhere near a live listing.

    Producing the Challenger Variant

    The challenger should be materially different from the control on exactly the one variable you’re testing. Amazon’s own guidance emphasizes “materially different” variants — minor tweaks that differ by a few pixels or a slightly different crop rarely generate enough signal to be detectable within a reasonable experiment window. If you’re testing product fill, the difference should be visually obvious when you place the two images side by side. If you’re testing angle, the rotation should be genuinely distinct — not a 5-degree shift, but the difference between a straight-on face shot and a 30-degree 3/4 angle.

    For the main image specifically, Amazon’s compliance rules require a pure white background (RGB 255,255,255 or very close), the product filling the majority of the frame, no text overlays, no watermarks, no props that obscure the product, and no lifestyle context that replaces the product focus. Your challenger must comply with all of these requirements or it risks suppression — which would end your experiment prematurely and corrupt your results in the worst possible way.

    The Pre-Flight Checklist

    Before uploading either version to Manage Your Experiments, run each image through this five-point check:

    1. Thumbnail test: Resize both images to 160×160 pixels. Is the product clearly identifiable in both? Is there a visible difference between the versions at this size? If not, the variants may not be materially different enough to detect a meaningful signal.
    2. Mobile SERP simulation: Screenshot your target keyword’s search results on a mobile device. Paste your current main image and your challenger into the grid at thumbnail size. How does each version look against actual competitors? Does the challenger look better, worse, or just different?
    3. Compliance check: Verify background RGB value (use an eyedropper tool — off-white backgrounds are a common compliance failure), confirm no text overlays, confirm product fill percentage, and check that the product is clearly the focus of the frame.
    4. File spec check: Amazon requires main images to be at least 1,000 pixels on the longest side (for zoom functionality), in JPEG, PNG, GIF, or TIFF format, with a file size under 10MB. Verify both images meet these specifications.
    5. External validation (optional but recommended): If you want a fast directional signal before committing to an 8-week live test, run the two images through a consumer panel tool like PickFu. Select an audience that matches your target customer demographic and ask a simple preference question tied to your hypothesis. A panel of 50–100 respondents can return results in a few hours. This won’t replace a live experiment — panel preferences don’t always align with actual purchase behavior — but it can filter out clearly inferior challengers before you spend weeks testing them on real traffic.

    Day 5: Launching Inside Manage Your Experiments — The Right Way

    Day 5 is when you configure and launch the experiment inside Seller Central. The setup process is straightforward, but there are several configuration decisions that will materially affect the quality of your results.

    Comparison infographic of Amazon Manage Your Experiments vs pre-launch tools like PickFu showing when to use each for image testing

    Accessing Manage Your Experiments

    In Seller Central, navigate to Brands → Manage Your Experiments. If you don’t see this option, confirm that your brand is enrolled in Amazon Brand Registry and that you are logged in with an account that has Brand Representative or Administrator access. Manage Your Experiments is available exclusively to Brand Registry members — it is not accessible to resellers, wholesale accounts, or non-registered private label sellers.

    From the Manage Your Experiments dashboard, click “Create a New Experiment” and select “Product Images” as the experiment type. Select the ASIN you’ve been preparing. Amazon will display the ASIN’s current content and its eligibility status. If the ASIN shows as ineligible, it is most likely because it has insufficient recent traffic — below the 1,000 detail-page-view-per-30-days threshold. In that case, skip to the parallel workflow described in the next section.

    Configuration Decisions That Matter

    Duration: When Amazon asks you to set a duration, do not select the shortest available window. Set the experiment for the full 8–10 weeks Amazon recommends. You can end the experiment early if it reaches 95% confidence before that point, but setting a short duration up front creates pressure to peek early — which is one of the most common ways experiments produce false results.

    Traffic split: The default 50/50 traffic split is correct for most image tests. Unequal splits are sometimes used when you want to minimize exposure of an unproven variant, but for image testing, a 50/50 split maximizes your rate of data collection and gets you to significance faster.

    Auto-apply winner: Amazon offers an option to automatically apply the winning version when the experiment ends. Whether to enable this depends on your operational workflow. Auto-apply is convenient but means a variant could go live without your team reviewing the result. For most sellers with active catalog management, manually reviewing results before publishing the winner is the safer practice.

    What NOT to change during the experiment: Once the experiment is live, you must not change your price, run coupons or Lightning Deals, launch significant PPC campaigns, change your title, or make any other listing edits that could influence conversion independently of the image change. Any of these will introduce confounders that make it impossible to attribute the result to the image. Set a reminder on Day 5 and a standing rule for your team: this ASIN is in experiment mode. No changes without sign-off.

    If Your ASIN Doesn’t Qualify for Manage Your Experiments

    Not every ASIN will meet the traffic threshold. For lower-volume products, a legitimate alternative is a sequential manual test: run Version A as your main image for four weeks, record your conversion rate and unit session percentage, swap to Version B for the next four weeks under the same external conditions, and compare. This approach cannot randomize traffic the way Manage Your Experiments does — the two periods may differ in seasonality, ad spend, or organic ranking — which is why it produces directional insight rather than statistically clean results. It’s not ideal, but it’s far better than making no measurement at all. Document everything: session counts, external events, PPC changes, and any price movements.

    Days 6–7: Early Signal Monitoring Without Being Fooled by It

    On Days 6 and 7, your experiment is live and accumulating its first traffic. The temptation to read the results and declare a winner is significant. Resist it. Here’s why early data is nearly always misleading, and what you should actually be watching instead.

    The Peeking Problem

    Statistical significance has a counterintuitive property: if you check your results multiple times during an experiment and stop when you see a significant result, you dramatically inflate your false positive rate. A 5% false positive rate (95% confidence) assumes you look at the data once, at the end of the predefined experiment window. Every time you peek during the experiment and consider stopping early based on what you see, you increase the probability that a “winner” is actually a random fluctuation. Amazon’s Manage Your Experiments is designed to handle this by reporting a “probability to beat control” metric that updates weekly — but the tool explicitly cautions against using early probabilities as decision points.

    The practical discipline is this: check the experiment dashboard weekly to confirm the test is running correctly — that sessions are accumulating, that both versions are being served, and that no external disruptions have contaminated the data. But do not make any decision about the result until the experiment has either run to completion or reached Amazon’s declared significance threshold.

    What Early Data Is Good For

    Early data can tell you several useful things that don’t require statistical significance to be meaningful:

    • Is the experiment serving correctly? If one variant is receiving dramatically more sessions than the other — significantly more than a 50/50 split — something may be wrong with the experiment setup. Check for listing suppression issues, indexing problems, or ad spend heavily skewed toward one version.
    • Are there external disruptions? If you see a sudden spike or crash in sessions during the first week, it may indicate a ranking change, a competitor going out of stock, an ad campaign spike, or a review event. Document these and factor them into your interpretation when results come in.
    • Is your baseline stable? If the control version is converting at a dramatically different rate than your pre-experiment baseline, something has changed externally. Investigate before the noise compounds over weeks.

    None of this requires making a decision about which image is winning. It’s experiment hygiene — making sure the test is running in conditions clean enough to produce a trustworthy result.

    The Metrics That Actually Matter — And the Ones That Mislead

    When your Manage Your Experiments results page loads after 8–10 weeks, you will see several metrics. Not all of them deserve equal weight. Understanding which metrics to lead with and which to treat as supporting context is what separates sellers who make good decisions from experiment data versus those who cherry-pick numbers that confirm what they already wanted to believe.

    Amazon Manage Your Experiments results dashboard showing conversion rate lift, units per visitor, and projected annual sales impact for image A/B test

    Lead Metrics: Unit Session Percentage and Conversion Rate

    Unit session percentage (units sold per unique visitor) is Amazon’s primary experiment metric and the one to lead with. It captures the downstream revenue impact of the image change, not just whether people clicked or engaged. An image that increases clicks but attracts the wrong shoppers may actually decrease unit session percentage — a real-world scenario that happens when, for example, a lifestyle main image attracts broader-intent shoppers who were never close to buying your product specifically.

    Conversion rate is closely related and complements unit session percentage. The goal of a main image test is to attract shoppers who are more likely to buy, not simply more shoppers. If your challenger image generates a higher conversion rate at a similar session volume, it’s doing its job. If it generates a higher session count but a lower conversion rate, the net effect may be neutral or negative.

    Supporting Metrics: Sessions and Sales

    Sessions tell you whether the image change affected how many shoppers landed on your product detail page — reflecting CTR in search results. An increase in sessions alongside a maintained or improved conversion rate is the ideal outcome. A large increase in sessions paired with a sharp drop in conversion rate is a warning sign: the new image may be attracting shoppers whose intent doesn’t match your product.

    Sales and units sold are the ultimate outcome metrics, but they can be noisy over an 8–10 week window due to external factors. Weight them alongside conversion rate rather than treating raw sales numbers as the definitive indicator.

    The Projected Annual Sales Impact: Useful but Treat with Caution

    Amazon calculates a “projected one-year sales impact” for the winning variant. This is a useful framing for communicating the business case for image testing to stakeholders — a projected annual lift of $40,000–$50,000 on a single ASIN makes a compelling argument for investing in professional photography. But treat the projection as directional, not precise. It extrapolates from 8–10 weeks of data to a 52-week future, without accounting for seasonality, competitor actions, ranking changes, or pricing shifts. The direction of the projection (positive or negative) is more reliable than the specific dollar figure.

    What to Do with an Inconclusive Result

    An inconclusive result — where the experiment ends without reaching 90–95% confidence in either direction — is a legitimate and common outcome. It does not mean the test failed. It means neither image is meaningfully better than the other on the metrics measured, which is itself useful information: you don’t need to invest resources in replacing the current image for this specific variable. Revisit your hypothesis and consider whether the variable you tested was the right one, whether your variants were sufficiently different, or whether a different slot in the gallery (rather than the main image) might generate more signal.

    Why Amazon Image Tests Fail — The Real Breakdown

    Understanding failure modes isn’t pessimistic. It’s the most efficient way to avoid them. Amazon image tests fail for a predictable set of reasons, and most of them are preventable with the right design discipline.

    Warning report card infographic showing five common reasons Amazon image A/B tests fail including bad hypothesis, early stopping, and mobile blindness

    Failure Mode 1: The Untestable Hypothesis

    The single most common failure is running an experiment without a falsifiable hypothesis. “Let’s see if the new image does better” is not a hypothesis. Without a specific expectation — what metric should improve, by how much, and why — you cannot interpret the result. A test that “wins” by 1% with 70% confidence can be declared a winner by an optimistic seller and a non-result by a rigorous one. The hypothesis is what makes the interpretation unambiguous.

    Failure Mode 2: Multiple Variables Tested Simultaneously

    Sellers frequently change the background, the angle, the lighting, and the composition in one “test.” When this composite variant wins or loses, the result tells you nothing about which change mattered. You’ve generated a data point that cannot be learned from — and you’ve spent 8–10 weeks collecting it. This is the most expensive form of bad experiment design because the opportunity cost is so large: you could have run a single-variable test, learned something definitive, and been one step further along your optimization roadmap.

    Failure Mode 3: Stopping Early

    Checking the experiment after two weeks and stopping when the challenger appears to be ahead is one of the most reliable ways to generate false positives. Early-running leads are common and frequently reverse over longer windows as the sample normalizes. Amazon’s own experiment dashboard shows weekly updates, but it explicitly notes that early results should not be used as decision points. If the temptation to stop early is strong, set a calendar reminder to review on your predetermined end date — and don’t open the dashboard more than once a week before that.

    Failure Mode 4: Testing During Promotional Periods

    Prime Day, Black Friday, Cyber Monday, holiday seasons, and brand-specific promotions all distort conversion behavior in ways that are unrelated to your image. If your experiment runs across Prime Day, the spike in conversion during that event may swamp the image signal, making the data from that period unreliable. Plan your experiment windows to avoid major promotional events, or adjust your analysis to exclude promotional windows if you couldn’t avoid them.

    Failure Mode 5: Ignoring Mobile Thumbnail Behavior

    Testing an image that looks excellent on a desktop detail page but hasn’t been evaluated at mobile thumbnail size is one of the more subtle failure modes. An elaborate composition with multiple elements — product, props, environment — may look compelling at 1,000×1,000 pixels and indistinct at 160×160. If your challenger was never evaluated at thumbnail size before launch, you may be testing an image that was always going to underperform in the mobile search context where most of your traffic originates.

    Failure Mode 6: External Confounders Left Uncontrolled

    A competitor going out of stock during your experiment may send a sudden surge of their traffic to your listing, temporarily inflating your conversion rate in ways unrelated to your image. A PPC campaign spike can increase traffic volume and distort conversion. A review received during the experiment window can shift buyer sentiment. None of these can be fully prevented, but they should all be documented in a test log so that unusual periods in the data can be contextualized during interpretation. A simple weekly note — “Week 3: competitor B0XXXXXXX went OOS, traffic up 40%” — can prevent a false winner from being published based on a contaminated window.

    Beyond the Main Image: What to Test in Secondary Slots

    The main image gets the most testing attention because it has the most direct impact on search CTR. But the secondary image slots — positions 2 through 7 in your gallery — are where the conversion argument happens for shoppers who’ve already clicked. These slots are underutilized as testing surfaces, partly because Manage Your Experiments supports them less explicitly and partly because sellers often treat them as a one-time creative decision. Both assumptions are worth challenging.

    Visual guide to Amazon listing secondary image slots showing what to test in each position including lifestyle, infographic, scale, and social proof images

    What Secondary Images Are Actually Doing

    Each slot in your secondary gallery is answering a specific buyer question. Slot 2 typically functions as the first context image — it answers “what does this look like in use or in my environment?” Slot 3 usually addresses the product’s primary feature or differentiating benefit. Slots 4–6 handle supporting proof points: scale, ingredients or materials, social validation (star rating callouts or “X reviews” badges), use case breadth, and comparison with alternatives.

    The buyer questions being answered in each slot are where your hypothesis for secondary image tests should originate. If your conversion rate is below category average and your main image is already strong, the bottleneck is likely in the detail page — shoppers are clicking but not converting. That’s when secondary image optimization becomes the highest-leverage work available.

    Highest-Value Secondary Image Tests

    The most frequently productive secondary image tests, in rough order of leverage:

    • Lifestyle vs. studio styled in Slot 2: Does seeing the product in a real-world context (kitchen counter, gym bag, desk setup) improve conversion versus a clean studio composition? Categories where lifestyle wins vary significantly — this is worth testing rather than assuming.
    • Minimal infographic vs. detailed infographic in Slot 3: Some audiences respond to clean callout graphics with one or two highlighted benefits. Others prefer comprehensive spec overlays. The right answer depends on your buyer’s knowledge level and purchase motivation.
    • Scale reference format in Slot 4: A hand-held product vs. a ruler graphic vs. a size comparison to a common object — all communicate scale differently and resonate differently with different audiences. Size misunderstanding is one of the most common drivers of returns, making this a high-impact slot to optimize.
    • Gallery order tests: Does moving your lifestyle image from Slot 3 to Slot 2 change conversion? Does leading with your infographic before your lifestyle image improve or reduce performance? Gallery order affects what shoppers see first when they swipe through the gallery — and most sellers have never tested whether their current order is optimal.

    Running Secondary Image Tests Without Manage Your Experiments

    Manage Your Experiments supports testing of product images generally, but the interface is primarily oriented around main image testing. For secondary image slot tests — particularly gallery order — the most practical approach for many sellers is a manual sequential test using the methodology described earlier (run Version A for four weeks, Version B for four weeks under comparable conditions) combined with careful session-level analysis using your Business Reports data. The controls are weaker, but the insight can still be significant enough to justify image investment decisions.

    Scaling Winners Across a Catalog

    Most image testing guides treat individual ASIN tests as the end point. But the real leverage from a rigorous testing program comes from generalizing what you learn across related ASINs — using one confirmed insight to improve image quality across dozens or hundreds of products without re-running the full 8–10 week experiment on each one.

    The Generalization Protocol

    When an image test produces a confirmed winner with ≥90% probability to beat control, the first question to ask is: what’s the underlying principle that made this variant win? If increasing product fill from 65% to 85% drove a 2.3-percentage-point conversion lift on ASIN A, does the same principle apply to ASINs B through Z in the same category? In most cases, yes — if the category and audience are similar, the underlying driver (thumbnail visibility, product prominence) is likely consistent.

    The scaling process looks like this:

    1. Identify the principle: Distill the winning test into a one-sentence creative rule. “85% fill on a pure white background outperforms 65% fill for single-product hero shots in the fitness accessories category.”
    2. Segment your catalog: Identify all ASINs that share the relevant characteristics (same category, similar product type, similar audience, similar traffic profile).
    3. Apply the principle: Update the images on these ASINs to reflect the confirmed principle without running a full experiment on each. This is an informed creative update, not a blind change — it’s grounded in a tested result.
    4. Spot-check with experiments: Run Manage Your Experiments on a sample of 2–3 high-traffic ASINs from the scaled group to confirm the principle generalizes as expected. If the principle doesn’t replicate on different ASINs, investigate whether there’s a meaningful audience or product difference that changes the result.

    Building a Testing Roadmap

    A catalog of 50 ASINs tested one-at-a-time, in sequence, at 10 weeks per test, would take nearly a decade to work through. That’s clearly not the goal. The goal is a testing program that generates principles efficiently. The realistic structure is:

    • Run 3–5 simultaneous experiments on your highest-traffic ASINs from different product categories, so you’re collecting multiple data streams in parallel.
    • Rotate in new experiments as previous ones complete, maintaining a steady cadence of active tests.
    • Generalize confirmed principles immediately to related ASINs rather than waiting to test each one.
    • Reserve full experiments for ASINs where you have reason to believe the principle may not apply directly — different audience, different price point, different purchase motivation.

    At this pace, a brand with 50 ASINs and 5 concurrent tests can develop a well-grounded image optimization framework across the full catalog within 12–18 months. That’s a meaningful improvement over the “update when we feel like it” approach most sellers use.

    What a Well-Run Testing Program Looks Like at 90 Days

    Ninety days is approximately the minimum horizon at which a rigorous image testing program starts producing compounding value. At 90 days, you should have completed at least one full experiment (potentially two for higher-traffic ASINs), have a second cohort of experiments in progress, and have applied any confirmed principles to the related ASINs in your catalog.

    The Documentation Stack

    Every experiment should be accompanied by a documentation record that includes: the hypothesis and its origin (why this variable, why this ASIN), the variant descriptions and file references, the start date and planned end date, the baseline metrics at launch, a weekly log of external events during the experiment, the final result including confidence level and key metrics, and the decision made (publish winner, revert to control, run follow-up test). This documentation is your institutional memory. It prevents your team from running the same test twice, allows new team members to understand the rationale behind current image choices, and creates a research base you can reference when developing hypotheses for future tests.

    When to Call In External Help

    Image testing is a relatively specialized skill set that sits at the intersection of creative direction, data analysis, and Amazon platform mechanics. Most brands reach a point where the limiting factor is not the testing process itself but the supply of high-quality challenger variants to test. Professional Amazon photography that is specifically designed for split testing — with controlled variables, thumbnail-optimized compositions, and compliance-verified specs — significantly increases the quality of your experiment inputs and, by extension, the quality of your results. If your current image testing program is producing inconclusive results consistently, the most common root cause is insufficiently differentiated variants, not a flawed testing process.

    Practical Takeaways: The 7-Day Sprint Checklist

    The sprint framework distilled into an executable checklist:

    Day 1: Pull baseline metrics (conversion rate, unit session percentage, 30-day session count) for the target ASIN. Document the current main image at thumbnail size. Screenshot the mobile SERP for your main keyword.

    Day 2: Write a three-part hypothesis (observation + specific claim + falsifiable test with pass/fail criteria). Define the single variable you will isolate. Confirm the ASIN’s eligibility for Manage Your Experiments based on traffic threshold.

    Day 3: Brief the creative team or photographer on the specific variable to change and the constraints (compliance rules, one-variable rule, thumbnail priority). Confirm final specs for both the control and challenger versions.

    Day 4: Receive and run both images through the pre-flight checklist (thumbnail test, mobile SERP simulation, compliance check, file spec check). Run an optional PickFu panel poll if you want directional validation before committing to a live test. Document any filter-out feedback.

    Day 5: Configure and launch the experiment in Manage Your Experiments. Set duration to 8–10 weeks. Set traffic split to 50/50. Brief the catalog team on the experiment rules (no pricing changes, no PPC spikes, no other listing edits for this ASIN). Start the experiment log.

    Day 6: Verify the experiment is serving correctly — check that both variants are accumulating sessions at roughly equal rates. Document any early anomalies.

    Day 7: Set up the weekly check routine. Create a recurring calendar reminder to review the experiment dashboard weekly (not daily). Write the stop rule: “Do not make a decision based on results until the experiment runs to completion or reaches ≥90% probability to beat control with ≥2,500 sessions per variant.”

    The experiment is now live. Your 7-day sprint is complete. The data will do the rest of the work — if you give it the time it needs.

    Conclusion: Test Less, Learn More

    The paradox of Amazon image testing is that the sellers who run the most tests often learn the least. They test frequently but without rigor — swapping images on instinct, reading week-one numbers as conclusions, and building creative strategies on a foundation of confirmation bias and underpowered data. The sellers who run fewer, better-designed tests — with clear hypotheses, isolated variables, proper durations, and disciplined result interpretation — accumulate genuine knowledge that compounds across their catalog over time.

    The 7-day sprint is not a shortcut to fast answers. It’s a framework for building experiments that are worth running. The sprint itself takes seven days. The answers take 8–10 weeks. And the competitive advantage — a catalog of images that have been systematically validated against real Amazon traffic, using real purchase behavior, with statistically credible results — compounds indefinitely.

    Product photography is expensive. PPC spend is expensive. The cost of running a poorly designed image test is not the photography budget — it’s the 10 weeks of live traffic you spent generating a result you cannot interpret. The sprint framework is how you make sure that cost never gets wasted again.

    Start with one ASIN. Write one hypothesis. Test one variable. Let the data run. Then scale what you learn.

  • What Amazon’s Shifting Image Rules Actually Mean for Catalog Control, Brand Power, and What Comes Next

    What Amazon’s Shifting Image Rules Actually Mean for Catalog Control, Brand Power, and What Comes Next

    Amazon image policy 2026 — compliant vs. suppressed listing comparison

    Amazon has spent years publishing image requirements that most sellers skimmed, nodded at, and then quietly ignored. A slightly gray background here, an extra badge there, a resolution a few hundred pixels below the recommended minimum — and nothing happened. The listing stayed live, the ads kept running, the orders kept coming.

    That era is over.

    In 2026, Amazon’s approach to image compliance has shifted from passive guidance to active enforcement. The platform is suppressing listings, replacing images without seller permission, penalizing ranking velocity, and — for the first time — requiring explicit disclosure when AI tools have been used to create or substantially alter product visuals. For many sellers, this is the first time image quality has had a direct, measurable line to revenue loss rather than just a vague warning in Seller Central.

    But enforcement is only part of the story. The deeper shift is structural. Amazon is using image quality as a proxy for catalog authority — and who controls the images on a given ASIN is now, in many cases, a question with a clear legal answer that didn’t exist in previous years. Brand Registry, Brand Catalog Lock, and Amazon’s own image replacement capabilities have combined to fundamentally redraw the boundary between brand owner rights and reseller expectations.

    This post doesn’t rehash the basic checklist of white backgrounds and pixel counts. It goes deeper: into what the policy shift actually means for catalog control, who wins and loses in the brand-vs-reseller image war, how category-specific rules are changing the creative brief, where AI-generated imagery fits now and where it doesn’t, and what a genuinely future-proof image strategy looks like heading into the second half of 2026.


    From Suggestion to Suppression: How Amazon’s Image Enforcement Mechanism Changed

    Amazon image enforcement timeline from warnings in 2019 to automated suppression and brand image replacement in 2026

    To understand where Amazon image policy is in 2026, you have to understand where it was five years ago. Through most of 2019–2022, Amazon’s image guidelines functioned more like style recommendations than enforceable rules. Sellers who didn’t meet the white-background requirement would occasionally receive an email. Listings that used obviously misleading composite photos might get flagged through manual review. But the enforcement mechanism was slow, inconsistent, and largely reactive — triggered by complaints rather than automated crawls.

    That changed as Amazon invested heavily in automated listing quality systems. By 2024, machine-scored visual checks were flagging non-compliant images at scale. By Spring 2026, enforcement had shifted again — from flagging to acting.

    What “Active Enforcement” Now Looks Like

    The current enforcement framework operates across several escalating tiers. A first-tier violation — say, a main image where the product fills only 70% of the frame instead of the required 85% — may result in a listing quality warning and reduced visibility in search. A second-tier violation, such as a main image with a colored background or watermarks, now more reliably triggers automatic listing suppression, pulling the ASIN from search results until the image is corrected and re-indexed.

    The third tier is where 2026 has genuinely moved the goalposts: Amazon can now replace your non-compliant or lower-quality main image with an image from another seller’s contribution to the same ASIN’s catalog. This applies even to brand-registered sellers if another contributor’s image is deemed more compliant or higher quality. The implications of this are significant — and we’ll examine them in detail when we get to the brand-vs-reseller dynamic.

    The Re-Indexing Penalty Is the Hidden Cost

    Suppression is visible. Re-indexing delay is not — but it’s arguably the more damaging consequence for competitive listings. When a non-compliant image is fixed and a listing is reinstated, Amazon does not immediately return it to its previous search position. The re-indexing process can take anywhere from a few hours to several days, and during that window, the listing’s organic ranking signals decay. For high-velocity SKUs during peak demand periods, even a 48-hour visibility gap can translate directly into lost Best Seller Rank, reduced review velocity, and reduced ad efficiency as historical conversion data is disrupted.

    Repeat violations add an additional layer of risk: sellers who accumulate multiple image-related listing suppressions now face account-level risk flags, which can affect Account Health Rating scores, Best Seller badge eligibility, and in the most severe cases, broader suspension review.

    The Speed of the New Automated System

    Perhaps the most practically important change for sellers managing large catalogs is the speed of enforcement. Under the old system, a non-compliant image might persist undetected for weeks. Under the current automated scanning infrastructure, violations are typically detected within 24–72 hours of upload. For sellers managing hundreds or thousands of ASINs, this changes the risk calculus entirely — a bulk image upload that goes wrong can suppress dozens of listings simultaneously before a human has had a chance to review the output.


    The Resolution Ratchet — Why 1,600×1,600px Is the New Floor

    Amazon image resolution comparison: old 1000x1000px minimum vs new 1600x1600px floor showing zoom quality difference

    The most concrete technical change to image policy in 2026 is the effective raising of the minimum resolution threshold. Amazon’s legacy guidance — the 1,000-pixel minimum on the longest side — was set in an era where desktop browsing dominated and smartphone screens were significantly lower resolution than they are today. In practice, many sellers shot at exactly 1,000×1,000px, or just slightly above, treating the stated minimum as a target rather than a floor.

    Current guidance, reflected in updated Seller Central documentation and widely reported by compliance-focused agencies in early 2026, now effectively treats 1,600×1,600 pixels as the functional minimum for images to avoid quality degradation flags and to maintain full zoom functionality. The official recommended size of 2,000 pixels or more on the longest side has not changed, but the zone between 1,000px and 1,600px — previously acceptable — now presents meaningful compliance risk.

    Why Zoom Capability Is a Business Metric, Not a Technical Detail

    Zoom capability matters more than most sellers realize. Amazon’s zoom feature activates only when an image’s longest side exceeds 1,000 pixels — but at 1,000px, the zoomed view is noticeably pixelated on modern high-density screens. At 1,600×1,600px, zoom quality improves substantially. At 2,000px and above, it becomes a genuine purchase-confidence tool, especially in categories where product details — fabric texture, connector types, ingredient panels, stitching quality — materially influence buying decisions.

    Shoppers who can’t zoom in clearly enough to verify a product detail don’t email customer service to ask. They click the back button and look at the next listing. This is a bounce that never registers as a bounce in your Seller Central data — it just shows up as a lower conversion rate that you can’t directly attribute to image resolution.

    The Background Uniformity Threshold

    Alongside resolution, Amazon has introduced a machine-measured background uniformity standard. Main images are now algorithmically evaluated for background cleanliness, with a reported threshold requiring the background area to meet a 95% clean-white standard before passing automated checks. This means images with subtle color casts from incorrect studio lighting, slight gray tones from JPEG compression artifacts, or micro-shadows at product edges are now failing automated checks that would have passed in previous years.

    This is particularly challenging for sellers who photograph products against physical white backdrops rather than using digital cutout workflows. Physical photography in consumer-grade studios regularly produces backgrounds with color temperatures that read as slightly warm or cool in automated systems — even when they look white to the human eye. The practical implication is that many sellers need to either invest in post-production workflows that guarantee true RGB 255,255,255 backgrounds, or shift to digital-first photography setups that include automated background replacement as a standard step.

    The Product-to-Frame Coverage Requirement

    The product-fills-85%-of-the-frame requirement has been in Amazon’s guidelines for years, but enforcement had been lax. In 2026, this is being machine-checked more reliably. Products with significant white-space padding around them — a common artifact of catalog photography shoots where images are cropped loosely for flexibility — now risk failing automated frame-coverage checks. Sellers who maintain large image libraries from older photoshoots should audit their existing assets against this requirement before automated suppression does it for them.


    The Brand Owner vs. Reseller Image War — Who Controls the Detail Page Now?

    Brand owner vs reseller tug-of-war over Amazon product detail page hero image with locked ASIN illustration

    Of all the shifts embedded in Amazon’s 2026 image policy evolution, the redistribution of catalog authority between brand owners and resellers may be the most commercially significant — and the least discussed. This isn’t purely a technical compliance question. It’s a fundamental restructuring of who has the right to determine what a product looks like on Amazon’s detail page.

    How Brand Registry Changed the Image Equation

    Amazon Brand Registry has existed since 2017, but its practical authority over image content on shared ASINs has steadily expanded. In 2026, Brand Registry enrollment gives brand owners a substantially strengthened position: Amazon explicitly ties Brand Registry to “enhanced oversight of detail page content for ASINs when Amazon recognizes you as the brand owner,” and this includes images.

    In practical terms, brand-registered sellers can now contribute images to shared ASINs with a higher level of authority than resellers contributing to the same listing. When a conflict exists between a brand owner’s submitted image and a reseller’s image, Amazon’s system increasingly defaults to the brand owner’s version — regardless of when the competing image was uploaded.

    Brand Catalog Lock: The Mechanism Most Sellers Haven’t Heard Of

    Beyond Brand Registry’s general authority, a feature broadly referred to as Brand Catalog Lock allows brand owners to effectively freeze the content of their registered ASINs against unauthorized changes. When Catalog Lock is active, resellers who are not explicitly authorized by the brand owner cannot modify listing images, titles, or bullet points — even if they are legitimate, authorized resellers of the physical product.

    This is where the commercial friction becomes significant. A reseller who has been selling a brand’s product for years, has contributed compliant, high-quality images to shared ASINs, and has no IP dispute with the brand owner can find their image contributions ignored or overridden by the brand’s catalog lock. The reseller’s right to sell the product is unchanged — their right to control how it looks on the product page has effectively been nullified.

    Amazon’s Own Image Replacement Capability

    The most aggressive mechanism in Amazon’s current toolkit is its own ability to replace images on any listing. Amazon has expanded its authority to substitute a seller’s non-compliant or lower-quality image with images from other contributors — or, in some reported cases, with images that Amazon’s own systems source. This applies even to brand-registered sellers if their images fail automated quality checks while another contributor to the same ASIN has passing images on file.

    The specific categories where this image replacement is most actively occurring include electronics, clothing, furniture, supplements, and cosmetics — precisely the categories with the highest competitive density and the highest volume of multi-seller shared ASINs. For brands that have invested in professional photography as a core brand asset, discovering that Amazon has replaced your main image with a competitor-sourced photo of the same product is not a minor inconvenience. It’s a brand integrity issue that requires active catalog monitoring to catch.

    What This Means for Reseller Business Models

    For pure reseller businesses — sellers who stock and sell other brands’ products without being the brand owner — the 2026 landscape represents a material tightening of operational constraints. Strategies that relied on uploading differentiated or higher-quality images to boost conversion on shared ASINs are no longer reliably available when the brand owner has Brand Registry enrollment and catalog authority active.

    The practical response for resellers in this environment involves prioritizing unregistered brands where catalog authority is not locked, pursuing authorized reseller agreements that include explicit image contribution rights, and shifting competitive strategy toward dimensions that brand catalog lock cannot touch — pricing, fulfillment, review management, and advertising.


    AI-Generated Images and the New Disclosure Requirement

    Amazon AI image disclosure requirements 2026 — what must be disclosed for AI-created and AI-enhanced product images

    The use of AI tools in product photography workflows has exploded over the past two years. Background removal and replacement tools, AI-powered upscalers, generative fill for context and lifestyle settings, and fully AI-generated product composites have all become standard parts of many sellers’ image production processes. For a while, Amazon had no specific rules about any of this — the image just needed to meet the technical requirements. That has now changed.

    What the Disclosure Requirement Actually Covers

    Amazon’s 2026 guidance introduces an AI disclosure requirement for product images and listing content where AI was used to create or significantly modify the image. This applies to several distinct scenarios:

    • AI-created backgrounds: If you used a generative AI tool to replace the background of your product photo — even with a clean white background — this technically falls under the disclosure requirement if the background was generated rather than photographed.
    • AI-generated product composites: Images where the product itself or its key visual attributes were materially altered or generated by AI are prohibited if they misrepresent the physical product. A supplement bottle with a label that looks slightly different in the AI-generated image than it does in real life, or a furniture piece where AI has smoothed out a visible seam, crosses the line from retouching into misrepresentation.
    • AI-enhanced retouching: Significant AI-driven enhancements — not basic color correction, but structural modifications to the product’s appearance — require disclosure when they create a materially different impression of the product.

    How Enforcement Is Playing Out in Practice

    In practice, Amazon’s enforcement of AI disclosure is still evolving. The clearest enforcement pressure is arriving around peak shopping periods — Prime Day being the most prominent example — when Amazon’s automated systems run more aggressive compliance sweeps. Listings with images that fail provenance checks or that have been flagged by algorithmic signals as likely AI-generated without disclosure face suppression risk particularly during these high-stakes windows.

    The more nuanced reality is that Amazon’s systems aren’t yet capable of detecting every AI-generated image with perfect accuracy. What they can detect is a set of hallmark patterns: impossibly perfect shadows, textures that don’t match real-world material properties, background gradients that no physical photography setup would produce. These detection capabilities will improve. Sellers who are building AI into their image workflows now need to treat disclosure as a permanent part of the process, not a temporary hurdle to work around.

    The Legitimate Use Case for AI in Amazon Images

    It’s important to note that Amazon is not banning AI from product image workflows. The requirement is disclosure and accuracy, not prohibition. AI tools that genuinely improve image quality without misrepresenting the product — high-quality upscaling, background cleanup to achieve the 255,255,255 white standard, intelligent cropping to meet the 85% frame coverage requirement — remain legitimate tools when used transparently and disclosed appropriately.

    The commercial opportunity here is real. Sellers who build compliant AI-assisted image workflows that meet disclosure requirements while producing superior image quality will have a production-speed and cost-structure advantage over those relying entirely on traditional studio photography. The constraint isn’t AI use — it’s undisclosed AI use that produces inaccurate product representations.


    Category-by-Category: What Changed for Apparel, Beauty, and Electronics

    While the broad technical requirements and enforcement escalation apply across all categories, three categories have received specific updated guidance in 2026 that goes beyond the baseline. If you’re selling in apparel, beauty, or electronics, the category-specific requirements represent the most material policy change to your image strategy.

    Apparel: Model Requirements, Ghost Mannequin, and Size Accuracy

    Apparel has long had the most complex image requirements on Amazon, and 2026 has added specificity to several existing rules. On live models, the guidance tightens expectations around how size and fit are represented: model measurements must be disclosed in a standardized way, and images where styling choices — heavy tucking, pinning, or model posture — significantly misrepresent how a garment fits on a real body are now treated as accuracy violations, not just styling choices.

    Ghost mannequin images — product shots where the mannequin is digitally removed — remain permitted but now need to meet stricter standards for completeness and shape accuracy. An AI-generated ghost mannequin composite that flattens or idealizes the garment’s actual drape in ways that don’t reflect real-world wear is increasingly treated as a misleading representation. For apparel sellers using AI-powered ghost mannequin services, a review of outputs against the 2026 accuracy standards is warranted.

    Beauty: Ingredient Claims, Before/After, and Skin Tone Representation

    Beauty category images in 2026 are subject to tightened rules on three fronts. First, any image that visually implies a specific ingredient claim — showing an ingredient label highlighted in a way that draws attention to a benefit claim — now needs to align precisely with claims that are verifiable and compliant under Amazon’s substantiation requirements. Images and copy claims are being evaluated as a combined unit for consistency.

    Second, before-and-after style images — long a staple of skincare and cosmetics listings — face significantly stricter guidelines. Images that imply dramatic, visually demonstrable results from a product are subject to the same substantiation requirements as text claims, and digitally enhanced “after” states in composite images are treated as misrepresentation.

    Third, Amazon has introduced guidance on skin tone representation in beauty images, requiring that lifestyle and model images across beauty categories represent a diverse range of skin tones. While this is framed as a quality guideline rather than a hard compliance requirement, listings where all model images use a single skin tone are receiving lower Listing Quality Scores — which has downstream implications for both organic visibility and advertising efficiency.

    Electronics: Multi-Angle Requirements, Port Accuracy, and Technical Spec Callouts

    Electronics listings in 2026 face tighter expectations around the completeness and accuracy of product angles. Where a consumer electronics product has ports, connectors, or physical controls that materially affect purchase decisions, Amazon’s updated guidance expects these to be visually represented in the image gallery. A wireless speaker listing where no image clearly shows the charging port type or button placement is now more likely to receive a listing quality flag than it would have under previous guidelines.

    Technical specification callouts in secondary images — a common infographic convention in electronics — are now being checked for alignment with listing specifications. An image that shows “USB-C charging” when the product uses Micro-USB, or that displays a battery life graphic that doesn’t match the listed technical specifications, is treated as a misrepresentation violation rather than a minor inconsistency.


    Amazon’s Mobile-Visual Turn and What It Demands from Your Image Stack

    Mobile-first Amazon image optimization showing 70% of Amazon browsing happens on mobile, thumbnail clarity requirements

    Amazon’s platform has gone mobile-first not by announcement, but by mathematics. Current estimates put more than 70% of Amazon browsing happening on mobile devices, and the shopping app’s visual interface has been redesigned repeatedly to put images — not text — at the center of the discovery experience. This shift has compounding effects on what a high-performing image stack actually needs to do.

    The Thumbnail Decision: Your Main Image as a 150-Pixel Ad

    On mobile search results, your main image renders as a thumbnail at roughly 150–200 pixels. At that scale, fine detail disappears. Text overlays become unreadable. Products with busy backgrounds blend into each other. The competitive implication is that your main image needs to work as a standalone communication tool at tiny scale — the product must be immediately recognizable, the value proposition must be implied by the visual composition, and the image must stand out against the surrounding listing grid.

    This is a fundamentally different design brief than optimizing for the desktop product detail page, where the main image renders at 500px or more and supports zoom. Sellers who are optimizing their main images purely for the desktop detail page view are likely underperforming on mobile search, where most of their impression volume actually lives.

    Amazon Lens and Visual Search: A New Discovery Surface

    Amazon’s visual search capability — Amazon Lens — has become a material discovery surface in 2026. Visual searches on Amazon grew approximately 70% year-over-year according to Amazon’s own reported data, driven primarily by the Lens camera feature in the Amazon Shopping app and the “More like this” feature in search results. Younger shoppers in particular are using visual search as an entry point to product discovery rather than keyword search.

    For image optimization, this creates a new set of questions. Visual search systems match product images against query images using image embedding similarity — which means your product’s visual identity in its main image needs to closely match the visual appearance of the actual product in real-world contexts where someone might photograph it. A highly stylized, cropped, or heavily retouched main image that doesn’t look like the product “in the wild” may perform well in keyword search but underperform in visual search matching.

    Portrait Ratio and the Scroll Behavior Shift

    While Amazon’s current image specifications still default to a square format for main images, there is growing evidence in third-party research and agency testing that portrait-ratio images — taller than wide — perform better on mobile browse pages where vertical scrolling dominates. Amazon has not officially endorsed portrait ratios for main images, but sellers in fashion, home goods, and cosmetics categories who have tested portrait-ratio main images in Manage Experiments report meaningful lift in click-through rate on mobile, where portrait images claim more vertical screen space in the search grid.

    This is an area where Amazon’s official guidance and observed conversion behavior diverge — which puts sellers in the position of choosing between strict policy compliance and potential click-through optimization. The prudent approach is to test within the bounds of Amazon’s stated specifications first, using Manage Experiments to generate actual data before assuming any format change is net positive for your specific category and customer base.


    A+ Content, Premium A+, and Video — Where the Real Image Battleground Is

    Much of the compliance discussion in 2026 focuses on main images and gallery slots, which makes sense because those are where suppression risk lives. But the more commercially interesting question for many established brands isn’t compliance — it’s differentiation. And the differentiation battleground has shifted decisively toward A+ Content, Premium A+, and product video.

    A+ Content: Still the Baseline, Not the Differentiator

    Standard A+ Content — available to all Brand Registry-enrolled sellers at no additional cost — has become so widely adopted that it functions more as a minimum viable listing requirement than a differentiation tool. Most competitive categories now have the majority of top-10 listings featuring A+ content. A listing without A+ in these categories is immediately visually inferior to its neighbors regardless of how strong its gallery images are. Standard A+ is table stakes; it’s no longer a source of competitive advantage.

    Within standard A+ though, image quality matters considerably more than most sellers recognize. Amazon’s A+ image specifications require files under 2MB in JPEG or PNG format with RGB color profiles. The module designs within A+ vary in how much visual space they give to photography, and the most conversion-effective A+ layouts are those that pair high-quality, purpose-shot photography with clean, legible text modules that tell a coherent product story rather than just restating bullet points in graphic form.

    Premium A+: The Gap Between Eligible and Using It Well

    Premium A+ is available to Brand Registry sellers who meet Amazon’s eligibility thresholds, and it includes capabilities that standard A+ doesn’t: interactive hotspot modules, enhanced comparison charts, full-width image backgrounds, and embedded video. The conversion lift data from Premium A+ versus standard A+ is material — Amazon’s own internal estimates have cited conversion rate improvements of up to 20% for well-executed Premium A+ versus standard A+ in comparable categories.

    The challenge is that many brands who have access to Premium A+ are either not using it or not using it effectively. Interactive hotspot modules require product images where specific features can be meaningfully highlighted — which is a different photography brief than standard gallery shots. Full-width backgrounds require images that work compositionally at 1464×600 pixel banner dimensions — another entirely different brief. Brands treating Premium A+ as a simple upgrade from standard A+ by just stretching the same assets into the new modules are capturing a fraction of the available conversion uplift.

    Product Video: The Engagement Asset That Most Listings Still Don’t Have

    Product video on Amazon detail pages remains dramatically underutilized relative to its conversion impact. Studies and agency reports consistently show that listings with product video — whether in the main image gallery slot or embedded in A+ content — see meaningfully higher engagement time and add-to-cart rates, particularly for products with a use-case or assembly component that static images don’t communicate well.

    The practical barrier to product video has historically been production cost. This barrier has largely dissolved. High-quality product videos can now be produced with smartphone cameras, basic lighting setups, and accessible editing software at a cost that makes video economical even for single-SKU sellers. The competitive implication is that in 2026, not having product video is increasingly an active disadvantage rather than a neutral omission.

    Amazon’s specifications for product video in listings — no more than 500MB file size, acceptable formats including MP4 and MOV, minimum 1280×720 resolution — have not changed significantly, but enforcement of video content accuracy is tightening in parallel with image enforcement. Product demonstration videos that show capabilities the product doesn’t actually have, or that misrepresent assembly complexity, are now treated with the same scrutiny as misleading product images.


    Building a Compliant, High-Converting Image Stack in 2026

    Amazon 7-image conversion stack diagram showing main image through brand story slot with conversion lift percentages

    Compliance and conversion are not opposing forces. The image requirements that Amazon is enforcing in 2026 are, by and large, the same requirements that produce better shopper experiences and higher conversion rates. The seller who treats compliance as a minimum threshold and then builds a genuinely strong image set above that threshold is simultaneously reducing suppression risk and improving commercial performance.

    The Image Slot-by-Slot Brief

    A complete, high-performing Amazon image set in 2026 typically occupies all available image slots — currently up to 9 in most categories. Each slot should have a specific job:

    • Slot 1 (Main image): Compliant, pure white background, product fills 85%+ of frame, 1,600px minimum on longest side, no text or badges, immediately readable as a thumbnail at 150px. This image’s only job is to win the click from search results.
    • Slot 2 (Lifestyle/in-use): Product shown in its real-world context, with a person or environment that reflects your actual customer. This image converts browsers who need to visualize the product in their life before committing.
    • Slot 3 (Scale/dimensions): A size reference image that eliminates the “how big is this actually?” question. Surprisingly few sellers use this slot effectively despite it being one of the highest-rated trust signals in buyer research.
    • Slot 4 (Feature callouts/infographic): Your key product benefits visualized, not just listed. Text at this stage is fine in secondary images — just ensure it’s legible at mobile zoom levels and accurate to listed specifications.
    • Slot 5 (Ingredient/material detail): Close-up of the product texture, material quality, or construction detail. This is your proof-of-quality image, converting shoppers who are skeptical about physical quality from a photo.
    • Slot 6 (Comparison or differentiation): A structured comparison — ideally against a generic alternative or against the problem your product solves — that frames your product as the obvious choice. Keep this factually accurate to avoid compliance risk.
    • Slot 7+ (Story/brand credibility): Use remaining slots for a brand narrative, packaging detail, certifications, or social proof visualization. These images don’t close the sale — they build the trust that removes the final friction.

    Testing Is No Longer Optional

    The expansion of Amazon’s Manage Experiments tool to a wider range of sellers means that A/B testing main images is now accessible to most brand-registered sellers. Best practices for main image testing in 2026 have become significantly more sophisticated: testing a single variable at a time (angle vs. angle, not angle vs. completely different composition), running tests for the full Amazon-recommended minimum duration of four weeks to avoid statistical noise, and reading results at the audience-segment level rather than just in aggregate.

    Third-party tools like PickFu have also become mainstream components of the pre-launch image testing workflow, allowing sellers to gather consumer preference data on image options before committing to a live test. The combination of pre-launch consumer preference testing and live A/B testing through Manage Experiments gives sellers a much more reliable signal on image performance than the historical practice of choosing images based on internal creative preference.

    The Audit You Should Run Before Prime Day

    Given the documented pattern of Amazon running more aggressive compliance sweeps around peak shopping events, an image audit of your full catalog ahead of Prime Day and Q4 peak season should be standard operating procedure. A practical audit checklist for 2026 includes:

    1. Resolution check: every main image at 1,600px minimum on longest side.
    2. Background check: main images reviewed against RGB 255,255,255 standard, not just by eye.
    3. Frame coverage: product occupies at least 85% of frame in main image.
    4. Text/watermark scan: no text, logos, or badges visible in main images.
    5. AI disclosure status: any AI-assisted images flagged and disclosure requirements reviewed.
    6. Category-specific compliance: apparel model requirements, beauty claim alignment, electronics spec accuracy.
    7. Image slot completion: all available image slots populated.

    The Compliance Risk You Probably Haven’t Modeled Yet

    Most sellers have thought about image compliance in terms of individual ASINs: does this listing have compliant images or not? The risk model that most sellers have not built is a catalog-level, financial-impact model that quantifies what coordinated image suppression across multiple ASINs in a peak trading window actually costs.

    Modeling the True Cost of Suppression Events

    Consider a seller with 200 active ASINs, where roughly 20% have images that are borderline on resolution or background uniformity — a realistic proportion based on industry audit data. If a compliance sweep suppresses 40 ASINs for 72 hours during a peak period, the revenue impact is not just 72 hours of zero sales on those ASINs. It includes the re-indexing decay period that follows reinstatement, the advertising budget waste on suppressed listings where ads continue to accrue impressions with no conversion, the potential BSR decay that affects organic ranking for weeks after the suppression event, and the customer trust signal damage for any buyers who encountered a suppressed or degraded listing during their purchase journey.

    When modeled honestly, the cost of a coordinated suppression event during a peak period for a mid-size Amazon business can easily exceed $50,000–$200,000 in lost revenue equivalent — far more than the cost of a proactive image audit and remediation program.

    The Account Health Dimension

    Account Health Rating — the score Amazon uses to assess a seller’s overall compliance standing and eligibility for programs like Seller Fulfilled Prime, Sponsored Brands, and certain promotional placements — is increasingly sensitive to image-related violations. Sellers whose Account Health Rating degrades due to repeated image suppression events may find themselves ineligible for programs they’ve been using without issue for years. The relationship between image compliance and account-level program eligibility is not well-documented by Amazon but is increasingly reported by sellers navigating the 2026 enforcement environment.

    Building Compliance Into the Workflow, Not the Audit

    The most effective response to the 2026 compliance environment isn’t more frequent audits — it’s integrating compliance checks into the image production workflow so that non-compliant images are caught before upload rather than after suppression. This means:

    • Production-stage validation: Adding automated resolution and background checks to image production workflows before assets are uploaded to Seller Central.
    • Upload-stage review: Using third-party Seller Central integrations or internal QA processes that flag images before they go live.
    • Monitoring-stage alerts: Implementing listing health monitoring that flags suppression events immediately — many sellers discover suppressed listings only when they notice a revenue drop in their dashboard, by which point the re-indexing damage has already begun.

    Where Amazon’s Image Policy Is Heading — and How to Stay Ahead

    Amazon’s image policy evolution in 2026 is not an endpoint. It’s a waypoint in a longer structural shift toward platform-enforced visual quality standards, brand-owner catalog authority, and AI-integrated image verification. Understanding the direction of travel matters as much as understanding the current rules.

    The Image Policy Trends Worth Watching

    Several trends in the current environment point toward where policy is likely to go over the next 12–24 months. First, the AI disclosure requirement will almost certainly become more standardized and machine-enforceable. Right now, disclosure is primarily a self-certification process. As Amazon’s image analysis capabilities improve, detection of undisclosed AI modification will become more automated, and the penalties for non-disclosure will likely become more severe.

    Second, the brand-owner image authority trajectory is toward even greater control, not less. Brand Catalog Lock, Brand Registry’s expanding suite of catalog protection tools, and Amazon’s own image replacement capabilities are all moving in the same direction: toward a catalog where brand owners have near-complete authority over how their products are presented, and where resellers who want to influence presentation need explicit brand authorization to do so.

    Third, the minimum technical bar will continue to rise. The shift from 1,000px to 1,600px as the effective minimum is not a one-time adjustment — it reflects a platform responding to higher-resolution device screens and more sophisticated shopper expectations. As 4K and OLED displays become standard even in mid-range smartphones, the resolution and color accuracy requirements for images that look “good” will continue to increase.

    The Strategic Position to Build Now

    Sellers who navigate the 2026 image policy environment most effectively will share a set of operating characteristics: they treat image assets as strategic investments with trackable ROI, not production costs to minimize; they maintain compliant, complete image sets across their full catalog as a baseline, not just for top sellers; they have monitoring systems that detect suppression events within hours rather than days; and they are building AI-assisted image workflows that are compliant by design, with disclosure practices baked in from the start.

    The broader implication is that visual presentation on Amazon is no longer a creative function operating separately from the commercial strategy. Image quality, compliance, and catalog control are now directly connected to organic visibility, advertising efficiency, account health, and revenue protection. In 2026, the sellers who treat their image stack with the same rigor they apply to pricing strategy, inventory management, and PPC structure will be the ones whose catalogs hold up when the next compliance sweep runs.

    Actionable Takeaways

    • Audit your entire catalog for resolution and background compliance before the next peak shopping window. Don’t rely on images that were compliant under 2019 standards — re-evaluate against 2026 thresholds.
    • If you are a brand owner with Brand Registry enrollment, activate catalog content controls proactively rather than reactively. The tools exist — using them prevents unauthorized image changes before they happen.
    • If you are a reseller, re-evaluate your image contribution strategy on brand-registered ASINs and redirect creative investment toward listings where you have real catalog authority.
    • Review your AI image production workflow against Amazon’s disclosure requirements. Build disclosure practices into your process now, before enforcement tightens further.
    • Implement listing health monitoring that alerts you to suppression events in real time, not retroactively.
    • Treat A+ Content and product video as baseline requirements, not optional upgrades. In competitive categories, listings without these assets are already at a structural disadvantage.
    • Test your main image using both pre-launch consumer preference tools and Amazon Manage Experiments. The difference between the right and wrong main image can be a 15–25% difference in click-through rate — a gap that compounds across your advertising spend and organic impressions.

    Amazon’s image policy shifts are not, at their core, about compliance for compliance’s sake. They reflect a platform moving toward higher-quality visual commerce — one where the detail page experience reliably matches the physical product, where brand owners control their brand presentation, and where AI tools are used transparently rather than covertly. The sellers who align with that direction, rather than working against it, will find the 2026 environment far less threatening than it appears in a suppression notification email.

  • How to Work Inside Amazon’s AI Image Rules — and Actually Win

    How to Work Inside Amazon’s AI Image Rules — and Actually Win

    Split-view showing compliant AI image zone versus flagged listing zone with suppression warning overlay for Amazon sellers

    Amazon’s AI image rules aren’t complicated. They’re available in writing, summarized by a thousand seller blogs, and reinforced by category-specific style guides that have existed for years. And yet listings still get flagged every single day — not because sellers don’t know the rules, but because they don’t have a system that applies the rules consistently at every stage of the image production pipeline.

    That’s the distinction almost every guide on this topic misses. Knowing a rule and operationalizing it are completely different problems. A seller can recite Amazon’s image requirements verbatim and still push a suppressed ASIN live, because the issue isn’t knowledge — it’s the gap between knowing and doing under the real-world pressures of a fast-moving catalog.

    This post is not about what the rules say. It’s about how to build the workflow intelligence that makes compliance automatic — where flags become rare events rather than routine recoveries. We’ll cover how to allocate AI usage across image types, what specifically triggers Amazon’s automated scanning systems, how to stress-test images before submission, and how to use Amazon’s own tools in a way that’s both compliant and genuinely performant.

    If you’re already familiar with Amazon’s policies and you’re still getting burned, this is the post for you. The goal isn’t to survive Amazon’s enforcement — it’s to make compliance your production standard so that enforcement is never a factor.

    The Three-Tier Image Framework: Where AI Can and Cannot Touch Your Listing

    Three-tier Amazon listing image hierarchy showing main image zone, secondary lifestyle image zone, and A+ content zone with compliance rules for each tier

    The first operational decision every seller needs to make — before touching any AI tool — is understanding that Amazon’s listing doesn’t have one image standard. It has three distinct image zones, each with its own risk profile, compliance ceiling, and AI-use rules. Treating them as uniform is where most multi-image catalog problems originate.

    Tier 1: The Main Image — A Near-Zero AI Tolerance Zone

    The main image slot is the strictest position in any Amazon listing. Amazon’s requirements here are well-documented and tightly enforced: pure white background (RGB 255,255,255 — not near-white, not off-white, not a 97% white that “looks the same”), product filling at minimum 85% of the image frame, no props, no additional items not included in the purchase, no text overlays, no logos, no watermarks. Resolution minimum is 1,000 pixels on the longest side, but most experts now recommend 2,000px as a practical floor given zoom functionality and future-proofing against re-spec changes.

    AI’s role in Tier 1 is almost entirely limited to post-processing cleanup — and even then, cautiously. Background removal tools and AI-powered background replacement to pure white are commonly used and generally fine, provided the output is pixel-verified and not gradient-edged. Where sellers get into trouble is using AI image generators to create the main image entirely from scratch. An AI-generated product rendering, however photorealistic, is not a photograph, and Amazon’s enforcement systems — which now incorporate ML-based artifact detection — are increasingly able to identify renders vs. real photography, particularly on hero shots where lighting consistency and shadow physics are readily compared.

    The practical rule for Tier 1: photograph the physical product, then use AI for cleanup only. Any AI that touches the product itself — its shape, color, scale, or implied features — is a compliance risk.

    Tier 2: Secondary/Lifestyle Images — The AI-Friendly Zone (With Boundaries)

    This is where AI earns its place in a seller’s workflow. Images 2 through 9 in the standard listing carousel are subject to much more lenient standards. Amazon’s core requirement for these slots is accuracy — that the images don’t misrepresent what the product is, what’s included, or what the product can do. Within that constraint, AI-generated backgrounds, environments, lifestyle scenes, and visual enhancements are broadly permitted.

    In practice, this means you can use AI to place your product in a kitchen, on a hiking trail, in a premium hotel bathroom, or on a café table — as long as the product itself is accurately rendered and the context doesn’t imply functionality the product doesn’t have. You can use AI to adjust lighting, improve scene quality, add models, and create seasonal variants. This is where most of the performance gains from AI imagery are realized, and it’s where Amazon’s own tools (covered in detail below) are explicitly designed to operate.

    Tier 3: A+ Content and Brand Store — Maximum Creative Latitude

    At the A+ Content and Brand Store level, Amazon’s creative latitude is at its widest. Here, sellers and brand-registered vendors can use AI-generated imagery, banner compositions, infographic overlays, comparison charts, and environmental scenes with relatively few restrictions beyond the core “not misleading” standard. The focus shifts from product-accurate photography to brand storytelling and conversion-focused content design.

    Critically, the AI-detection enforcement that operates on listing images is significantly less aggressive in A+ Content, where compositional complexity makes automated artifact detection harder. That said, the “accuracy” principle still applies: you cannot use A+ Content images to claim a product feature that doesn’t exist or to imply inclusion of items not sold with the product.

    The Specific AI Artifacts That Trigger Amazon’s Automated Scanners

    Technical diagnostic view showing annotated AI image artifacts that trigger Amazon automated compliance scanning — shadow inconsistency, off-white background, garbled text, and upscaling noise

    Understanding what Amazon’s automated systems are looking for is the most direct path to understanding what not to do. Amazon deploys ML-based image scanning across its catalog, and the signals that trigger automated suppression or manual review flags fall into several well-documented categories.

    Background Compliance Signals

    The most common automated flag on main images is background non-compliance. Amazon’s system doesn’t evaluate background color visually — it runs pixel-level analysis. An image that looks white to the human eye can register as RGB 250,250,250 or lower, and that delta is detectable and actionable. When AI background replacement tools process a product image, they commonly leave “fringe” pixels around the product edge that transition from the original background to white — this gradient zone is a reliable suppression trigger. The fix is not “make it look whiter.” The fix is pixel-sampling the final export to confirm every non-product pixel reads 255,255,255.

    AI image upscaling is a specific sub-problem here. Many sellers use AI upscalers to meet Amazon’s resolution requirements on images that were originally photographed at lower resolution. These tools frequently introduce compression-style banding or noise, particularly in flat background areas, that creates measurable deviation from the pure white standard. If you’re upscaling, verify the background explicitly — don’t assume the tool handled it correctly.

    Shadow and Lighting Inconsistency

    Amazon’s ML systems are trained to detect lighting inconsistencies that signal composite imagery — specifically, cases where a product has been photographed in one lighting environment and placed into a different one without correcting the shadow direction, intensity, or color temperature. This is common when AI tools auto-place products into lifestyle backgrounds and the product shadow doesn’t match the scene’s apparent light source.

    For secondary lifestyle images this generally won’t cause suppression, but it will degrade the visual credibility of the image in ways that affect conversion rates. For main images, a composite where shadows suggest the product was photographed under studio lighting but the background is a lifestyle scene is an almost certain flag. The rule of thumb: match shadow direction and soft/hard quality to the scene’s light source, or remove product shadows entirely in clean composites.

    AI-Generated Text and Label Artifacts

    Current AI image generation tools have a well-known weakness with text — rendered product labels, instruction text, brand names, and ingredient lists frequently contain garbled, nonsensical, or malformed characters that are visually obvious at zoom levels. Amazon’s systems scan for text consistency and legibility in product images, and garbled on-image text is both a suppression signal and a customer-experience flag.

    The operational fix is to never rely on AI generators to produce readable product label text. Generate the scene without legible label detail, then composite the real product label on top as a post-processing step. Alternatively, shoot the product physically and use AI only for environmental generation, compositing the physical shot into the AI-generated scene. This hybrid approach is the current best practice for AI-enhanced product imagery and eliminates the text artifact problem at source.

    Depth and Scale Inconsistency

    AI-generated lifestyle scenes frequently produce products that appear visually “pasted” — the scaling relative to scene elements is off, the perspective doesn’t match, or the depth of field blur gradient doesn’t align with where the product sits in the apparent scene depth. These signals are softer than background or text issues in terms of automated enforcement, but they register in Amazon’s image quality scoring systems, and more importantly they register with shoppers in ways that reliably reduce CTR and conversion.

    Amazon’s Own AI Tools vs. Third-Party Generators: The Compliance Risk Is Not Equal

    Side-by-side comparison dashboard of Amazon Creative Studio versus third-party AI image generator showing compliance risk, ROAS data, and policy alignment differences

    This is a point that gets surprisingly little attention in the seller community: where your AI-generated images come from matters for compliance purposes, not just quality purposes. Using Amazon’s own AI image tools creates a fundamentally different compliance profile than using external third-party generators.

    Amazon Creative Studio and the Built-In Policy Alignment Advantage

    Amazon’s own image generation tools — accessed via Creative Studio, the Ads console, Sponsored Brands creative flows, and the DSP Responsive eCommerce Creative (REC) system — are built within Amazon’s own policy framework. They generate images from product detail page data, meaning the product representation comes from your existing listing content rather than a generic AI prompt. The scenes they produce are filtered through Amazon’s own compliance guidelines at the generation layer, not the review layer.

    Amazon’s internal performance data on these tools is notable: Sponsored Brands campaigns using AI-generated lifestyle images from Creative Studio have shown approximately 10.3% higher ROAS compared to campaigns using standard product-only images, according to Amazon Ads materials. Mobile Sponsored Brands placements using AI-generated creative have shown CTR improvements of up to 40% in some Amazon-reported beta data. These numbers come from Amazon’s own systems and should be read as directionally informative rather than universally guaranteed — your category, price point, and creative quality all affect outcomes — but the direction of the signal is consistent.

    More importantly for the compliance discussion: images generated within Amazon’s own Creative Studio are pre-screened against Amazon’s policies before they’re available for use. You are significantly less likely to face an automated flag on a Creative Studio output than on an identical-looking image generated in an external tool, because the output came from a system Amazon controls and trusts.

    Third-Party AI Generators: Performance Potential, Compliance Responsibility

    External tools — Midjourney, DALL-E, Stable Diffusion, and dozens of purpose-built product photography AI platforms — offer wider creative latitude, more photorealistic outputs for many product types, and more scene variety than Amazon’s native tools. For sellers who invest in learning these tools deeply, the creative output is often significantly higher quality than what Creative Studio currently produces.

    The trade-off is that compliance responsibility sits entirely with you. Amazon’s automated systems have no knowledge of what tool produced an image — they evaluate the output against policy standards, and they do so without preferential treatment for any external vendor. The artifact risks described in the previous section are entirely your problem to catch. The solution isn’t to avoid third-party tools — it’s to build a robust pre-submission QA process that catches what Amazon’s systems will catch, before you submit.

    A Practical Hybrid Framework

    The most effective approach for brand-registered sellers is a split workflow. Use Amazon’s native Creative Studio for advertising creatives and Sponsored Brands images, where the built-in compliance assurance and direct performance data make it a clear default choice. Use third-party AI tools for secondary listing images, A+ Content, and Brand Store assets, where creative quality matters more and compliance risk is lower. Reserve traditional photography for all main images, with AI used only for post-processing background work and color correction — never for primary product rendering.

    The Secondary Image Opportunity: Where AI Has Almost No Limits

    If the main image is where AI goes to die, the secondary image carousel is where it genuinely performs. The eight available secondary image slots on a standard Amazon listing are chronically underused by most sellers — and the ones who invest in them seriously, particularly with AI-enhanced lifestyle content, see measurable conversion rate improvements that compound directly into organic ranking and paid advertising efficiency.

    What Converts in Secondary Images

    Research and seller-community data consistently point to the same secondary image patterns that convert: contextual use scenes showing the product in its natural environment, scale reference shots that help shoppers understand size, feature callout images that highlight specific product attributes with clean visual annotation, and lifestyle images showing the product with an aspirational or relatable user.

    AI is particularly effective at contextual use scenes, because these are environments that would be expensive and logistically complex to shoot physically. A camping lantern shown in a forest clearing at dusk, a kitchen appliance shown in a premium modern kitchen, a skincare product shown in a spa-like bathroom — these scenes cost thousands of dollars to stage and shoot physically but can be generated and iterated in minutes with AI tools. The compliance check is simply: does the product in the image accurately represent the product being sold, with no features, colorways, or bundled items that aren’t real?

    Feature Callout Images and Infographic Overlays

    One of the most underappreciated uses of AI in secondary images is not generating entire scenes but generating clean backgrounds and layouts for feature callout images. An AI-generated white or gradient background with your real product photograph composited onto it, combined with clean typographic callouts highlighting key features, is one of the highest-converting secondary image formats on Amazon — and it’s entirely compliant, because the image is transparently informational rather than representational.

    The compliance boundary to watch: feature callouts must be accurate. If a callout says “antimicrobial coating” and the product doesn’t have one, that’s not an AI compliance issue — it’s a broader misrepresentation issue that falls under Amazon’s customer-trust policies and can result in far more serious consequences than an image flag.

    Comparison and Size Reference Images

    AI can generate comparison imagery that helps shoppers make purchase decisions — size comparison against a common object (a coin, a hand, a standard item), before/after effect imagery for consumables, and product variant comparisons showing colorway or size differences. These formats perform particularly well in categories where size misjudgment is a common return driver. Generating these with AI rather than staging them physically saves significant production cost while improving listing quality in one of the highest-ROI secondary image formats.

    The Main Image Problem: Why AI Enhancement Often Backfires on Hero Shots

    Given the performance stakes of the main image — it’s the most direct driver of search result CTR, which is the most direct driver of organic ranking velocity — it’s worth addressing in detail why AI enhancement of the main image so often creates more problems than it solves.

    The False Economy of AI Background Removal

    AI background removal tools are reliable enough that many sellers use them as a default step in main image processing. For simple products with clean contours — a book, a box, a bottle — they work well. For products with complex edges — textured surfaces, transparent elements, mesh materials, hair, fur, multiple interlocking components — AI background removal consistently produces visible fringe artifacts, edge halos, and missing product detail that is clearly visible at the zoom levels Amazon shoppers regularly use.

    The false economy is this: running a product image through an AI background remover feels like a QA step, but it actually introduces compliance risk that didn’t exist before. A product photographed on a slightly-off-white physical backdrop, processed through a poor AI background removal that leaves artifact fringe, will perform worse and face higher suppression risk than the original image with the “wrong” background color. If you’re going to use AI for background work on main images, invest in pixel-level output verification — specifically, eyedropper-sampling the exported image at multiple background points to confirm RGB 255,255,255. Don’t eyeball it.

    The Upscaling Trap

    AI upscaling to meet Amazon’s resolution requirements is another common source of hidden compliance problems. The upscaling itself is generally fine — AI super-resolution tools do an excellent job of enhancing perceived sharpness and recovering detail. The problem is what they do to flat background areas. Where a plain white background in a lower-resolution image is genuinely flat (all pixels at 255,255,255), an AI upscaler interpolates between pixels and can introduce subtle variation in what was previously a uniform surface. The result is a high-resolution image that passes visual inspection but fails a pixel-level background uniformity check.

    The fix is to run background replacement after upscaling, not before. Upscale the image, then apply background replacement to the upscaled version, then verify RGB. This order of operations prevents the upscaling step from contaminating the background compliance.

    When Real Photography Is Non-Negotiable

    There are product categories where AI image generation for main images simply cannot produce reliable compliance-safe output in 2026: jewelry (where metal finish, gemstone color, and scale are all high-stakes and easily misrepresented by AI rendering), clothing and apparel (where texture, drape, and fit under real-world light are critical and AI consistently misrepresents them), and complex electronics (where label text, port layouts, and indicator light positions are product-specific details that AI cannot reliably replicate). In these categories, the main image must be a physical photograph. AI belongs in the supporting role, not the principal one.

    Pre-Submission QA: The 11-Point Process That Catches Issues Before Amazon Does

    11-step Amazon image compliance pre-submission QA checklist on a digital tablet interface with checkboxes and green verification marks

    The most cost-effective investment in avoiding listing suppression is a pre-submission QA process that systematically checks every compliance variable before an image ever reaches Amazon’s servers. What follows is a practical, step-by-step process that any seller or agency can implement — with tool suggestions where applicable.

    Step 1: Background RGB Verification

    Open the final image export in any image editing tool (Photoshop, GIMP, Canva Pro all work). Use the eyedropper or color picker tool to sample at least five background points: four corners and the center. Every point must read R:255, G:255, B:255. One failing sample means the image needs reprocessing before submission.

    Step 2: Product Fill Percentage Estimate

    The product should occupy approximately 85% or more of the image frame. A quick way to estimate: if the product has clear space of more than roughly 7–8% of the image width on each side, it may be undersized. For compliance-critical catalogs, some sellers use a simple grid overlay in Photoshop to measure this precisely.

    Step 3: Text and Overlay Check

    Main images cannot contain any text overlays, watermarks, logos (other than on the physical product itself), badges, “new,” “sale,” or promotional indicators, or foreign-language text. Scan the image carefully — AI-generated images sometimes include environmental text (a street sign in the background, text on a surface) that isn’t intentional but will trigger an overlay flag.

    Step 4: Shadow Consistency Analysis

    Identify the apparent light source direction from the product shadows. Confirm that the shadow direction, softness, and length are consistent with a single light source. Multiple competing shadow directions are an AI composite indicator.

    Step 5: Product Label and Text Legibility

    Zoom in on any text visible on the product — label copy, instruction text, brand name, ingredient lists, warning text. Every character must be legible and match the physical product. If AI-generated imagery produced this text area, it almost certainly needs to be replaced with a composited version from the real product.

    Step 6: Resolution Confirmation

    Check the pixel dimensions of the export. Minimum 1,000px on the longest side for listing; aim for 2,000px or higher for main images to enable full zoom functionality. JPEG export quality should be at 80%+ to avoid compression artifacts in background areas.

    Step 7: Color Accuracy Check Against Physical Product

    Place the digital image next to the physical product (or next to a color-accurate photograph of the physical product) and compare. AI-generated imagery can subtly shift color tones, especially in lighting conditions that don’t match the product’s actual surface properties. A blue product rendered 10% more saturated than it really is will generate returns and negative reviews from customers who feel misled.

    Step 8: Included Items Verification

    Every item visible in the image must be included in the purchase, or clearly labeled as a prop not included. This is an easy mistake in AI lifestyle imagery where a generated scene might include a complementary product (a glass next to a blender, a phone next to a charging stand) that isn’t part of the bundle. Amazon’s policies treat this as a misrepresentation of what the customer receives, and complaints generate flags faster than automated systems do.

    Step 9: Lifestyle vs. Main Image Slot Verification

    Confirm the right image type is in the right slot. A lifestyle image with a non-white background in the main image position will trigger an automated suppression. Double-check image slot assignments before batch uploading — this is one of the most common and most preventable suppression causes.

    Step 10: A+ Content Dimension Verification

    A+ Content images have specific dimension requirements that differ from listing images. Amazon will reject or auto-crop A+ images that don’t meet its module-specific size specs. Verify dimensions against the current A+ Content module requirements before uploading, particularly if images were generated for a different format and adapted.

    Step 11: Pixel-Level Background Spot Check on Final Export

    This is a repeat of Step 1 performed specifically on the final-format export — the actual file you’ll upload, not the working file. Color profiles can shift on export, particularly between RGB and sRGB, and what reads as 255,255,255 in your working file can sometimes shift on export if the color profile isn’t properly managed. Save in sRGB, export as JPEG, sample the background of the exported file before uploading.

    Testing Your Images Without Risking Suppression: Smart Experimentation on Amazon

    Image optimization is an ongoing process, not a one-time task. The sellers who extract maximum performance from their listings treat image selection as a testable hypothesis — not an opinion — and run structured experiments to identify which visuals drive better CTR and conversion. Doing this safely and compliantly requires understanding the testing infrastructure Amazon provides and where its limits are.

    Manage Your Experiments: The Compliant Testing Ground

    Amazon’s Manage Your Experiments (MYE) tool, available to Brand Registry sellers, is the only fully Amazon-sanctioned method for A/B testing listing content including images. The tool runs a 50/50 traffic split between two versions of a listing element — main image, title, bullet points, A+ Content — and runs until statistical significance is reached at approximately the 95% confidence level. Standard test duration ranges from 4 to 10 weeks depending on traffic volume.

    The MYE tool matters for compliance because images in an active experiment are explicitly covered under Amazon’s testing framework, meaning you’re not at risk of suppression for having a non-standard variant in test during the experiment period. However, this protection applies to the testing framework, not to images that violate hard policy rules — an image with a non-white background will still get flagged even inside an experiment.

    What to Test and How to Structure Hypotheses

    The most valuable image tests follow a principle of genuine differentiation — testing fundamentally different visual concepts rather than minor iterations of the same idea. Testing a studio shot with white background vs. the same photo with a slight vignette is not a meaningful test. Testing a pure product shot vs. a product-in-use contextual shot is a meaningful test that generates learnable signal about how your audience makes purchase decisions.

    Common high-ROI test structures: main image hero angle vs. three-quarter angle, product-only vs. product-with-scale-reference, single-product vs. multi-unit value proposition, studio lighting vs. natural light aesthetic. Each of these tests a different hypothesis about buyer psychology and generates results that are applicable across your catalog, not just the ASIN under test.

    Using Advertising Data as an Image Pre-Test

    Before committing to a full MYE test cycle, many experienced sellers use Sponsored Products and Sponsored Brands advertising data as a faster, lower-commitment signal on image quality. By running two separate campaigns with identical targeting but different image creatives, you can get directional CTR signal in 7–14 days rather than the 4–10 weeks required for a full MYE test. The data isn’t as clean — ad context differs from organic listing context — but it’s significantly faster for filtering out clearly underperforming images before they consume a full experiment cycle.

    When You Do Get Flagged: A Practical Recovery Protocol

    Amazon listing suppression recovery flowchart showing three parallel paths: automated suppression, manual review request, and escalation with step-by-step resolution process

    Despite best efforts, image flags happen. When they do, the speed and quality of your response determines how much revenue impact you take. The sellers who handle suppression most effectively are those who have a documented recovery protocol ready to execute — not those who start troubleshooting from scratch every time.

    Step 1: Diagnose Before You Act

    The first action when a suppression notice appears is diagnosis, not immediate re-upload. Amazon’s suppression notices often specify the violation type — background non-compliance, prohibited content, resolution failure, missing image requirement. Read the notice carefully before doing anything else. Acting on incorrect assumptions about what was flagged (and uploading a “fix” that doesn’t address the actual violation) extends the suppression and wastes the case-opening window.

    Access your Account Health dashboard in Seller Central and cross-reference the suppression notice with the specific ASIN and image slot affected. Identify whether the suppression is automated (immediate, policy-rule-based) or manual (involves a human review and is usually accompanied by more specific language). These require different response paths.

    Step 2: Prepare and Upload the Corrected Image

    Once the violation type is confirmed, prepare a corrected image that definitively addresses it — ideally using a physically photographed product image for main image violations to eliminate any residual AI artifact risk. Run the corrected image through your full pre-submission QA checklist before uploading. Uploading a corrected image that has a different compliance issue is a common and costly mistake that extends resolution time significantly.

    For automated suppression of main images, uploading a compliant replacement is often sufficient to trigger automatic reinstatement within 24–48 hours. Amazon’s systems re-scan uploaded images against compliance criteria, and a clean upload resolves the vast majority of automated flags without further intervention needed.

    Step 3: Open a Seller Central Case When Automated Resolution Stalls

    If a compliant replacement image doesn’t resolve the suppression within 48 hours, open a Seller Support case. The case should include: the specific ASIN, the image slot affected, a screenshot of the suppression notice, and explicit confirmation of what you’ve done to address the cited violation. Be precise and factual — Seller Support cases resolved via vague descriptions take significantly longer than cases with specific, documented evidence.

    If the suppression involves a Brand Registry listing, use the Brand Registry support channel rather than standard Seller Support. Brand Registry cases are typically handled by a more specialized support team and resolve faster for image compliance issues.

    Step 4: Escalation for Complex Cases

    For suppressions that persist beyond 5–7 business days despite compliant image uploads and active support cases, escalation options include Brand Registry executive seller relations, Amazon Vendor Central pathways for hybrid sellers, and for high-volume sellers, escalation via an Amazon Account Manager if one is assigned to the account. Escalation cases require physical product evidence — photographs or videos of the actual product demonstrating the compliance of the re-submitted image — so have this documentation ready before escalating.

    Category-Specific Nuances: One Policy, Many Interpretations

    Amazon’s image policies are written as universal standards, but their enforcement and practical interpretation vary meaningfully by product category. Understanding these category-specific nuances prevents sellers from applying a one-size-fits-all approach that may be unnecessarily restrictive in some contexts and dangerously loose in others.

    Apparel and Softlines

    Apparel has among the strictest main image requirements of any Amazon category, with additional rules around product presentation on models vs. flat-lay vs. ghost mannequin formats. Amazon’s category style guide for apparel specifies which product types require a model, which may use flat-lay presentation, and size requirements for model photography. AI-enhanced apparel photography carries high risk — fabric texture, drape, and fit under real lighting conditions are almost always misrepresented by AI rendering, and the return rate signal from misrepresented apparel is a category-level metric Amazon monitors closely.

    Health and Beauty

    The Health and Beauty category has heightened sensitivity around before/after imagery, result claims in images, and anything that implies medical benefit. AI-generated imagery in this category that includes a “before/after” comparison showing health or beauty results will be flagged for claims review independent of technical compliance. Secondary images in H&B need to be particularly clean on the “accuracy” dimension — anything that implies a clinical or medical outcome needs to be supported by the product’s actual claims and Amazon’s health claims policy.

    Consumables and Grocery

    Grocery and consumables ASINs are subject to close scrutiny on serving size representation, portion accuracy, and packaging claims. AI-generated imagery that shows a serving or portion that doesn’t accurately represent the product’s actual content per package will generate customer complaints that escalate to catalog-level reviews. This category is also subject to stricter label legibility standards, since incorrect nutritional or ingredient information in product images carries regulatory risk beyond Amazon’s internal policies.

    Home and Furniture

    Furniture and large home goods are a category where AI lifestyle imagery is particularly well-suited — the scale and staging costs of physical furniture photography are enormous, and AI-generated room scenes are both more practical and often higher quality than physical staging. The compliance watch point in this category is scale accuracy — furniture product images must represent the actual dimensions of the product, and AI-generated room scenes frequently misrepresent furniture scale relative to the room, generating returns from customers whose pieces don’t fit the space they expected based on the image.

    Building Your Compliant AI Image Stack: Tools, Workflow, and Team Roles

    Pulling together everything covered in this post into a functioning workflow requires both the right tools and clearly defined team roles. The sellers and agencies who execute this consistently well are those who’ve turned what could be ad-hoc creative decisions into a documented, repeatable production system.

    The Recommended Toolchain

    Photography: Physical photography remains the foundation for main images across all categories. Smartphone photography at 4K resolution with a proper light box and white backdrop is sufficient for most product categories — you don’t need a professional studio if you have adequate light control and a stable setup.

    Background processing: For main image background removal and replacement, tools like Adobe Photoshop’s Remove Background, Canva Pro’s background removal, or dedicated tools like Pixelcut and Clipping Magic work well — but always follow with pixel-level RGB verification of the exported file.

    AI lifestyle scene generation: For secondary image lifestyle scenes, Amazon’s own Creative Studio is the recommended primary tool for advertising creatives. For listing secondary images, dedicated AI product photography platforms like Pebblely, Booth.ai, or StudioAI (purpose-built for e-commerce product photography) produce more reliable compliance-safe outputs than general-purpose generators like Midjourney or DALL-E, because they’re designed specifically for product imagery conventions.

    AI upscaling: Topaz Photo AI or Upscale.media for resolution enhancement when original photography is below 2,000px. Always re-verify background RGB after upscaling, not before.

    A+ Content design: Canva Pro or Adobe Express for A+ Content layout work, with AI-generated background scenes composited in from your preferred generator tool. These tools handle the dimension requirements and export profiles for A+ Content formats reliably.

    Team Roles and Decision Points

    In a small seller operation, a single person handles the entire image workflow. The risk there is that the same person who generates images also approves them, which eliminates the independent QA check that catches the compliance issues a creator naturally becomes blind to. Even in a one-person operation, build in a time-gap review — generate today, QA review tomorrow with fresh eyes.

    In larger operations, the workflow should have distinct roles: image production (generates and edits), compliance QA (applies the 11-point pre-submission checklist independently), and listing upload (responsible for correct slot assignment and final submission). This separation of concerns is what prevents the “I’ll fix it after” rationalization that precedes most preventable suppression events.

    Keeping Up With Policy Changes

    Amazon’s image policies evolve. Category style guides are updated, enforcement priorities shift, and new AI-detection capabilities get deployed. Build a quarterly review of Amazon’s category-specific style guides into your operational calendar — specifically the style guide for your primary categories, the Amazon Seller Central image standards page, and the Brand Registry image policy documentation if you’re brand-registered. This takes 30 minutes per quarter and prevents surprises that take days to fix.

    Compliance as a Competitive Moat, Not a Ceiling

    The most important reframe in this entire discussion is treating image compliance as a competitive advantage rather than a constraint. In a marketplace where a meaningful portion of sellers are operating with suppression risk baked into their daily workflow, the seller who has built a system that produces compliant, high-quality images consistently — without incident and without rework — has a structural operational advantage that compounds over time.

    The Compound Effect of Clean Operations

    Every suppression event costs revenue, ranking momentum, and operational attention. A listing that goes dark for 3–5 days while a suppression resolves loses sales velocity, loses organic ranking signal, and may lose paid advertising learning data in algorithm-driven campaigns. For high-velocity ASINs, even a 48-hour suppression can cost more in lost ranking recovery than a year’s worth of image QA investment would have prevented it.

    Conversely, a catalog that has never had an image suppression maintains cleaner account health metrics, builds a stronger relationship with Amazon’s systems, and faces less friction in Brand Registry reviews, A+ Content approval, and new product launch indexing. The seller who has built compliance into their production standard accumulates these small advantages invisibly — they never show up as a line item, but they compound into meaningful catalog-level performance over 12–24 months.

    The AI Opportunity That Compliant Sellers Capture

    Here is the final, practical point: the sellers who are most cautious about AI image rules are often those who haven’t built a production system clear enough to use AI safely. The sellers who embrace AI within a disciplined workflow — using it where it’s genuinely powerful (secondary images, A+ Content, advertising creatives), keeping it out of where it’s genuinely risky (main images without physical photography anchoring), and verifying output before submission — are not just staying compliant. They’re reducing production costs, increasing listing visual quality, running more creative tests, and improving conversion rates.

    Amazon’s AI image rules, read correctly, are not a constraint on AI use. They’re a constraint on careless AI use. The distinction matters enormously in practice. Build the workflow that turns them into a standard your entire catalog runs on reliably, and the rules stop being something you manage against and start being the system that generates your competitive advantage.

    Actionable Takeaways

    • Tier your AI usage explicitly: Define which image slots in your workflow can use AI generation, which require physical photography, and which can use AI post-processing only. Write this down and enforce it as a production standard, not a guideline.
    • Implement the 11-point QA checklist as a pre-submission requirement on every image. Build it into your workflow SOP so it happens consistently, not selectively.
    • Default to Amazon’s own Creative Studio for advertising creative images and Sponsored Brands. The compliance pre-screening and documented performance data (+10.3% ROAS, up to 40% higher mobile CTR) make it the lowest-risk, reliable-return choice for that specific use case.
    • Use AI aggressively in secondary images and A+ Content — this is where the creative upside lives, where enforcement is softer, and where production cost savings are most significant relative to traditional photography.
    • Build a suppression recovery protocol before you need it. Decide now who will handle a flag, what the first three actions are, and what documentation you’ll need. Having this ready reduces revenue loss per incident by days.
    • Review category style guides quarterly. Amazon’s enforcement priorities shift with minimal announcement. Staying current takes 30 minutes per quarter and prevents surprises that take days or weeks to fix.
    • Treat compliance clean-rate as a catalog KPI. Track suppression events per quarter as a proportion of your total ASIN count. A trend in the wrong direction signals a workflow problem — the fix is process, not policy knowledge.
  • Why Your Amazon Videos Aren’t Working (And the Slot-by-Slot Fix That Changes Everything)

    Why Your Amazon Videos Aren’t Working (And the Slot-by-Slot Fix That Changes Everything)

    Amazon listing video integration split-screen showing conversion rate improvement with video vs. without video

    Here’s a scenario that plays out constantly in Amazon seller communities: a brand spends time and money producing a product video — good lighting, clear narration, crisp footage — uploads it to their listing, and then nothing moves. Conversion rate stays flat. Sessions look the same. The video feels like it should be helping, but the data says otherwise.

    The problem is almost never the video itself. It’s the placement. Most sellers treat Amazon video like a single upload field: shoot something, drop it in, move on. In reality, Amazon has developed a multi-slot video ecosystem where each placement serves a different buyer psychology, appears at a different point in the purchase journey, and responds to completely different content strategies.

    Uploading one polished product demo and leaving it there is the equivalent of printing one good ad and only ever running it in one newspaper. You’ve created something valuable, but you’ve left most of the opportunity behind.

    This post maps every video slot Amazon currently offers, explains what each one actually does for your listing, walks through the technical and policy requirements that most sellers trip over before their video ever goes live, and covers what good video performance actually looks like in measurable terms. This isn’t a high-level pep talk about “adding video to your listings.” It’s a working framework for sellers who already know video matters and want to use it more deliberately.

    The Four Distinct Video Slots on Amazon (and Why They Are Not Interchangeable)

    Diagram of Amazon product listing page showing the four distinct video placement slots with labeled callout arrows

    Before getting into tactics, it helps to understand the architecture. Amazon’s video placements in 2026 fall into four distinct categories, and confusing them is the root of most video underperformance.

    Slot 1: Main Image Video

    This is the highest-leverage video position on Amazon. When uploaded correctly, the main image video appears inside the product image carousel — the set of images at the top of the product detail page (PDP). Critically, it also surfaces in search engine results pages (SERPs), meaning potential customers see your video before they click through to your listing. It autoplays as a thumbnail in certain mobile and desktop SERP placements and in the carousel on the PDP itself. This slot is available to brand-registered sellers and is capped at one video per listing. Optimal length: 12–25 seconds.

    Slot 2–9: Image Stack Videos

    These are separate video uploads that appear within the product image stack below the main carousel. They are PDP-only — no SERP exposure — and are best used for supplementary content: detailed feature breakdowns, assembly demonstrations, size-and-scale comparisons, or use-case variations. Multiple videos can occupy these positions, giving sellers a genuine content library per ASIN rather than a single video file. Brand-registered sellers get the most flexibility here, though Amazon has gradually opened some access to non-brand sellers.

    Slot 3: Premium A+ Content Video Modules

    Premium A+ Content (sometimes called A++) is a separate program from standard A+ and has its own eligibility requirements. Sellers who qualify can embed video modules directly into the enhanced description section of the listing, below the buy box. This placement captures buyers who are already engaged enough to scroll down and read more — which makes it ideal for longer-form content like full demos, brand story videos, or educational explainers. Up to three video modules can live in a single Premium A+ layout.

    Slot 4: Sponsored Brands Video

    Unlike the three slots above, Sponsored Brands Video is a paid advertising format, not a listing feature. It operates through the advertising console, uses keyword targeting and a cost-per-click auction, and places videos in search results to drive traffic to your product or Brand Store. It serves a fundamentally different strategic purpose than listing videos: it’s a traffic driver, not a conversion closer. This distinction matters enormously for how you script, structure, and measure it.

    Treating all four of these as the same thing — “Amazon video” — is where most sellers lose the thread. They produce one asset and expect it to do four different jobs. It can’t. Each slot requires a different piece of content.

    The Main Image Video Slot: Your Highest-Leverage Real Estate

    Smartphone showing Amazon SERP with product video autoplaying and the 6-second rule timeline overlay

    If you can only produce one piece of video content for a listing, it should go in the main image slot. The combination of SERP visibility and PDP carousel placement makes it the single most impactful piece of content you can add to a product page. Research from multiple seller data sources in 2026 puts the CTR lift from main image video at 8–18% compared to static image listings — and that’s organic, meaning you pay nothing for the additional clicks.

    The 6-Second Rule

    The defining constraint for main image video is that it must perform before most viewers decide to keep watching. The widely-cited benchmark in 2026 seller circles is six seconds: if the product hasn’t been shown in active use by second six, a substantial portion of viewers have already lost interest or moved on. This isn’t a soft creative guideline — it has measurable CTR consequences.

    A practical framework for structuring a 12–25 second main image video looks like this:

    • 0–2 seconds: Immediately show the core problem the product solves, or the product itself in clear action. No logos, no fade-ins, no “introducing…” narration.
    • 3–6 seconds: Lock in the hero shot — the single most visually compelling view of the product doing what it does best.
    • 7–12 seconds: Address the most common objection. For kitchen tools this might be “does it actually fit?” For tech products, “how complicated is setup?”
    • 13–20 seconds: Social proof or product payoff — what does “after” look like? If your product makes something easier, cleaner, or more enjoyable, show that outcome.
    • 20–25 seconds: Pack shot with key spec callouts (dimensions, material, compatibility) and a soft call to action.

    SERP Placement: The Hidden Advantage

    Most sellers think about video as something that helps once a customer is already on their listing. The main image slot flips this. Because it surfaces in certain SERP positions — particularly in video shelves and carousel modules on mobile — it influences the click decision before the buyer commits to a full PDP visit. That means a well-structured main image video effectively compresses the funnel: the shopper sees the product working, gains a basic level of confidence, and clicks through already partially sold.

    This pre-qualification effect is part of why the unit session rate (the percentage of PDP visits that convert to a sale) tends to be meaningfully higher when the main image video has done its job on the SERP. You’re filtering for intent before the click, not just after it.

    What This Slot Is Not Good For

    A brand story does not belong in the main image slot. Neither does a lengthy explainer or a comparison against competitor products. These formats take too long to deliver value in a short-attention SERP environment. Save them for the image stack slots or A+ modules. The main image video is a hook, not a narrative.

    Image Stack Videos (Slots 2–9): The Conversion Layer Most Sellers Ignore

    Once a buyer lands on your product detail page, the context shifts. They’ve already chosen to investigate your product — now the job is to answer every remaining question before doubt turns into a back-click. Image stack videos, occupying positions 2 through 9 in the PDP carousel, are purpose-built for this moment.
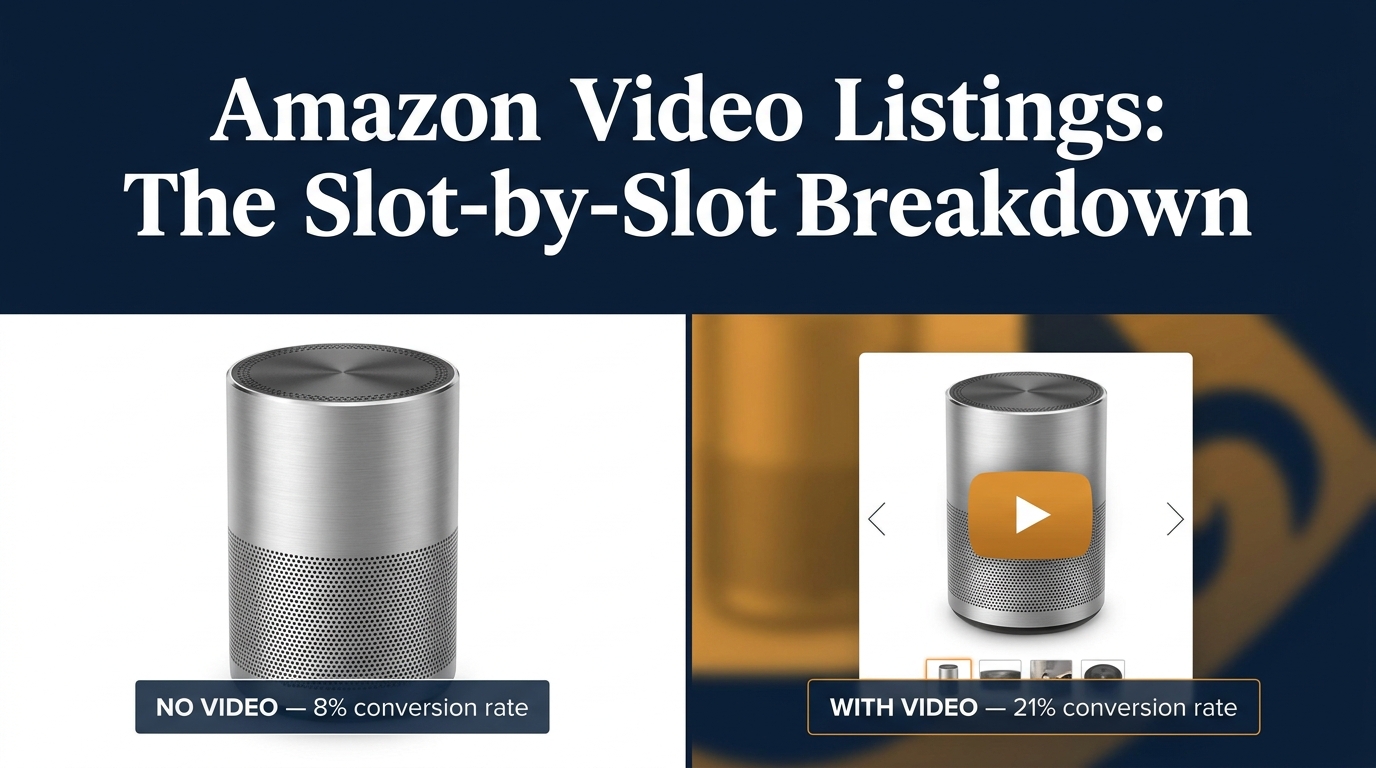
    Most sellers fill these slots with still images and consider the job done. That’s a missed opportunity. Buyers who scroll through multiple images are demonstrating active consideration — they’re still deciding. A second or third video in this sequence can catch that attention at a moment of genuine purchase uncertainty and answer exactly the question they’re wrestling with.

    Content Strategy for the Image Stack

    Think of these slots as a FAQ in video form. Map the most common pre-purchase questions buyers ask about your product — you can find these in your own Q&A section, competitor reviews, and customer service inquiries — and address each one with a short, specific video clip.

    • Assembly or setup video: For products that require any assembly, a 30–45 second assembly walkthrough eliminates one of the most common deterrents to purchase in categories like furniture, fitness equipment, and DIY tools.
    • Scale and size comparison: Apparel, home goods, and accessories suffer consistently from “it was smaller than I expected” reviews. A video showing the product next to a recognizable household object eliminates this objection cleanly.
    • Use-case variation: If your product has multiple use scenarios, each one can have its own 15–20 second demonstration. A multi-use kitchen gadget, for instance, might have separate clips showing each function rather than trying to cram everything into one video.
    • Material or quality close-up: For categories where tactile quality matters — bedding, clothing, leather goods — video can do what photography cannot: show how a material moves, drapes, or behaves under use conditions.

    SEO Value in Video Metadata

    One often-overlooked benefit of image stack videos is the metadata layer. When you upload videos to Seller Central via the “Upload and Manage Videos” tool, you can add titles and descriptions that include search-relevant terms. Amazon’s algorithm can index this metadata, which means well-titled videos with relevant keyword placement contribute to the discoverability of your listing — separate from your bullet points and backend search terms. This isn’t a primary ranking driver, but in competitive categories where sellers are fighting for marginal improvements, every indexed signal adds up.

    Premium A+ Content Video Modules: What Eligibility Actually Requires

    Bar chart showing Amazon conversion rates by video slot usage, from no video at 8% to all slots used at 23%

    Premium A+ Content is a tier above standard A+ Content, and it’s the only place on a product detail page where full video modules — not just video clips embedded in carousels — can live. This distinction matters because Premium A+ video modules present video in a more intentional, controlled format: full-width or half-width video panels with accompanying text, image carousels alongside video, and longer runtime options. The placement is below the buy box in the enhanced content section, which means it targets buyers who are already engaged and reading deeper into the listing.

    Eligibility Requirements in 2026

    Premium A+ has a specific gatekeeping structure. To unlock it, sellers must:

    1. Be enrolled in Amazon Brand Registry — this is non-negotiable across all enhanced content types.
    2. Have an approved and published A+ Brand Story on at least one ASIN in their catalog.
    3. Have at least five approved A+ Content projects submitted and approved within the past 12 months.

    This means Premium A+ is not available to new sellers or those who haven’t been actively publishing A+ Content throughout the year. The 12-month rolling window is an important detail: approvals don’t carry over indefinitely. Sellers who publish a burst of A+ Content to unlock Premium access and then go dormant may find their eligibility lapses if they don’t maintain the cadence.

    Video Module Specifications for Premium A+

    Amazon currently supports three video module formats within Premium A+:

    • Full Video Module: Minimum resolution 960x540px. The video dominates the content block. Best for brand or product story content that benefits from a cinematic presentation.
    • Video with Text Module: Minimum resolution 800x600px. Splits the content block between video and a text panel, allowing you to narrate key benefits while the video demonstrates them visually.
    • Video with Image Carousel Module: Minimum resolution 800x600px. Pairs a video with a scrollable image strip — useful for showing multiple colorways, configurations, or use cases alongside a master demo.

    All Premium A+ videos must be in MP4 format. Amazon’s review time for video submissions runs 24–72 hours, and the policy review is stricter here than for image stack videos because Premium A+ is more prominently positioned on the page.

    What Actually Performs Well in A+ Video Modules

    The buyer reading your A+ section is a high-intent shopper who hasn’t yet converted — but they’re doing their due diligence, not quickly scanning. That changes what good video content looks like in this placement. Short demos and fast hooks are less relevant here. Instead, A+ video modules reward:

    • Product origin or brand story — particularly effective for brands with a meaningful founding story, artisan manufacturing process, or sustainability angle.
    • Deep feature education — technical products benefit from a two-minute walkthrough that would be too long anywhere else on the listing.
    • Before-and-after demonstrations — showing a clear transformation (cleaner grout, better organized space, improved posture) hits hardest with buyers in the consideration phase.
    • Comparison to alternatives — Premium A+ does allow general category comparisons (your product vs. the “traditional” approach), though competitor brand mentions remain prohibited under Amazon’s video policy.

    Sponsored Brands Video vs. Listing Video: Two Completely Different Jobs

    Side-by-side comparison of Sponsored Brands Video and Listing Video showing their different strategic purposes

    This is one of the most persistently confused distinctions in Amazon video strategy. Sellers routinely repurpose their listing videos as Sponsored Brands Video ads — or vice versa — and then wonder why results are underwhelming. The two formats are not interchangeable because they operate at completely different points in the purchase journey and serve completely different goals.

    Sponsored Brands Video: A Traffic Driver

    Sponsored Brands Video ads appear in search results — above, below, or within organic listings — and are paid placements competing in a keyword-based CPC auction. Their job is to attract clicks from shoppers who are actively searching but haven’t chosen a product yet. The video must work as an attention capture mechanism: stop the scroll, communicate a compelling reason to click, and drive traffic to your listing or Brand Store.

    Key characteristics of effective Sponsored Brands Video content:

    • Length: 6–30 seconds maximum. Amazon enforces a 45-second cap, but top-performing ads tend to run 15–20 seconds. Shorter is almost always better here.
    • Product first: The product must appear within the first 1–2 seconds. There is no time for a logo reveal or brand intro when you’re competing against eight other listings on a SERP.
    • No audio dependency: Many shoppers browse with sound off. Sponsored Brands Video ads should communicate their full message through visuals and on-screen text alone, with audio as an enhancement rather than a requirement.
    • CTA orientation: Every second of a paid ad has a direct cost. The creative should move viewers toward a click, not educate them in detail. Depth belongs on the product page.

    Listing Video: A Conversion Closer

    Listing video (whether in the main image slot, image stack, or A+ modules) operates post-click. The buyer is already on your product page — the traffic is paid for or organically earned. Now the question is whether you convert them. This means listing video can and should be more thorough, more patient, and more objection-focused than Sponsored Brands Video.

    A 45-second listing video that walks through setup, demonstrates three use cases, and shows scale is entirely appropriate. The same video in a Sponsored Brands slot would be dead on arrival — most viewers would scroll past it within the first 10 seconds.

    The practical implication: if you’re producing video on a budget and can only create one piece of content, use it as a listing video (specifically in the main image slot) rather than as a Sponsored Brands ad. Your listing video works for free, indefinitely. Your Sponsored Brands video costs money every time someone clicks.

    Measuring Each Format Separately

    Because these two placements serve different strategic objectives, they require different success metrics. Sponsored Brands Video performance is measured primarily by CTR, CPC efficiency, and attributed sales from ad traffic. Listing video performance is measured by unit session rate (conversions per page visit), video view rate, and organic ranking signals. Blending these metrics together — tracking a single “video performance” number across both formats — is how sellers end up unable to diagnose what’s actually working.

    How Amazon’s A10 Algorithm Treats Video Engagement Signals

    Amazon doesn’t publicly document its ranking algorithm in detail, but the behavior of the system in 2026 makes certain things reasonably clear. The algorithm iteration commonly referred to as A10 — the framework that governs organic product ranking in search results — places meaningfully more weight on post-click engagement signals than the earlier A9 version did.

    What A10 Is Measuring

    Where A9 prioritized historical sales velocity and keyword relevance above most other signals, A10 layers in behavioral engagement data: how long shoppers spend on a listing, how deeply they scroll, whether they interact with images, and — crucially — whether they engage with video content. Video plays, watch duration, and re-plays are all part of this engagement picture.

    The mechanism is straightforward: a shopper who watches 80% of your product video before adding to cart is demonstrating dramatically higher purchase intent and product-fit confidence than one who bounced after two seconds. That behavioral signal tells Amazon’s algorithm that the listing is doing a good job matching customer expectations — which rewards the listing with better organic placement over time.

    The Indirect Ranking Benefit of Video

    Beyond direct engagement signals, video contributes to organic ranking through a second-order effect: reduced return rates. Products with clear video demonstrations tend to generate fewer returns because buyers arrive with realistic expectations of what they’re receiving. Amazon tracks return rates by ASIN, and high return rates suppress listings in organic rankings. A thorough demonstration video that accurately represents the product — particularly one that shows size, material, and assembly — is a return-rate management tool as much as it’s a conversion tool.

    Lower returns → higher seller metrics → better algorithmic positioning. The chain is indirect but real.

    Dwell Time and the Session Quality Signal

    One of the clearest ways to see A10’s engagement sensitivity in practice is to watch what happens to a listing’s organic ranking after a high-quality video is added. In categories where competing listings are video-free, adding a main image video that keeps shoppers on the page for 20+ additional seconds can produce an organic ranking lift within 2–4 weeks — even without a change in ad spend or external traffic. This dwell time effect has been consistently observed across Home & Kitchen, Beauty, and Sports & Outdoors categories in particular.

    Video Content Strategy by Product Category

    Not all categories respond to video the same way, and treating them identically is a recipe for mediocre results across the board. The type of video that drives the most conversions varies significantly based on how buyers in that category make decisions.

    Beauty and Personal Care

    This is the highest-converting category on Amazon platform-wide, with organic conversion rates reaching 15–25% for well-optimized listings. Video in beauty serves one primary purpose: demonstrating results. Before-and-after videos, application technique walkthroughs, and texture close-ups answer the questions static images genuinely cannot. Skin tone representation matters too — showing the product used across different skin tones and hair types removes a major uncertainty for a significant portion of buyers. In this category, user-generated style content (less produced, more authentic) consistently outperforms studio-polished product demos because authenticity is the trust signal buyers are looking for.

    Home and Kitchen

    Assembly, size, and function are the three dominant concerns in Home & Kitchen. The “it was smaller than I expected” return is endemic to this category, and a 10-second video showing the product next to a standard dinner plate or smartphone eliminates it almost entirely. Function videos — actually showing the product being used in a real kitchen or living space rather than against a white background — convert significantly better than clean studio shots because they answer the core question: “What will this look like in my home?”

    Electronics and Tech

    Setup complexity is the largest conversion barrier in electronics. A screen-recorded or camera-captured setup walkthrough — not a polished marketing overview of features — reduces purchase hesitation dramatically. In this category, buyers who abandon listings often do so because they can’t tell if the product will work with their existing setup. A compatibility demo, a “what’s in the box” inventory clip, and a quick setup walkthrough together address this better than any combination of bullet points.

    Sports, Outdoors, and Fitness

    Motion is the differentiator here. Products that come alive in use — resistance bands, hiking gear, sports accessories — look flat in static images and dynamic in video. The best videos in this category show the product under realistic use conditions: actual terrain for outdoor gear, actual workouts for fitness equipment, actual sweat and movement for athletic apparel. Nothing in a studio with fake grass. Buyers in these categories are evaluating durability and performance credibility, not brand aesthetics.

    Clothing and Accessories

    Fit and drape are the core questions that static imagery can never fully answer. A 15-second video of a model moving, sitting, turning, and showing the garment from multiple angles at multiple distances addresses size uncertainty more effectively than any combination of images and size charts. For accessories, a scale video showing the product being used by a real person — rather than in isolation — eliminates the most common source of post-purchase disappointment in the category.

    Technical Specifications That Sink Otherwise Good Videos

    Checklist of top Amazon video rejection reasons with red X marks against each violation

    Amazon’s video review process is not forgiving about technical non-compliance. A video that fails specification review goes into a rejection queue that can take 24–72 hours to return a verdict — meaning a failed upload costs you several days before you even find out there’s a problem. Getting the specs right before upload is non-negotiable.

    Universal Technical Requirements

    These specifications apply across all Amazon listing video types:

    • Format: MP4 is the required format for all video uploads. MOV files may be accepted through some upload pathways but MP4 is the safest choice.
    • Codec: H.264 or H.265. H.264 is the safer default for maximum compatibility with Amazon’s processing pipeline.
    • Aspect ratio: 16:9 is standard for most placements. 1:1 square format is acceptable for some mobile placements but 16:9 should be the production default.
    • Minimum resolution: 1280x720px (720p HD) for standard listing videos. Premium A+ Full Video Module requires a minimum 960x540px, while Video with Text and Image Carousel modules require 800x600px minimum — though producing at 1080p and downscaling is always preferable.
    • Frame rate: 23.976, 24, 25, 29.97, or 30 fps. Anything outside this range risks rejection or processing artifacts.
    • No letterboxing: Black bars on any edge of the video — top, bottom, left, or right — trigger immediate rejection. Crop your content to fill the frame completely.
    • No black leader frames: The video must not start or end with more than a split-second of black. Amazon’s review tool catches leader frames and flags them consistently.
    • Audio: Stereo audio at 44.1kHz or 48kHz sample rate. Audio with excessive background noise, clipping, or silence where narration is expected tends to generate flags in the content review process even when it technically passes spec.

    Slot-Specific Resolution Notes

    The main image video slot and image stack slots have the most flexibility with aspect ratio, but the standard 16:9 1080p format covers every slot without adaptation. If you’re producing separate videos for different placements, Premium A+ module specs are the most finicky — always check the current Amazon Seller Central video guidelines before final export, as these specs have shifted over the past 18 months.

    The Rejection Trap: Policy Violations That Kill Your Video Before It Goes Live

    Technical compliance and policy compliance are two separate review gates on Amazon, and sellers who nail the specs still get rejected on content grounds with surprising frequency. Understanding Amazon’s video content policies in advance of production — not as an afterthought during upload — saves significant time and production cost.

    The Most Common Policy Violation: Pricing and Promotional Claims

    Any reference to price — a specific dollar amount, a percentage discount, a “limited time offer,” or language like “buy two get one free” — will cause immediate rejection. Amazon’s policy rationale is that videos must be evergreen: the listing page is dynamic (prices change constantly), so any video with pricing content would be misleading minutes after it goes live. This is a harder constraint than it sounds, because promotional language is deeply habitual in marketing content. “Best value kitchen knife” is fine; “only $24.99 for a limited time” is a rejection.

    Competitor and Marketplace References

    Mentioning competing brands by name, referencing other retail platforms (“also available at Walmart”), or making explicit comparisons that name competitors will trigger rejection. Amazon’s policy here is about maintaining the integrity of the marketplace — your listing page exists within Amazon’s ecosystem, and Amazon won’t host content that promotes elsewhere.

    Note: general category comparisons are allowed. “Better than traditional single-blade razors” is acceptable. “Better than [competitor brand name] razors” is not.

    Customer Reviews and Star Ratings

    Displaying customer review quotes, star ratings, or review counts on screen — even your own authentic reviews — violates Amazon’s video policy. This surprises many sellers who consider their review content to be fair use for marketing purposes. Amazon treats review display in video as a separate content moderation concern, likely due to risks around selective quoting and review manipulation optics. Leave reviews out of your video entirely.

    Fake UI Elements and Visual Deception

    Overlaid graphics that mimic Amazon’s interface — fake “Add to Cart” buttons, fake shopping cart animations, fake play button overlays — are rejected on sight. So are countdown timers, fake urgency badges, and any visual elements designed to mimic Amazon’s native UI. Beyond policy compliance, this practice tends to perform poorly anyway: buyers can tell when they’re being psychologically manipulated, and fake urgency in video content erodes trust more than it drives conversions.

    Audio-Only Policy Note

    If your video includes narration, it must be entirely in English for the US marketplace. Background music is allowed, but must not contain lyrics that reference pricing, competitors, or third-party intellectual property without licensing. The audio content undergoes the same policy review as the visual content.

    Production Without a Big Budget: What Actually Works

    Smartphone filming product on simple home studio tabletop setup with text overlay reading you don't need a 5000 dollar production

    One of the more useful findings from 2026 Amazon video data is that user-generated-style content — less produced, more authentic — converts 23% higher than polished studio video. This isn’t a license to upload shaky, unlit phone footage. It’s a signal that buyers are responding to perceived authenticity rather than production polish. Understanding this distinction changes how you should approach video production.

    The Minimum Viable Video Setup

    A setup that produces commercially acceptable Amazon video can be assembled for under $300:

    • Camera: A modern smartphone (any flagship from the past three years) shoots at 4K and handles the lighting environments Amazon requires without issue. You don’t need a dedicated camera.
    • Tripod or stabilizer: Shaky footage is one of the most common reasons otherwise acceptable videos feel amateur. A $30–50 smartphone tripod with a fluid head eliminates this entirely.
    • Lighting: A single good LED ring light or a softbox panel at a 45-degree angle produces clean, professional lighting for product video. Natural light near a large window works in a pinch but creates scheduling constraints.
    • Backdrop: A roll of white seamless photography paper costs roughly $30 and produces the clean background most product categories require. For lifestyle categories, a well-composed real environment (kitchen, living room, outdoor space) outperforms a studio backdrop.
    • Editing: DaVinci Resolve (free), CapCut (free), or iMovie handles the color correction, clip trimming, and subtitle overlay that most Amazon listing videos require. You don’t need Premiere Pro for a 25-second product demo.

    Scripting for Conversion, Not Production Value

    The most impactful skill in low-budget Amazon video is scripting before you shoot. Sellers who start filming without a clear shot list and script structure produce hours of raw footage and spend twice as long in editing. A tightly scripted 25-second video with clear transitions, a logical demo sequence, and an end-frame benefit summary outperforms an improvised 90-second walkthrough in every measurable way.

    Before the camera turns on, write down these three things: (1) the single most compelling thing your product does, (2) the biggest reason a buyer might not purchase, and (3) what “success” looks like after using the product. Your video script is those three answers, shown in sequence.

    When to Hire Out

    There are genuine cases for professional video production — primarily for Premium A+ brand story videos where cinematic quality reinforces brand positioning, and for Sponsored Brands Video ads where the production quality reflects on your brand credibility in a competitive SERP context. For main image videos and image stack content, the ROI on professional production rarely justifies the cost over a well-executed in-house production. Focus professional production budget on the slots that benefit most from elevated quality.

    Measuring What Matters: KPIs for Amazon Video Performance

    Video on Amazon is not a “set it and forget it” investment. The placements require ongoing monitoring because performance degrades over time as competitor content improves, shopper expectations shift, and your own product’s market position evolves. Building a measurement framework from the start prevents the common situation where a seller uploads a video, stops looking at it, and has no idea whether it’s contributing to results.

    Primary KPIs by Video Slot

    Main Image Video:

    • CTR from SERP (Click-Through Rate): This is the primary signal that your SERP-visible video is working. Benchmark CTR by category — if yours is below the average for your category, your first six seconds aren’t landing.
    • Unit Session Rate (USR): The percentage of detail page sessions that result in a purchase. USR tells you whether your listing as a whole is converting traffic once it arrives. Video is a significant contributor to USR movement.

    Image Stack Videos:

    • Return Rate: A successful image stack video strategy — particularly assembly and scale demonstration videos — should produce a measurable reduction in the primary return reason. Track return reasons in Seller Central’s “Return Reports” and monitor for shifts after video is added.
    • Q&A Volume: If buyers are asking pre-purchase questions that your videos answer, video is not doing its job. A drop in repetitive Q&A submissions after video deployment is a proxy signal for video effectiveness.

    Premium A+ Video Modules:

    • A+ Content Page Views vs. Pre-A+ Baseline: Compare session duration and scroll depth on your PDP before and after Premium A+ deployment. Longer session times indicate buyers are engaging with the extended content.
    • Organic Ranking for Secondary Keywords: Premium A+ content — including video modules — can contribute to ranking improvements on non-primary keywords over time. Tracking ranking position for 10–20 target keywords on 60-day intervals reveals this effect.

    Sponsored Brands Video:

    • CTR: Industry average for Sponsored Brands Video CTR on Amazon sits in the 0.4–1.2% range in most categories. Below-average CTR with above-average impressions indicates the creative isn’t stopping the scroll.
    • ROAS (Return on Ad Spend): The primary financial metric for paid video. Benchmark against your existing Sponsored Products ROAS to determine whether video ads are delivering incremental value or simply shifting spend between formats.
    • New-to-Brand %: One of the unique metrics Amazon provides for Sponsored Brands: the percentage of attributed sales that came from buyers who hadn’t purchased from you in the past 12 months. High NTB% confirms the video is doing its awareness job.

    A/B Testing Video Content

    Amazon’s Manage Your Experiments (MYE) tool supports A/B testing for A+ Content and, in some cases, for main image content. This gives brand-registered sellers a structured way to test video variants — different hooks, different structural approaches, different video lengths — against a real traffic split rather than guessing based on gut feel. For high-traffic ASINs, a 30-day MYE experiment comparing two main image video approaches can provide statistically meaningful data about which content structure drives higher USR. This is one of the most underutilized optimization tools available to brand-registered sellers.

    Building a Video Content Roadmap for Your Catalog

    Video strategy gets genuinely complicated when you’re managing a catalog with dozens or hundreds of ASINs. Prioritizing where to invest first — and in what sequence — is as important as the production quality of individual videos.

    Prioritization Framework

    Start with your highest-traffic, highest-revenue ASINs. These are the listings where a 2–3% unit session rate improvement translates into the most incremental revenue. If you sell 500 units per month of a $45 product and improve USR from 12% to 15%, that’s roughly 125 additional units monthly — a meaningful number on a single ASIN. Apply that same improvement to your top 10 ASINs and the cumulative effect is significant.

    Within those high-priority ASINs, deploy video in this sequence:

    1. Main image video first — highest single-asset ROI.
    2. Top-objection image stack video second — addresses the most common conversion barrier.
    3. Sponsored Brands Video third — once the listing is optimized for conversion, paid traffic amplifies rather than wastes impressions.
    4. Premium A+ video fourth — reserved for brand-building and deeper education on your most strategic products.

    For lower-traffic ASINs, a single well-executed main image video is usually sufficient. Spreading production resources across every slot on every ASIN produces diminishing returns quickly. Depth on your best listings outperforms shallow coverage across your full catalog.

    Evergreen Video vs. Refresh Cadence

    Listing videos should be produced with evergreen content in mind — no seasonal references, no price language, no trend-dependent imagery — so they remain relevant for 18–24 months without re-production. That said, the market doesn’t stand still. Competitor videos improve, new product features get added, and buyer expectations shift. Build a quarterly review into your listing management process: watch your own videos with fresh eyes, check what top-performing competitors are doing in your category, and assess whether your content is still answering the questions buyers are actually asking. Proactive refreshes before performance visibly degrades are far less disruptive than emergency re-shoots after a conversion rate drop.

    Conclusion: Stop Treating Amazon Video as a Single Tactic

    Amazon’s video ecosystem in 2026 is substantially more sophisticated than most sellers’ approach to it. The gap between sellers who upload one video and sellers who deploy a deliberate, slot-specific video strategy across their top ASINs is measurable in conversion rates, organic ranking positions, and return rates — and it’s a gap that’s widening as category competition intensifies.

    The sellers winning with video aren’t winning because they have higher production budgets. They’re winning because they understand that each slot on Amazon’s product page represents a different moment in the buyer’s decision process, and they’ve matched the right content to each moment.
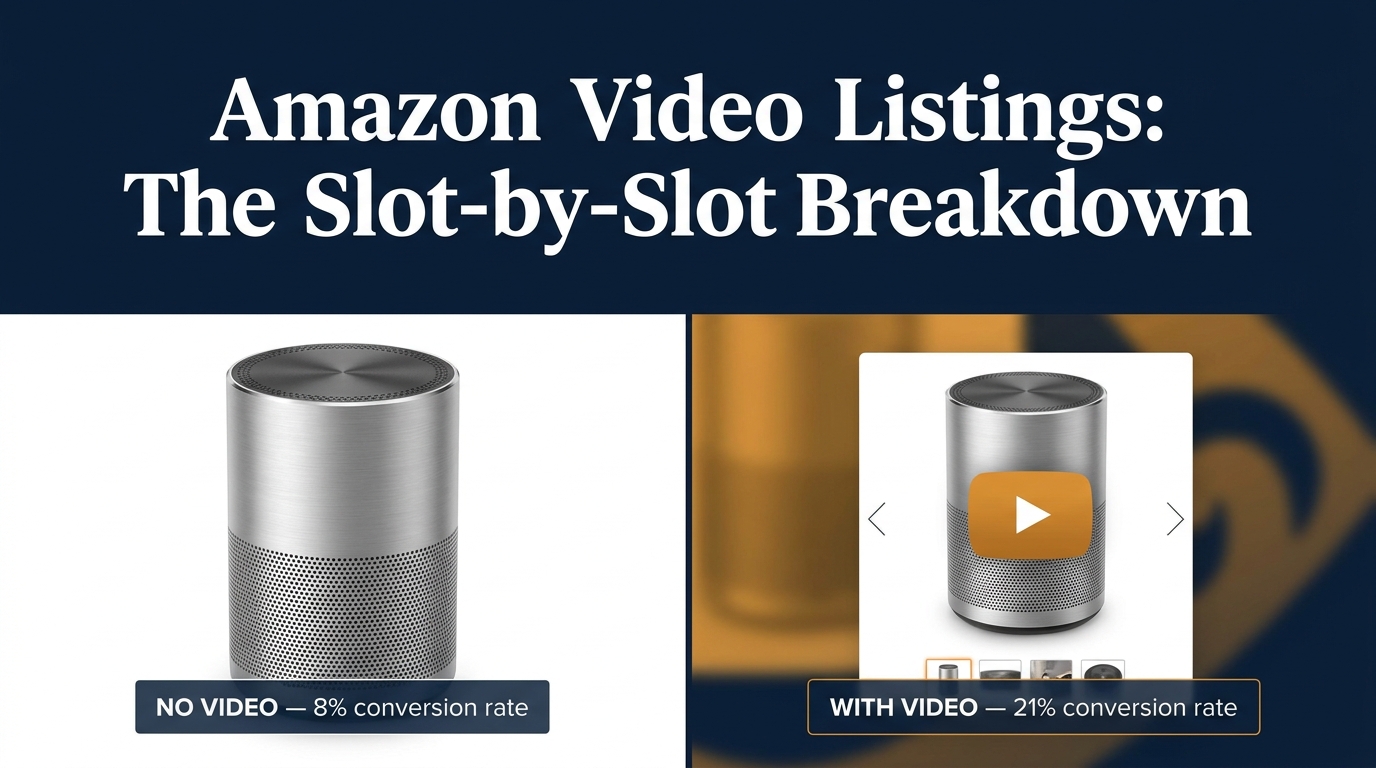
    Here are the core takeaways to act on:

    • Identify your highest-traffic ASINs and audit their video coverage — how many of the available slots are currently used, and what’s in them?
    • Produce a main image video for your top five ASINs first, following the 6-second rule and keeping total length under 25 seconds.
    • Map your most common customer objections and create one targeted image stack video for each, deployed on your top-revenue listings.
    • Check your Premium A+ eligibility — if you have Brand Registry and the requisite A+ approvals, you’re leaving video module real estate unused if you haven’t built Premium A+ layouts.
    • Separate your video measurement by slot — Sponsored Brands Video CTR and listing video unit session rate are different metrics serving different objectives, and blending them obscures what’s working.
    • Review and refresh videos on a quarterly basis — evergreen production extends the lifespan, but the content should still be reviewed against what buyers are currently asking and what competitors are currently doing.
    • Run MYE experiments on your main image videos if you have sufficient traffic — there’s no better way to determine which video structure converts better than a real A/B test against live traffic.

    Video integration on Amazon is not a feature to check off a list. It’s an ongoing content strategy with multiple layers, each contributing in a distinct way to how shoppers find, evaluate, and ultimately choose your products. Build it deliberately, measure it rigorously, and treat it as a living part of your listing — not a one-time production task.

  • AR Features in Amazon Listings: The Seller’s Practical Guide to 3D Models, Virtual Try-On, and What It Actually Does to Your Conversion Rate

    AR Features in Amazon Listings: The Seller’s Practical Guide to 3D Models, Virtual Try-On, and What It Actually Does to Your Conversion Rate

    A smartphone displaying an augmented reality furniture shopping experience, showing a modern sofa being virtually placed in a bright, minimalist living room through the phone's camera

    Most Amazon sellers talk about augmented reality features the same way they talked about A+ Content five years ago — as a “nice to have” that sounds impressive in a mastermind but never quite makes it onto the priority list. That’s a mistake, and increasingly a costly one.

    Amazon’s AR ecosystem has quietly grown into a multi-tool suite covering furniture, footwear, eyewear, tabletop items, and general product visualization — and the brands actively using it are seeing measurable results while their competitors are still debating whether it’s worth the effort. Across the broader e-commerce landscape, products with AR or 3D content see conversion rate lifts in the range of 15–94% depending on category and engagement level, and return rates drop by 22–40% for shoppers who interact with AR before buying.

    But the real story isn’t the headline numbers. It’s the mechanics — specifically, what Amazon’s AR tools are, which sellers can actually access them, what the technical requirements look like in practice, what it costs to get set up, and where the genuine opportunity sits right now in 2026. That’s what this guide covers.

    This isn’t an overview of what augmented reality is. It’s a working resource for brand-registered sellers who want to understand Amazon’s AR tools at the level of implementation, not concept. Whether you sell furniture, shoes, kitchen appliances, electronics, or anything in between, there’s something actionable here — starting with clearing up the common misconception that AR on Amazon is one single feature.

    What Amazon’s AR Suite Actually Looks Like — Three Distinct Tools

    The first thing to understand is that “AR on Amazon” is not one feature. It’s a suite of at least three separate tools, each targeting a different shopping context and product type. Sellers often conflate them, which leads to either chasing eligibility that doesn’t apply to their category or missing the tool that does apply.

    View in Your Room

    This is Amazon’s flagship AR placement tool. It uses your phone’s camera to overlay a to-scale, photorealistic 3D model of a product directly into your physical environment. You point the camera at a space — a corner of your living room, a desk, a kitchen counter — and the product appears in that space, sized accurately, rotatable, and movable.
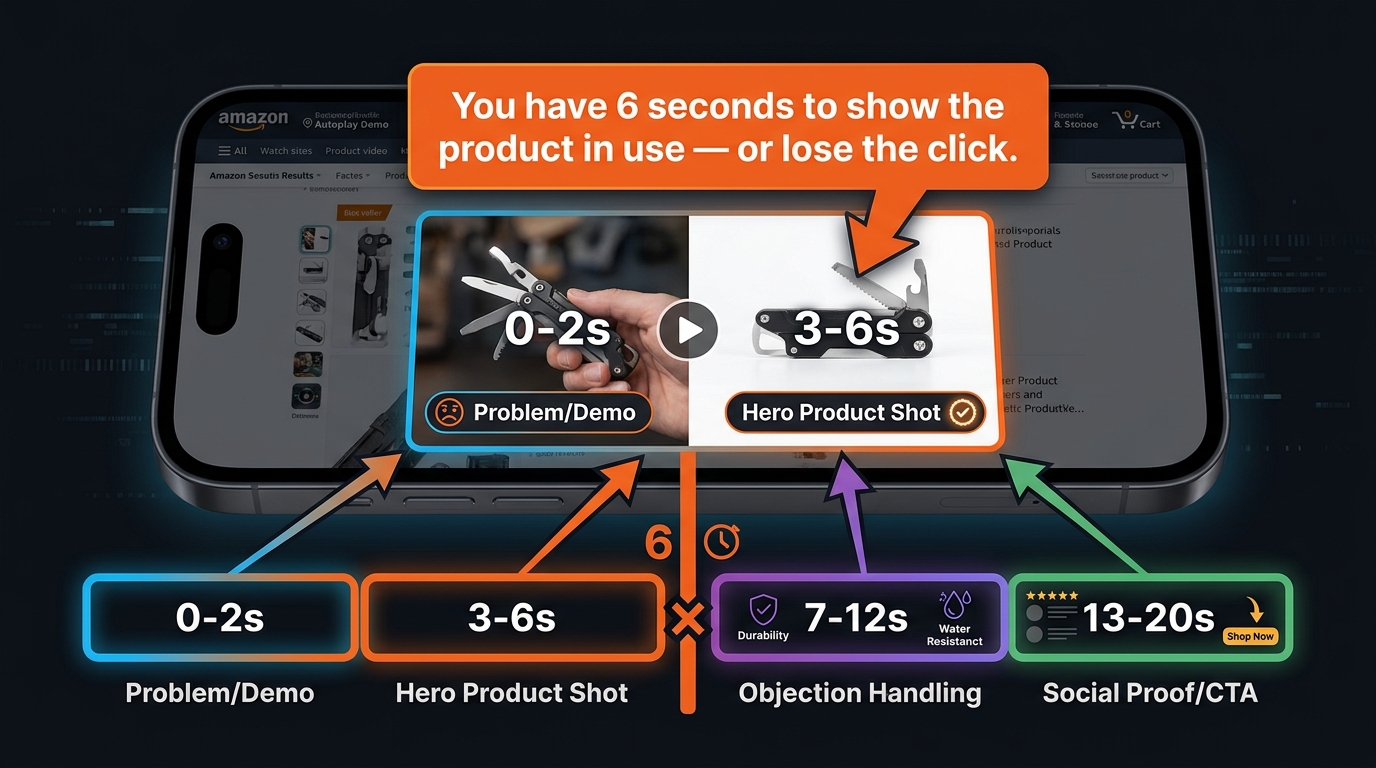
    Originally launched for furniture and large home décor, Amazon has since expanded it to include tabletop items: lamps, coffee makers, small appliances, and similar products that sit on surfaces rather than floors. The update that enabled tabletop placement was significant because it extended AR viability to a much broader set of home and kitchen sellers who previously couldn’t use the feature.

    Users access it through the Amazon Shopping app (iOS and Android) by tapping the “View in Your Room” button on eligible product detail pages. They can arrange multiple products together in the same virtual space, save their room layouts for later, and add items to their cart directly from the AR view. That last point matters: the path from visual engagement to purchase is frictionless by design.

    Virtual Try-On

    This tool lets shoppers see how wearable items look on their own body before purchasing. The feature currently covers shoes, eyewear, and apparel (specifically T-shirts as of 2026). For footwear, the camera overlays the shoes on the shopper’s actual feet in real time. For eyewear, the same logic applies to the face using the front-facing camera.

    Major brands including Puma, Reebok, Adidas, New Balance, UGG, Birkenstock, and Saucony participate in the shoes program. The feature launched for footwear in June 2022 and has gradually expanded its brand roster and category coverage since. Access for smaller sellers is more restricted here than with View in 3D — Virtual Try-On appears to operate through brand partnership arrangements, particularly through Amazon Fashion, rather than a standard self-serve upload process.

    View in 3D

    This is the most widely accessible of the three. View in 3D allows shoppers to rotate, zoom, and examine a 3D model of a product directly within the product detail page — without needing to point their camera at a physical space. It’s essentially a 360-degree interactive model viewer embedded in the listing.

    For sellers, this is the most realistic entry point into AR because it’s self-serve (for brand-registered sellers), covers the broadest range of eligible categories, and works on both mobile and desktop. It doesn’t require the shopper to be in a specific environment or have their camera active. They simply interact with the model on screen.

    All three features share one underlying requirement: a high-quality 3D model in GLB or GLTF format. That’s where the practical work happens.

    The Imagination Gap: Why Visual Uncertainty Is Costing You Sales

    Split-screen comparison showing two identical product listings side by side, one with basic flat photos and low engagement metrics, the other with an AR-enabled listing and high conversion charts

    There’s a concept in e-commerce called the “imagination gap” — the cognitive distance between what a shopper sees in product images and what they can realistically picture in their own home, on their own body, or in their specific context. This gap is one of the primary drivers of purchase hesitation, cart abandonment, and post-purchase returns.

    Traditional product photography, even excellent photography, only partially closes this gap. A well-lit photo of a sofa on a white background tells you what the sofa looks like. It does not tell you whether the sofa will fit between your TV stand and your window, whether the grey will clash with your existing rug, or whether the arms will clear your coffee table. Shoppers have to guess — and many of them choose not to guess at all.

    Returns as a Measure of the Imagination Gap

    Online return rates in the U.S. have become a significant cost center for e-commerce businesses. The majority of returns in categories like furniture, apparel, and home goods are driven by items that arrived looking different than expected or didn’t fit the physical space as imagined. This is the imagination gap made concrete — and returnable.

    Data from retail AR deployments consistently shows a 22–40% reduction in return rates when shoppers have used AR to preview a product before purchasing. That’s not a marginal improvement. For a seller moving $500K annually with a 12% return rate, even a 25% reduction in returns translates to meaningful cost recovery — both in direct return processing costs and in inventory condition degradation.
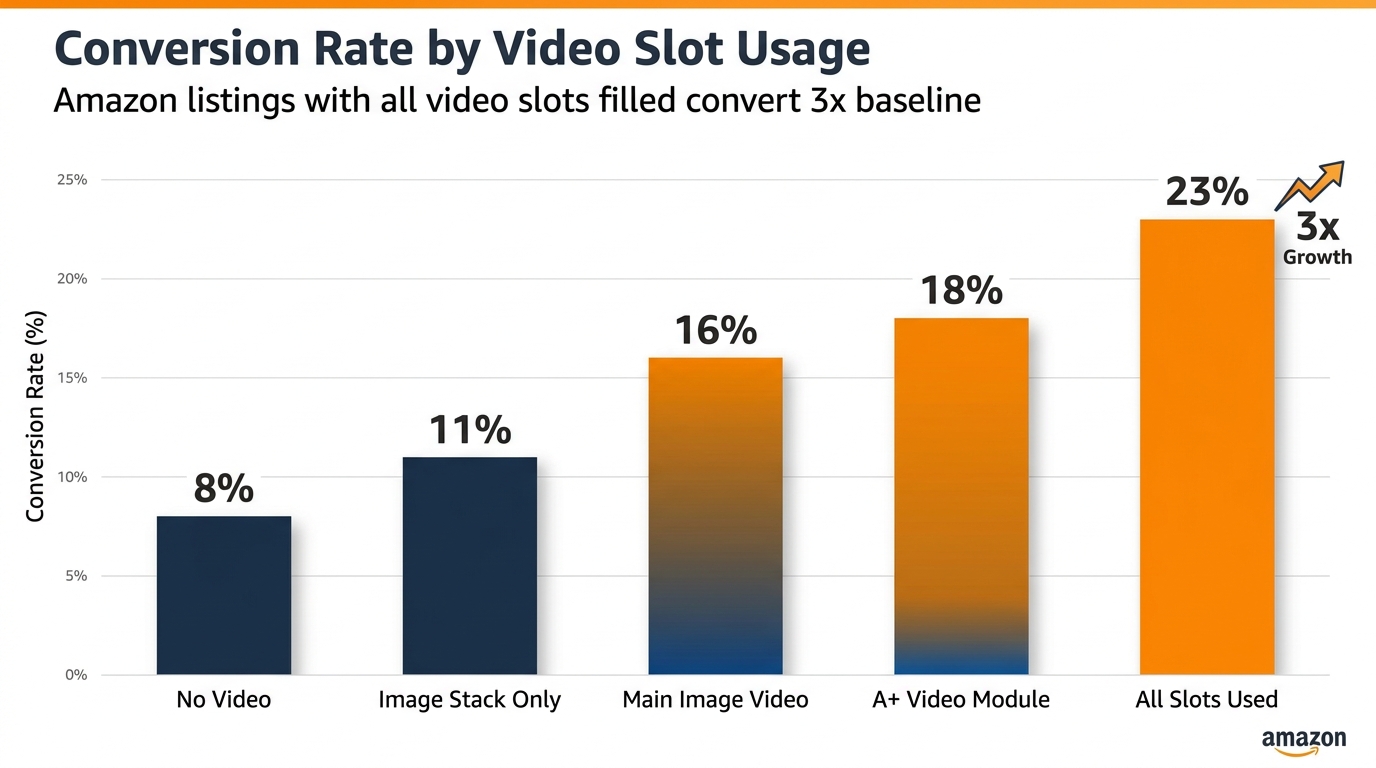
    Why Flat Images Reach a Ceiling

    There is a ceiling on what static photography can accomplish in closing the imagination gap. You can add lifestyle images, you can shoot from multiple angles, you can include a reference shot with a person to show scale — and all of that helps. But it still requires the shopper to mentally translate what they’re seeing to their specific context.

    AR eliminates that translation requirement. The product is literally placed into the shopper’s actual environment. The scale question is answered. The fit question is answered. The colour question — in real lighting, not studio lighting — is answered. That’s a qualitatively different experience, and the engagement metrics reflect it: shoppers who interact with AR features are converting at roughly double the rate of those who view standard listing images only.
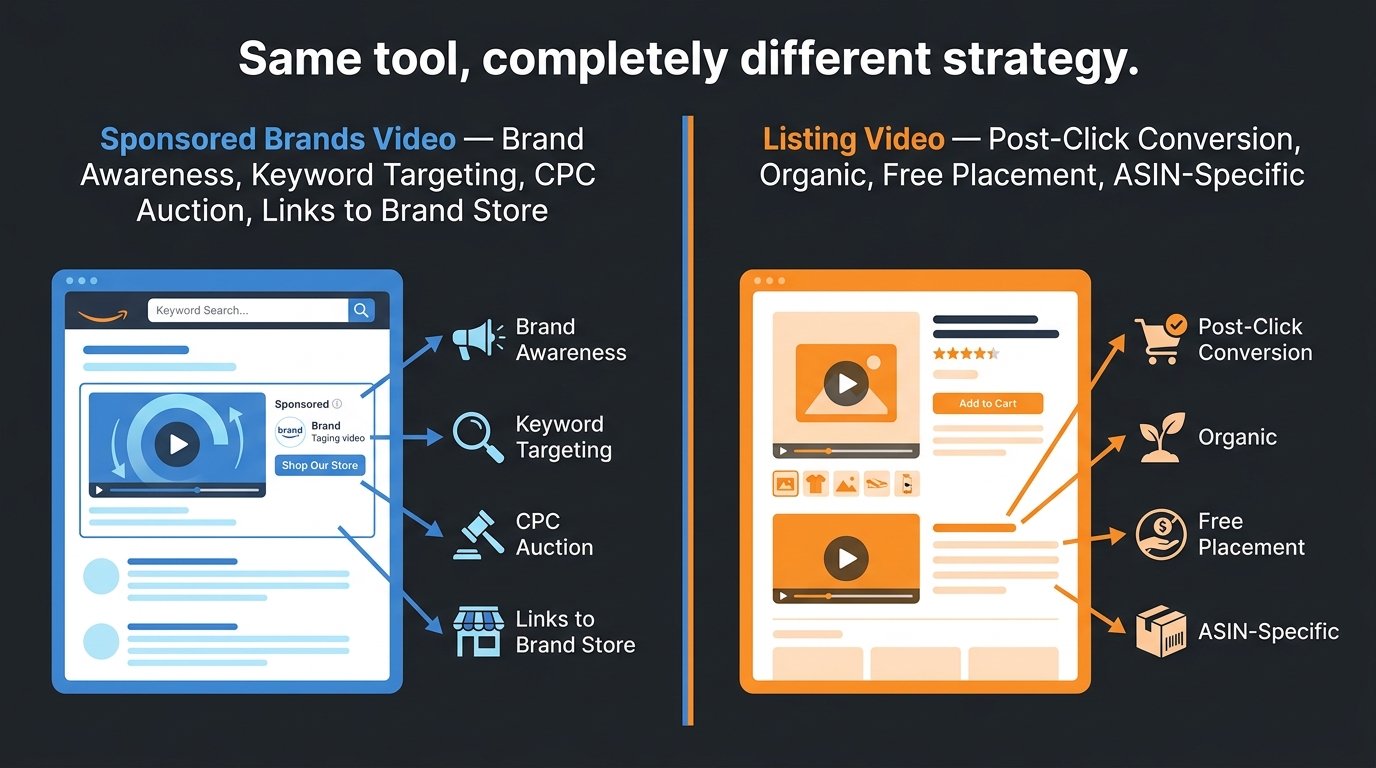
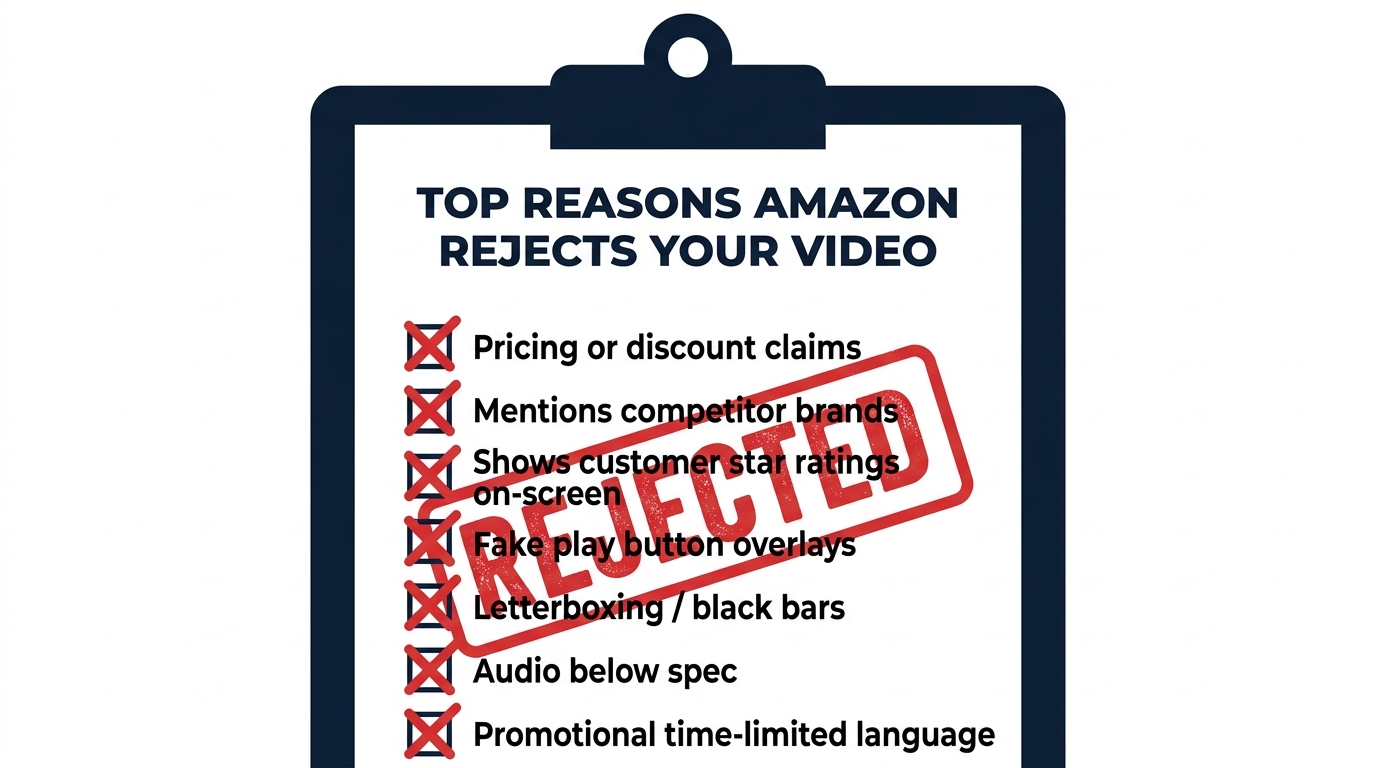
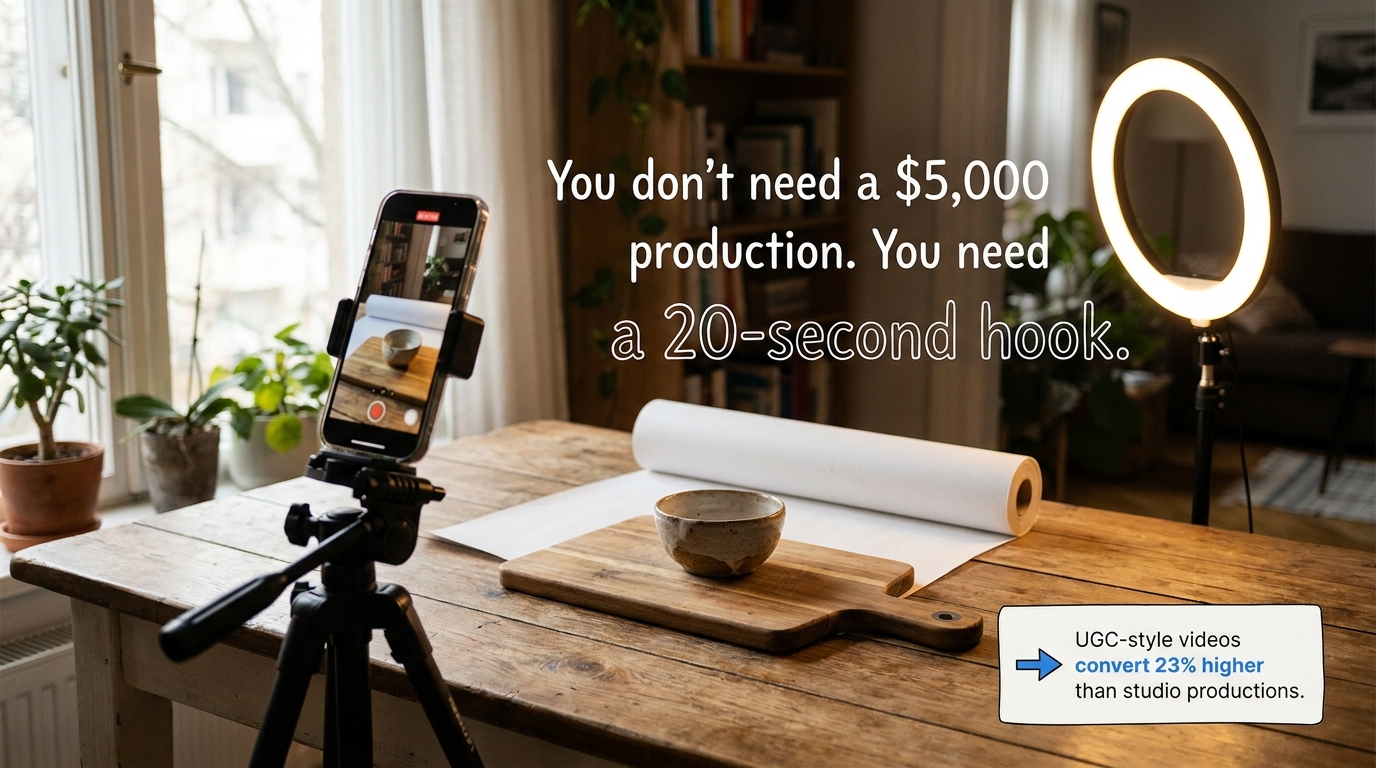
    The Trust Signal Effect

    Beyond the practical utility, AR features carry a secondary benefit that’s harder to quantify but genuinely real: they signal confidence. A brand that offers View in Your Room for its furniture is implicitly telling the shopper, “We’re confident enough in what this looks like that we’ll let you see it in your own space before buying.” That confidence is contagious. Shoppers internalize it as a quality signal, which softens hesitation in the same way a strong return policy does — except AR reduces the need for returns in the first place.

    View in Your Room: What Sellers Need to Know Beyond the Surface

    Most coverage of View in Your Room stops at “it lets you see furniture in your room.” For sellers actually trying to get their products into this feature, the important details are more granular.

    Eligible Product Categories

    View in Your Room eligibility covers a wide range of home-adjacent categories. The core categories include:

    • Furniture: sofas, chairs, tables, beds, shelving, storage
    • Home décor: rugs, art, mirrors, decorative objects
    • Lighting: floor lamps, table lamps, pendant fixtures
    • Small appliances and tabletop items: coffee makers, air fryers, blenders, toasters (added in recent updates)
    • Consumer electronics: TVs, monitors, desktop speakers
    • Home office: desks, chairs, monitor stands, storage units

    What doesn’t work well with View in Your Room: products with highly translucent, transparent, or reflective surfaces that are technically difficult to render accurately (glass vases, crystal items, highly polished metals). These can still be approved for View in 3D, but the AR placement accuracy may be lower.

    The Multiple-Item Room Feature

    One of the less-discussed capabilities of View in Your Room is the ability for shoppers to place multiple products simultaneously and build out a virtual room. A shopper can place a sofa, then add a coffee table, then place a lamp on an end table — all in the same AR session. Each product comes from its respective listing and can be added to cart independently.

    This has an interesting implication for brands with complementary product lines. If a shopper is decorating a room virtually with your sofa, they’re more likely to also place your matching coffee table, your lamp, and your rug. Amazon’s recommendation engine actively suggests compatible products within the AR view. For sellers with full room collections, this creates a meaningful cross-sell pathway that doesn’t require any additional ad spend.

    Desktop Saving and Editing

    Virtual room layouts created in the mobile AR view can be saved and accessed across devices. A shopper who builds a room arrangement on their phone can return to it on desktop, edit it, share it, and complete the purchase later. This is relevant to sellers because it extends the engagement window well beyond a single session — your product may sit in a saved virtual room for days before the purchase decision is made. That’s a form of considered-purchase support that doesn’t exist in standard listings.

    Virtual Try-On: Categories, Access, and What Smaller Sellers Should Know

    Close-up of a person holding a smartphone showing a virtual shoe try-on augmented reality feature with the shoe appearing overlaid on their feet in real scale

    Virtual Try-On is the most category-constrained of Amazon’s AR tools, and it’s worth being clear about what’s realistic for different types of sellers in 2026.

    Current Category Coverage

    The three categories with live Virtual Try-On support are footwear, eyewear, and apparel (T-shirts). Footwear is the most mature implementation, with thousands of styles across major brands. The feature uses the phone’s rear camera to overlay shoes on the user’s feet in real time — you physically point the camera at your feet and the shoes appear on them, sized correctly and responsive to your movements.

    For eyewear, the front-facing camera is used to map the user’s face and display how sunglasses or glasses frames will look when worn. This is particularly effective in a category where fit and aesthetic are both highly personal and historically difficult to assess online.

    T-shirts are the most recent addition, though as of 2026 this category is still developing in terms of brand roster and technical accuracy. The rendering of fabric drape and body-specific fit is a harder problem than shoe placement, and it shows in the current iteration.

    Access for Smaller Brands

    This is where sellers need honest expectations. Virtual Try-On for shoes and eyewear appears to operate largely through partnership arrangements between Amazon and established brands rather than a fully open self-serve enrollment. Brands like Puma, Adidas, New Balance, and Birkenstock are participating because they have the production capacity to create high-quality 3D models for their entire footwear lineup and the negotiating leverage to be part of launch partnerships.

    Smaller, independent footwear or eyewear brands should not assume Virtual Try-On is immediately available to them through Seller Central. The path to participation may require working through Amazon Fashion’s brand partnerships team rather than a standard self-serve upload. That said, Amazon has a commercial incentive to expand Virtual Try-On participation, and access for smaller brands is likely to broaden over time.

    The AWS Nova Canvas Alternative

    For sellers who want virtual try-on functionality but can’t access Amazon’s native feature yet, Amazon Web Services offers Nova Canvas — an AI tool that generates try-on visualizations from two uploaded images (a person/space and a product). While this isn’t a live AR experience in the way Virtual Try-On is, it generates realistic static visualizations that can be used in listing images, A+ Content, and social media. For smaller apparel and accessories brands, this is currently the more accessible route to showing products in context on a human body.

    View in 3D: The Accessible AR Entry Point Most Sellers Overlook

    A 3D wireframe model of a kitchen appliance being built digitally on a computer screen with 3D modeling software interface

    If View in Your Room is the headline feature and Virtual Try-On is the partnership feature, View in 3D is the working seller’s AR tool — and it’s underused relative to the value it provides.

    What It Enables

    View in 3D embeds an interactive 3D model directly on the product detail page. Shoppers can rotate the product 360 degrees, zoom in on specific details, and examine it from any angle — all without leaving the listing or activating their camera. On mobile, they can also switch into the AR placement mode, which is the View in Your Room experience.

    This means a single 3D model asset powers multiple experiences: the interactive on-page viewer, the room placement AR feature, and — in some cases — the “View in 3D” banner that appears in search results for eligible listings. That last point is worth noting: 3D-enabled listings can display a visual indicator in search results that distinguishes them from standard listings at the discovery stage, before a shopper even reaches your product page.

    Why It Works Across More Categories

    View in 3D eligibility is broader than View in Your Room because it doesn’t require placement in a physical space — it’s just an interactive model viewer. This means products that wouldn’t logically fit the “put it in your room” use case — a backpack, a kitchen knife set, a skincare device, a power tool — can still benefit from 3D interactivity on their listing page. Shoppers can examine the construction, zoom in on textures, inspect seams, hinges, ports, or handles, and build a much richer mental model of the product than flat photography allows.

    For products where fine details drive purchase decisions — jewellery, hardware, electronics accessories, sporting goods — this capability is particularly relevant.

    How It Appears on the Listing

    When a product has an approved 3D model, it appears in the image carousel on the product detail page alongside standard photos and video. Shoppers see a “View in 3D” option they can tap or click, which launches the interactive viewer in-page. On mobile, the same prompt can offer the option to switch to AR placement if the product category supports it.

    The placement in the image carousel matters because that is prime listing real estate. A 3D model in position two or three of the image stack gets early exposure to shoppers who are actively swiping through product assets — typically the most engaged and highest-converting segment of your traffic.

    The Numbers Behind AR: What the Data Actually Shows

    Performance data for AR in e-commerce comes from multiple sources — Amazon’s own limited public data, third-party platform studies, and brand case studies. It’s worth presenting these with appropriate context rather than treating every number as directly applicable to every seller’s situation.

    Conversion Rate Impact

    The most commonly cited figure is a 94% higher conversion rate for products with 3D/AR content, drawn from Shopify’s analysis of merchants using 3D product models. This is a significant lift, but it reflects a comparison between listings with and without 3D models rather than an isolated test of the 3D feature itself — other listing quality differences may be present between the two groups.

    More conservative estimates from retail AR deployments across major platforms put the conversion lift at 15–30% for shoppers who actively engage with AR features. Amazon-specific data for View in Your Room engagement suggests that users who interact with the AR view convert at approximately double the rate of those who don’t — though this includes selection bias, since shoppers who engage with AR are likely already more purchase-intent than average.

    The practical takeaway: expect meaningful conversion improvement, especially in categories where product fit, size, or appearance in context is a major purchase decision factor. Don’t expect a lift equivalent to a category where the shopper is buying a commodity item with no visual uncertainty.

    Return Rate Reduction

    Return rate data is more consistently supported across sources. Build.com (home improvement) reported a 22% reduction in returns for AR users. Furniture retailers using similar AR placement tools have seen returns drop from the 5–7% industry average to under 2%. The mechanism is straightforward: shoppers who’ve seen exactly how a product fits their space before buying are less likely to be surprised when it arrives.

    For categories with structurally high return rates — furniture (typically 10–15%), apparel (20–30%), footwear (up to 35%) — a 25–40% reduction in returns is a material cost recovery. Return processing costs on Amazon include both direct fees and downstream impacts on inventory health, seller metrics, and IPI scores. Every return prevented is worth more than its face value.

    Revenue Per Visitor

    Studies across apparel virtual try-on deployments report approximately 15% higher revenue per user when shoppers engage with try-on features. This is driven partly by higher conversion rates and partly by higher average order values, as shoppers who engage with AR are more likely to purchase confidently at full price rather than adding to cart at a discount to reduce risk.

    Engagement Duration

    Shoppers who interact with AR features spend meaningfully more time on product pages than those who don’t. While extended time-on-page isn’t a direct purchase signal, it does indicate active evaluation rather than passive browsing — and active evaluation is where purchase decisions happen. Amazon’s algorithm measures engagement signals including session duration and interaction depth, which means AR engagement has at least an indirect relationship with listing performance over time.

    How to Get Eligible: Brand Registry, File Specs, and the Two Upload Paths

    A clean flat-lay photo showing a tablet displaying an Amazon product detail page with a 3D rotate-and-view interface, surrounded by a notebook with strategy notes and a coffee mug

    Access to Amazon’s AR and 3D listing features is gated behind two requirements: Brand Registry enrollment and a qualifying product model. Both are concrete, achievable steps — but sellers should understand exactly what each involves before allocating budget and time.

    Brand Registry: The Non-Negotiable Starting Point

    Amazon Brand Registry is the gateway to all self-serve AR and 3D listing features. Only the registered brand owner can upload 3D models for a product listing. This means if you’re a reseller, a distributor, or a seller who hasn’t completed Brand Registry, you cannot add AR content to your listings — even if you’re the product’s primary seller.

    Brand Registry requires an active, registered trademark (either in the U.S. or in the marketplace where you’re selling). The trademark can be word-based or image-based. Amazon typically processes Brand Registry applications within 2–10 business days once trademark verification is complete. If you haven’t started the trademark process yet, the typical timeline to a granted trademark is 12–18 months in the U.S. — a legitimate long-term investment, not a short-term tactic.

    Once enrolled in Brand Registry, your account gains access to the 3D model upload tools, alongside other benefits like A+ Content, Sponsored Brand ads, the Brand Dashboard, and the Brand Analytics suite.

    Technical Specifications for 3D Models

    Amazon accepts 3D models in GLB (preferred) or GLTF format. Key technical requirements include:

    • Polygon count: Under 1,000,000 triangles (lower is better for load performance; target 100K–300K for most products)
    • File size: Under 1GB, though smaller files produce better in-app performance
    • Texture quality: High-resolution textures that accurately represent material properties — colour, roughness, metallicity, and normal mapping for surface detail
    • Scale accuracy: The model must reflect exact real-world dimensions; inaccurate scale is the most common rejection reason for View in Your Room models
    • No camera or light attributes: External cameras and lighting setups embedded in the model file cause rejection
    • Material accuracy: The model should represent how the product actually looks — colour, finish, and texture must match the physical product

    Upload Path One: The Seller App Scanning Tool

    Amazon offers a built-in 3D model creation tool in the iOS Seller app (available to brand-registered sellers in the U.S.). The tool guides you through scanning your physical product with your iPhone camera, creating a basic 3D model automatically. The process takes 5–10 minutes and requires holding the phone at multiple angles around the product to capture all surfaces.

    The resulting model goes through Amazon’s automated review process (typically 24–72 hours). The tool works best for products with non-reflective surfaces, clear defined edges, and consistent textures. It struggles with glass, highly reflective metals, very small products (under 10cm), and items with very fine surface details that a phone camera can’t capture adequately.

    For sellers with a qualifying product who want to test AR integration before investing in professional 3D creation, the scanning tool is a legitimate free starting point. Don’t expect photorealistic results — expect a serviceable model that gives shoppers a basic spatial understanding of the product.

    Upload Path Two: Seller Central Image Manager

    Professional 3D models created externally (by you or a third-party provider) can be uploaded via Seller Central through the Image Manager. The path is: Catalog → Upload Images → Manage Images → 3D Models tab. You’ll enter the product’s exact dimensions and upload the GLB file. Amazon’s review team then assesses the model against quality and accuracy standards, with a typical review window of one to two weeks.

    Models uploaded via this path tend to be higher quality than app scans because they’re built by professional 3D artists with dedicated tools, but they cost more upfront. The two-week review window means you should plan your launch timeline accordingly — don’t finalize a listing around an AR feature that’s still in review.

    Creating Your 3D Model: DIY Scanning Versus Third-Party Providers

    A person using a smartphone to scan a small tabletop product for 3D model creation, the phone screen shows a scanning progress overlay with a glowing green mesh

    The model creation decision is where many sellers stall — not because the options are complicated, but because the costs and quality trade-offs aren’t clearly laid out. Here’s what the realistic landscape looks like.

    Option 1: Amazon’s Built-In Mobile Scanning

    Cost: Free.
    Time: 5–10 minutes per product (plus 24–72 hours review).
    Quality: Basic to moderate — adequate for View in 3D, variable results for View in Your Room.

    Best for: Sellers who want to test AR integration with minimal investment, products with straightforward geometry (boxes, cylinders, flat panels), and initial market testing before committing to professional model creation.

    Limitations: iOS only, US-only (currently), quality ceiling that may not represent the product accurately enough for high-stakes categories, and limited control over texture and finish rendering.

    Option 2: Freelance 3D Artists

    Cost: $50–$350 per model for simple products; $350–$1,000+ for complex products.
    Time: 2–7 business days depending on complexity and revision rounds.
    Quality: Variable — highly dependent on the individual artist’s experience with Amazon-spec models.

    Freelance platforms host 3D artists with Amazon-specific experience who understand the GLB format requirements, the triangle count limits, and the texture specifications. The most important criterion when hiring a freelance 3D artist for Amazon is whether they’ve had models approved before — ask for specific examples of live Amazon listings they’ve created models for.

    Provide the artist with: exact product dimensions, high-resolution product photography from all angles, material specifications (colour codes, finish type, texture samples), and any technical data sheets. The more information you provide, the higher the accuracy of the first draft and the fewer revision rounds you’ll need.

    Option 3: Specialist Amazon 3D Agencies

    Cost: $300–$2,000 per model (often packaged with renders and lifestyle images).
    Time: 3–14 business days depending on agency and product complexity.
    Quality: High — these agencies specialize in Amazon-compliant 3D models and often offer revision guarantees and resubmission support if Amazon rejects the initial upload.

    Agencies like Advertflair, Data4Amazon, and vetted AWS partners (Hexa3D, Threedium) operate in this space. The higher cost often includes a suite of deliverables beyond just the 3D model: CGI product renders, lifestyle scene renders, 360-degree spin animations, and the GLB file — assets that can be used across your listing images, A+ Content, and off-Amazon marketing materials.

    For sellers with a strong-performing product where incremental conversion improvement translates to meaningful revenue, the $500–$2,000 investment in a professional model is easy to justify. For a product generating $30,000/month, a 15% improvement in conversion rate on a subset of traffic is a significant number.

    Option 4: In-House 3D Modeling Software

    If you or someone on your team has 3D modeling experience, tools like Blender (free), Cinema 4D, or Autodesk Maya can be used to create GLB-compatible models from product CAD files or scratch. This is the most cost-effective long-term solution for sellers with large product catalogs, but it requires a meaningful skill investment or a dedicated in-house resource.

    For brands with existing CAD files from product manufacturing, converting those files to consumer-grade 3D models for Amazon is often faster and cheaper than starting from scratch — the geometry exists, it just needs texturing, material mapping, and format conversion to GLB.

    AR Features and Amazon’s Algorithm: What It Affects (and What It Doesn’t)

    The relationship between AR features and Amazon’s A10 ranking algorithm is real but indirect — and it’s important to understand the distinction between direct ranking signals and downstream performance signals.

    What AR Does Not Do Directly

    Amazon has not publicly documented AR or 3D model presence as a direct ranking factor in the way that review count, keyword relevance, or sales velocity are. If your product has a 3D model and an identical competitor listing does not, you should not expect to automatically outrank that competitor based on the 3D model alone.

    Sellers who pitch AR primarily as an “algorithm hack” are overstating the relationship. That framing sets up disappointment and misallocates the genuine value of the feature.

    What AR Does Affect (Indirectly)

    Where AR creates algorithmic benefit is through its impact on the performance signals that Amazon’s A10 algorithm does weight heavily:

    • Click-through rate (CTR): Listings with the “View in 3D” or AR badge visible in search results may generate higher CTR than equivalent listings without it, as the visual differentiator attracts attention in crowded search pages.
    • Conversion rate (CVR): Amazon heavily weights CVR in its ranking model. If AR engagement increases your conversion rate — and the data suggests it consistently does for engaged shoppers — that improvement feeds directly into your ranking signals over time.
    • Return rate: Amazon monitors return rates by seller and by product. Elevated return rates can trigger listing suppression, restricted categories, or additional fees. A genuine reduction in returns from AR engagement improves your standing on this metric.
    • Session duration and engagement depth: Amazon’s algorithm processes engagement signals beyond just purchase events. Shoppers who spend more time on your listing, interact with more content types, and engage with the AR viewer are contributing behavioural signals that indicate a high-quality listing.

    The Listing Quality Score Connection

    Amazon uses an internal Listing Quality Score (LQS) that influences how confidently the algorithm recommends your product across different placements. While the exact composition of LQS isn’t public, it is understood to incorporate listing completeness signals — images, video, A+ Content, accurate attributes. A 3D model in the image stack contributes to listing completeness and likely to the LQS, which has downstream effects on placement in recommendation surfaces, deal eligibility, and algorithm confidence in the listing.

    Category-by-Category Opportunity Map: Where AR Adoption Is Still Low

    One of the genuinely underappreciated aspects of Amazon’s AR feature suite is how unevenly adoption is distributed across categories. In furniture and high-end footwear, AR-enabled listings are becoming common. In other eligible categories, the majority of brand-registered sellers haven’t added 3D content at all.

    Less than 1% of Amazon’s brand-registered sellers are estimated to have 3D models on their listings as of 2026. That creates significant differentiation opportunity in categories where the feature is both eligible and underused.

    High Opportunity, Low Current Adoption

    Kitchen and tabletop appliances: With the recent expansion of View in Your Room to tabletop items, coffee makers, air fryers, blenders, and similar products are now eligible for room placement AR. Very few sellers in this category have moved on this. A 3D-enabled listing for a coffee maker that lets shoppers see exactly how it looks on their kitchen counter — in their actual kitchen — is a meaningful differentiator in a crowded category.

    Sporting goods and fitness equipment: Dumbbells, kettlebells, yoga equipment, benches, and compact gym gear are eligible for View in 3D and in some cases View in Your Room. Shoppers trying to gauge whether a piece of equipment will fit their home gym or apartment space have a genuine use case for AR visualization. Adoption in this category remains low.

    Consumer electronics accessories: Headphones, speakers, keyboards, mice, and desk accessories benefit from 3D viewing for detail inspection. A shopper trying to decide between two similarly priced wireless headphones has a much richer experience rotating a 3D model and examining the ear cushions, hinge mechanisms, and build quality than viewing three standard photos.

    Home office: Desks, chairs, monitor stands, and storage units are in the sweet spot of View in Your Room eligibility with relatively low adoption among smaller brands in the space.

    Baby and nursery: Cribs, changing tables, high chairs, and strollers are categories where parents are making high-consideration purchases and want to see products in their specific nursery space. AR fit checks are highly relevant here, and adoption is minimal outside of major brands.

    Categories with Growing Competition

    Furniture (large items), premium footwear, and premium eyewear are the categories where AR adoption is highest and where the differentiation value of having 3D content is eroding as more brands adopt it. In these categories, not having AR is increasingly the risk — while having it is becoming table stakes. If you’re in furniture or shoes and you haven’t added 3D models yet, you’re already behind the curve in terms of shopper expectation management.

    Common Mistakes Sellers Make With AR Listings

    Based on how Amazon’s 3D model requirements and review processes work, there are several consistent failure patterns worth avoiding before you invest time and money in model creation.

    Submitting Models with Scale Errors

    The most common reason for View in Your Room rejection is inaccurate product scale. If your 3D model’s dimensions don’t precisely match the actual product’s real-world measurements, Amazon will reject it for the room placement feature — because a sofa that appears three feet shorter than it actually is creates exactly the kind of post-purchase surprise that AR is supposed to prevent.

    Always provide exact manufacturer dimensions when briefing a 3D artist or when setting up your model. Double-check the model in a preview before submission. Scale errors are entirely avoidable with proper briefing.

    Ignoring Material and Texture Accuracy

    A 3D model that looks significantly different from the physical product — wrong colour rendering, flat textures on a product that has visible grain or weave, generic materials applied to a product with specific finishes — may pass Amazon’s review but will disappoint shoppers who interact with it. The whole point of AR is to reduce the imagination gap; a model that’s inaccurate in material or colour can create a new type of expectation mismatch.

    Invest in accurate texture mapping. For products where colour accuracy is critical (upholstered furniture, apparel, rugs, painted wood), provide your 3D artist with colour-accurate reference photography taken in daylight or with proper colour calibration. The Pantone or RAL colour codes for your product finishes are extremely useful.

    Using the App Scan for Complex Products

    The mobile scanning tool is genuinely useful for the right products, but sellers sometimes try to use it for products where it structurally can’t produce adequate results: glass items, chrome-finished products, products smaller than a fist, products with complex internal structures visible through the casing. The result is a low-quality model that may create a negative first impression rather than a positive one.

    Match the creation method to the product. If your product has challenging material properties, invest in professional modeling rather than relying on mobile scanning.

    Not Updating Models After Product Changes

    If you update your product — new colour option, revised packaging, changed dimensions, updated branding — your 3D model needs to be updated too. An outdated 3D model showing a discontinued colour option or old design creates confusion. Build model maintenance into your product update workflow, not as an afterthought.

    Treating the Model as a Set-and-Forget Asset

    A 3D model is a living listing asset that benefits from monitoring. Track whether your View in 3D engagement rate changes after model upload. Watch your return rate in the weeks following AR activation. Compare conversion rates between traffic segments that engaged with the AR feature and those that didn’t. Amazon’s Brand Analytics includes some of this data; supplement it with your own tracking where possible. If a model isn’t driving the expected engagement, it’s worth investigating whether it’s appearing correctly on all devices and in all marketplaces you’re selling in.

    Building AR Into Your Listing Strategy for the Long Term

    AR features on Amazon aren’t a campaign — they’re listing infrastructure. Like A+ Content, video, and review management, they’re assets that compound over time rather than delivering a one-time lift. That framing changes how you should prioritize and sequence the investment.

    Sequence: Start with Your Highest-Return Products

    If you have a catalog of 50+ SKUs and can’t afford to create 3D models for everything immediately, prioritize based on return rate and return-driven costs. Your highest-return products are the ones where the AR investment has the clearest ROI case: every percentage point reduction in returns on a $200 furniture item is worth more in absolute terms than the same reduction on a $20 item.

    Second priority: your highest-traffic, highest-conversion products. These are the listings where the incremental improvement in conversion rate delivers the most revenue. The model investment on a listing that drives $80,000/year is justified at a much higher threshold than one driving $8,000/year.

    Align Model Creation with New Product Launches

    For new product launches, building the 3D model into the pre-launch production workflow is far more efficient than retrofitting it after launch. When you’re already briefing photographers and creating packaging, the 3D model brief can be developed in parallel. CAD files from your manufacturer can seed the model creation, reducing the 3D artist’s work significantly.

    Launching with a 3D model in place means your listing is fully equipped from day one of indexed traffic — including the AR badge in search results and the interactive viewer on the detail page. For products entering competitive categories, this is a meaningful early differentiation.

    Plan for Multi-Marketplace Deployment

    Amazon’s 3D model feature is available across multiple marketplaces, not just Amazon.com. If you sell on Amazon UK, Germany, Canada, Australia, or Japan, the same 3D model file can typically be used across marketplaces. The review process applies separately in each marketplace, but the asset creation is a one-time cost with multi-market deployment potential.

    This is particularly relevant for international expansion plans. A brand entering Amazon Europe with AR-enabled listings from launch day is positioned ahead of most competitors who haven’t yet implemented 3D models in those markets.

    Leverage 3D Assets Beyond Amazon

    The GLB file and the photorealistic renders your 3D artist produces are reusable assets. The same model can power AR previews on your Shopify or WooCommerce store, 3D spin animations for your product emails, CGI lifestyle imagery for your social media, and interactive embeds on your brand website. Many sellers limit their thinking to the Amazon use case and leave the broader asset value on the table.

    When briefing a 3D agency, ask explicitly for high-resolution renders, 360-degree turntable animations, and any scene variants you’ll need for your other channels. Getting all of this from a single model creation project significantly improves the cost-per-use of the asset.

    What to Expect: A Realistic Timeline and Outcome Framework

    For sellers considering AR features for the first time, here’s an honest outline of what the process and outcomes typically look like.

    Months 1–2: Foundation

    • Confirm Brand Registry status (apply if not already enrolled)
    • Audit your catalog for AR-eligible products and prioritize candidates
    • Brief a 3D artist or agency — or use the mobile scan tool for initial testing
    • Submit models for Amazon review via Seller Central Image Manager
    • Allow 1–2 weeks for Amazon’s review and approval

    Months 2–4: Live and Measuring

    • Monitor View in 3D engagement via Brand Analytics and listing traffic data
    • Compare return rates before and after AR activation
    • Track conversion rate changes for AR-activated listings vs. baseline period
    • Note any search ranking changes — though attribute these cautiously given multiple variables

    Months 4–12: Scaling the Investment

    • Expand 3D models to additional products based on performance data from initial rollout
    • Incorporate model creation into new product launch workflow
    • Deploy existing 3D assets to other Amazon marketplaces
    • Leverage 3D renders in A+ Content, video, and off-Amazon channels

    Realistic Outcome Expectations

    For sellers in furniture, home décor, lighting, and similar high-imagination-gap categories: expect the clearest and fastest impact. Return rate improvements in the 15–30% range for AR-engaged shoppers, and conversion rate lifts in the 10–25% range, are supported by data from comparable deployments.

    For sellers in electronics accessories, sporting goods, and kitchen appliances: expect moderate but measurable improvement in engagement and conversion, with a slower timeline to see statistically clear return rate effects (lower baseline return rates mean smaller absolute changes).

    For sellers in low-consideration categories (commodity goods, consumables, replenishment items): the AR investment may not be justified. If your customers aren’t making a spatially or aesthetically complex purchase decision, AR doesn’t address the friction in their buying journey.

    Conclusion: AR Is Infrastructure, Not a Trend

    The conversation around augmented reality in e-commerce has been dominated for years by hype cycles and ambitious projections that haven’t always landed on schedule. That history has made some sellers appropriately sceptical. But Amazon’s AR suite — View in Your Room, Virtual Try-On, and View in 3D — is not speculative technology. It’s live, it’s self-serve for brand-registered sellers, it costs nothing in Amazon fees to upload, and the performance data from deployments across e-commerce consistently supports meaningful improvements in both conversion rates and return rates.

    The sellers who are hesitating aren’t being cautious — they’re waiting for a queue of missed opportunities to get longer. Less than 1% of brand-registered Amazon sellers have 3D models on their listings. In a marketplace where differentiation is increasingly expensive to achieve through advertising and increasingly difficult to achieve through listing optimisation alone, that gap is a genuine opening.

    Key Takeaways for Amazon Sellers

    • AR on Amazon is three separate tools: View in Your Room (space placement), Virtual Try-On (wearable visualization), and View in 3D (interactive on-page model). Each has different category eligibility and access paths.
    • Brand Registry is the prerequisite for self-serve AR and 3D model uploads. If you haven’t enrolled, that’s the first step — everything else follows from it.
    • GLB/GLTF format, accurate scale, and material fidelity are the three pillars of a model that gets approved and performs well in AR.
    • Two upload paths exist: the free iOS Seller app scan (quick, basic quality) and the Seller Central Image Manager upload (professional quality, 1–2 week review).
    • Professional model creation costs $50–$2,000 depending on product complexity and whether you need additional renders. Amazon charges no fee for the upload or AR integration itself.
    • The greatest opportunity sits in kitchen appliances, sporting goods, home office, electronics accessories, and baby/nursery — categories with AR eligibility and very low current adoption.
    • AR’s impact on rankings is indirect — it works through improved conversion rates, lower return rates, and stronger engagement signals, not through a direct algorithmic ranking boost.
    • 3D model assets are reusable across marketplaces, channels, and marketing materials. Plan the full scope of use when commissioning model creation.

    The window for early differentiation through AR on Amazon remains open — but it won’t stay open indefinitely. Sellers who move now get the full compounding benefit of better conversion metrics, lower return rates, and early-mover positioning before AR becomes as standard as A+ Content. Sellers who wait will still be able to add it eventually, but they’ll be doing so in a landscape where it no longer stands out.

  • What is amazon brand registry? A Clear Guide to Brand Protection

    What is amazon brand registry? A Clear Guide to Brand Protection

    So, what exactly is Amazon Brand Registry? At its core, it’s a free program designed to give legitimate brand owners the keys to their kingdom on Amazon. It transforms you from just another seller into a protected, recognized brand with exclusive control over your product listings and access to a powerful suite of tools.

    Think of it this way: without Brand Registry, you're basically operating on borrowed land. With it, you own the deed.

    A person is typing on a laptop with 'BRAND PROTECTION' displayed on the screen, indicating digital security.

    Why Brand Registry Is No Longer Optional

    For any serious private-label seller, enrolling in Brand Registry has shifted from a "nice-to-have" to a foundational necessity. Trying to build a sustainable business on Amazon without it is a constant uphill battle. You're left vulnerable to hijackers changing your listing details, counterfeiters selling knock-offs under your name, and a general lack of control.

    Brand Registry is your digital fortress. It gives you the authority to lock down your brand's image, protect your intellectual property, and unlock marketing tools that your non-registered competitors can only dream of. It’s the critical difference between being a passive seller and an active, protected brand owner who is truly in the driver's seat.

    The Three Pillars of Brand Registry

    The entire program is built on three main pillars that work together to secure your business and fuel its growth. To help you see how it all fits together, here's a quick breakdown of what the program offers.

    To get a clearer picture, let's look at how these three pillars function.

    Amazon Brand Registry at a Glance

    Core Pillar Primary Function Key Seller Benefits
    Accurate Brand Representation Gives you ultimate control over your product detail pages. Lock your titles, descriptions, and images to prevent unauthorized changes and ensure a consistent brand message.
    Powerful Brand Protection Provides proactive and reactive tools to guard your intellectual property (IP). Automated systems find and remove infringements, plus you get powerful reporting tools to stop bad actors fast.
    Exclusive Growth Tools Unlocks premium content, advertising, and analytics features. Create A+ Content, run Sponsored Brands ads, and access analytics to better understand your customers and make data-driven decisions.

    These pillars are what separate thriving brands from those that are constantly putting out fires.

    The numbers don't lie. Over 700,000 brands have already enrolled, and for good reason. A staggering 63% of them report monthly sales exceeding $100k. In a marketplace that's expected to capture 60% of all US online sales by 2026, not being in Brand Registry is like leaving the front door of your business wide open. You can dig deeper into why top sellers prioritize Brand Registry with this analysis from Marknology.

    Bottom line? For serious Amazon FBA sellers, this means getting real results. Amazon’s dedicated team removes 99% of reported IP infringements within 48 hours, freeing you up to focus on what actually matters: growing your business.

    Your Ticket to Entry: Understanding the Trademark Requirement

    Let's get straight to the point: to get into Amazon Brand Registry, you need a registered trademark. Think of it as the non-negotiable price of admission. It's the official badge that proves to Amazon you're the real owner of your brand, not just some random seller.

    Without that trademark, the doors to Brand Registry's most powerful tools—the ones that protect you from hijackers and let you build beautiful listings—stay locked. This isn't just Amazon creating red tape. Your trademark is the legal bedrock that gives Amazon the authority to act on your behalf when someone tries to rip off your products or mess with your listings.

    Word Marks vs. Design Marks

    When you go to file that trademark, you’ll face a choice between two main types. Getting this right from the start can save you a lot of headaches down the road.

    • Word Mark (Text-Based): This protects the name of your brand itself—just the words. If you get a word mark for "Brandly," it's protected whether you write it in a simple font or a fancy custom script. For almost every new seller, this is the way to go. It gives you the broadest protection for your name.
    • Design Mark (Image-Based): This protects a specific logo, including any text or design elements inside it. This is a decent option if your logo is truly unique and the visual is more important than the name. The catch? It only protects that exact visual. Change your logo, even slightly, and you might lose your protection.

    My advice? Start with a word mark. It secures your brand name while giving you the freedom to update your logo and branding as your business grows, all without needing to file a new trademark. You can review our disclaimer for more information on legal and business decisions at https://www.algofuse.ai/disclaimer.

    Speed Up the Process with IP Accelerator

    Waiting for a government trademark office to give you the green light can take months, sometimes even a year. That’s a long time to leave your brand unprotected on a marketplace as competitive as Amazon. This is where the Amazon IP Accelerator program becomes your best friend.

    Amazon created this program to connect sellers with a hand-picked network of trusted IP law firms. Here’s the magic: once one of these firms files your trademark application, Amazon gives you early access to Brand Registry. You don't have to wait for the final government approval.

    Key Takeaway: The IP Accelerator is a total game-changer. It lets you start using A+ Content and powerful brand protection tools in a matter of weeks, not months, while your official trademark is still being processed.

    Yes, you'll have to pay the law firm's professional fees, but many sellers find it’s a small price to pay for speed and peace of mind. Trying to do it yourself can be risky; unverified or improperly filed trademarks can delay 20-30% of standard applications. Once you're in, sellers often report that they can resolve IP complaints two to three times faster than before. You can read more about why this efficiency is a game-changer for new sellers on myamazonguy.com.

    The Step-by-Step Enrollment Process Made Simple

    Alright, let's walk through the Amazon Brand Registry application. It can look intimidating from the outside, but it’s really just a series of logical steps. Once you see the path, you can get through it without the usual headaches and delays.

    Think of it like getting your paperwork in order before a big meeting. If you show up with everything you need, it’s a quick, productive session. If you’re scrambling for documents, you’ll just have to come back and do it all over again.

    Stage 1: Get Your Ducks in a Row Before You Start

    First things first: before you even open the Brand Registry website, you need to gather your essential information. Taking a few minutes to do this now will save you hours of frustration later. This is the single biggest thing you can do to make the process go smoothly.

    Here’s what you absolutely must have ready:

    • Your Brand Name: This has to match your trademark filing exactly. I can't stress this enough. If your trademark is for "SunBeam" but you enter "Sun Beam," the system will likely reject your application automatically. Pay attention to every space, hyphen, and capital letter.
    • Trademark Registration Number: This is the official number issued by the government IP office that granted your trademark. If you’re using the IP Accelerator program, you'll have a pending trademark application number, which works too.
    • Product & Packaging Photos: You need real-world photos of your product or its packaging that clearly show your branding. The critical rule here is that your brand name must be permanently affixed. That means it's printed, engraved, molded, or sewn on—not just a sticker you slapped on.

    Having these three items on hand is non-negotiable. They are the proof Amazon needs to connect your legal trademark to your physical products.

    This diagram clearly shows how the trademark process flows into Brand Registry, highlighting how the IP Accelerator program can get you there faster.

    Diagram showing the Brand Registry Trademark Process, including Trademark Application, IP Accelerator, and Access.

    The key takeaway here is simple: while waiting for a standard trademark can take months, the IP Accelerator is Amazon's official shortcut to getting Brand Registry benefits much, much sooner.

    Stage 2: Navigating the Enrollment Portal

    With your documents ready, it's time to head over to the Brand Registry portal and create an account.

    This is a crucial step: you must sign up using the same email and password associated with your Seller Central or Vendor Central account. This is what links everything together and ensures the new brand tools appear right inside your existing seller dashboard. Using a different email will create a disconnected account, which can be a massive pain to fix down the road.

    Pro Tip: You can actually create a Brand Registry account even if you don't actively sell on Amazon. This gives you access to the "Report a Violation" tool to police your trademark, though you won't get seller-specific perks like A+ Content or Brand Stores.

    Stage 3: Submitting Your Application

    Once you’re logged in to the Brand Registry portal, you’ll see an option to "Enroll a new brand." This is where you'll enter the information you just gathered. The form will ask for your brand name, your trademark number, and a logo file if you have a design mark.

    Next, you'll be prompted to upload those product and packaging photos. Remember, these need to be authentic pictures showing the permanent branding. Don't try to use mockups or digitally edited images—Amazon's verification system is pretty good at spotting them, and it will trigger an immediate rejection.

    Stage 4: The Final Verification Code

    You’re almost there! After you submit your application, Amazon's team begins the verification. They will reach out directly to the person listed as the official contact on your trademark filing—usually your attorney—and send them a unique verification code.

    Your job is to get that code from your contact and enter it back into your Brand Registry case log. This is the final handshake that proves you are the legitimate rights owner. Once that code is accepted, your enrollment is complete. You’ll unlock the full suite of Brand Registry tools and can finally start protecting your brand and building out your listings. This is also the perfect time to explore tools that can help create those new assets, like the AI-powered image generation on our signup page.

    Unlocking Your Brand's Superpowers

    A tablet displays 'Unlock Superpowers' text and icons on a wooden desk with a pen and notebook.

    Getting into Brand Registry is a game-changer. It’s like Amazon hands you the keys to a whole new set of tools—ones that most sellers don't even know exist. These aren't just small perks; they’re powerful features that shift you from being a seller at the mercy of the marketplace to a brand owner in full control.

    Think of it as getting a bundle of 'superpowers.' Each one gives you a distinct advantage, whether it's putting a digital fortress around your listings or creating a shopping experience so compelling that unregistered sellers simply can't compete. Let's dig into what these tools are and how they directly impact your business.

    Your Brand's Digital Bodyguard

    The first thing you’ll notice is the massive leap in brand protection. Before Brand Registry, you’re pretty much a sitting duck for hijackers and counterfeiters. After you enroll, you get a powerful arsenal to fight back.

    These tools are your frontline defense, working around the clock to protect your intellectual property and give you some much-needed peace of mind.

    • Proactive Protections: Amazon starts using your brand information to automatically spot and remove content that’s likely infringing or just plain wrong. It’s like having a 24/7 security detail that neutralizes threats before they can tarnish your brand’s reputation.
    • Report a Violation Tool: This is your red phone directly to Amazon’s internal team. It offers a clear, guided process for reporting everything from counterfeit products to trademark abuse. Because it's a streamlined system, takedowns happen much faster and more effectively.
    • Listing Control: Brand Registry gives you the final say over your product detail pages. This is huge. It prevents other sellers from messing with your titles, bullet points, and images, ensuring your brand's voice stays consistent and your information stays accurate.

    These protections aren't just about playing defense. They build a solid, secure foundation so you can focus on growth instead of constantly looking over your shoulder.

    Crafting a Premium Shopping Experience

    Beyond just protection, Brand Registry unlocks a whole suite of marketing tools that let you build a real brand on Amazon, not just sell products. This is your chance to tell your story, connect with customers, and stand out from the sea of generic listings.

    The most valuable of these is undoubtedly A+ Content. This feature lets you ditch the boring, plain-text product description and replace it with a visually stunning, magazine-style layout. You can add rich images, comparison charts, and detailed graphics to truly show off what makes your product great.

    A+ Content is far more than just eye candy—it’s a conversion-boosting powerhouse. Over 700,000 brands use features like this, with studies showing it can lift session conversion by 5-10%. The benefits are even greater when you combine it with AI-generated lifestyle scenes and feature callouts from platforms like AlgoFuse.ai. In fact, in 2026, Amazon Seller Central forums are buzzing with resolutions like deeper analytics dives and quarterly Brand Registry chats, signaling ongoing support. Discover more insights about the growth of Amazon Brand Registry at MaverickX.io.

    Another key feature is your own Amazon Store. Think of this as your personal, multi-page website hosted right on Amazon, free of any competitors. It’s a space where you can curate your entire product catalog, share your brand’s origin story, and create a dedicated destination for traffic from your Sponsored Brands ads.

    Gaining an Unfair Advantage with Data

    Finally, Brand Registry opens the door to a goldmine of data that regular sellers can only dream of. The Brand Analytics dashboard serves up insights pulled directly from Amazon’s vast pool of customer data, giving you a serious competitive edge.

    This dashboard helps you answer the questions that actually matter:

    1. Search Term Reports: You can see the exact keywords customers are typing to find your products—and your competitors' products. This is pure gold for optimizing your listings and fine-tuning your PPC ad campaigns.
    2. Market Basket Analysis: Ever wonder what else your customers buy? This report shows you which products are frequently purchased together with yours, uncovering priceless opportunities for bundling, cross-promotions, and new product development.
    3. Customer Demographics: Get a clear picture of who your buyers are with aggregated data on their age, income, and gender. This lets you sharpen your customer avatar and make your marketing dollars work that much harder.

    When you put all these tools together, you're no longer just selling stuff. You're building a protected, data-driven, and memorable brand. For any seller serious about scaling on Amazon, mastering these features is non-negotiable, and high-quality visuals are a huge piece of the puzzle. You can learn more about how AI can help create those stunning listing images to get the most out of your A+ Content and Brand Store.

    Alright, once you've got the essentials of Amazon Brand Registry down, it's time to dig into the really powerful stuff. The basic features are great for playing defense, but the advanced tools are what separate the top-tier sellers from everyone else. This is how you go on the offensive to actively grow your brand.

    Think of it this way: the basics are like knowing the rules of the game. These advanced tools are your championship playbook. When you learn how to use them strategically, you start finding incredible customer insights and building marketing campaigns that truly move the needle.

    Uncovering Hidden Keywords with Brand Analytics

    Brand Analytics is your direct pipeline into Amazon's massive database of customer search data. While there are a few different reports in there, the real magic happens in the Search Terms report. This thing shows you the exact search queries shoppers are typing in, ranked by search frequency.

    This isn't just about double-checking the keywords you think are important. It's about finding the ones you've completely missed. You can spot long-tail keywords your competitors aren't bidding on, see what's trending in different regions, and even identify which terms are sending the most clicks and sales to the top three products in your niche.

    Key Insight: This data is far more than just a list of words to sprinkle into your listing. Smart sellers use it to guide new product development. If you see a rising search term with no great product to match, that's your cue. It can also highlight gaps in your A+ Content or give you hyper-specific keywords for PPC campaigns that bring in high-intent shoppers for less money.

    Revealing Cross-Selling Goldmines with Market Basket Analysis

    Another gem inside Brand Analytics is the Market Basket Analysis report. This tool answers a simple but incredibly valuable question: "What else are my customers buying when they buy my product?" The report shows you the top three items most frequently purchased right alongside yours.

    This information is a goldmine for growth. Let's say you sell a premium yoga mat. If the report shows that customers are constantly buying a specific brand of yoga blocks with it, you've just identified a perfect product line extension.

    You can immediately put this data to work:

    • Create product bundles to capture a larger share of the customer's cart and boost your average order value.
    • Target Sponsored Display ads directly onto those complementary product detail pages.
    • Update your A+ Content to show your product being used with items you already know your customers are buying.

    Securing Early Reviews with Amazon Vine

    We all know that social proof is king on Amazon. Those first few reviews on a new product can make or break its launch. Brand Registry gives you access to Amazon Vine, a program designed to solve this exact problem.

    It lets you enroll up to 30 units of a new product and offer them for free to a group of Amazon's most trusted reviewers, called "Vine Voices." In exchange, they agree to leave an honest, unbiased review. There's no guarantee of a 5-star rating, but Vine reviews are often detailed and carry a lot of weight with shoppers. Getting even a handful of these early on can be the push your conversion rate needs to take off.

    With Brand Registry, you also unlock some seriously powerful advertising formats that other sellers simply can't access. The difference is pretty stark.

    Sponsored Ad Types Unlocked by Brand Registry

    Feature Available to All Sellers Exclusive to Brand Registry
    Sponsored Products ✔️ ✔️
    Sponsored Brands (Header Ads) ❌ ✔️
    Sponsored Brands Video ❌ ✔️
    Sponsored Display (Audiences) ❌ ✔️

    These exclusive ad types are a huge advantage, allowing you to build brand awareness and target customers in ways that go far beyond basic keyword ads.

    Dominating with Sponsored Brands Video

    If there's one advertising tool that truly changes the game for brand-registered sellers, it's Sponsored Brands Video. These are the short, auto-playing video ads that show up right in the middle of search results, and they are fantastic at grabbing a shopper's attention.

    A static image just sits there, but a video can show your product in action, highlight its best features, and tell a quick story—all in a few seconds. Sellers who use these videos well can completely dominate a crowded search page, often seeing much higher click-through and conversion rates than with standard ads. It’s your best chance to make a real impression before a customer even clicks on your product.

    Navigating Common Problems and Pitfalls

    So, you've enrolled in Amazon Brand Registry. That's a huge win, but let's be real—it's not a silver bullet. Even with Brand Registry's powerful arsenal, you're going to run into some head-scratching, frustrating problems. Knowing what to expect and how to handle these issues is what really makes the program work for you.

    The first hurdle often comes right at the start: the application. One of the most common and infuriating issues is getting a rejected application. Nine times out of ten, it’s because of a tiny mismatch between the information you submitted and what’s on your official trademark record. A single extra space, a slightly different spelling—that's all it takes for the system to kick it back.

    What to Do When Your Application Is Rejected

    If your enrollment gets denied, take a breath. Don't just re-apply blindly. The trick is to be meticulous and treat it like an appeal. You'll need to re-open your case with Brand Registry support and calmly, clearly lay out your argument.

    • Audit Your Information: Pull up your trademark certificate. Scrutinize every detail—your brand name, trademark number, and the mark type (is it a word mark or a design mark?). Compare it character-for-character with what you put in the application. If Amazon made the error, take screenshots of both to prove it.
    • Provide Clear Photographic Evidence: Your photos need to show the brand name permanently affixed to the product or its packaging. This is non-negotiable. A sticker just slapped on won't pass muster; it needs to be printed, engraved, or molded on.
    • Communicate Precisely: When you write to support, get straight to the point. For example: "My application was rejected for a brand name mismatch. As you can see in the attached trademark certificate, my registered brand 'Brandly' is an exact match to my application."

    Handling Stubborn Hijackers and Incorrect Listing Claims

    Even with Brand Registry fully active, you might log in one day to find another seller has somehow claimed your listing, or a hijacker you reported keeps popping back up. This usually happens because of old, conflicting data buried deep within the Amazon catalog. Your job is to prove to Amazon that you are the sole source of truth for that ASIN.

    To tackle this, you'll open a case with Seller Support (it's important to start here, not with Brand Registry support) to correct the "brand contribution" for the ASIN.

    Pro Tip: The fastest way to get this sorted is to provide what I call a "proof bundle." This package should have everything an agent needs to make a quick decision: your trademark certificate, real-world photos of your product showing both the UPC and your branding, and a link to your brand’s official website where the product is clearly for sale. This makes it dead simple for them to verify your ownership and fix the data.

    Understanding what is Amazon Brand Registry also means knowing how to work the support system. For sellers operating in multiple countries, these headaches can multiply. It takes patience and a mountain of evidence, but your persistence will pay off. You'll eventually reclaim full control and keep your brand protected across the globe.

    Still Have Questions About Brand Registry?

    Even after covering all the details, you probably still have a few questions rattling around. It's a big topic with a lot of moving parts. Let's tackle some of the most common ones we hear from sellers every day.

    How Much Does Amazon Brand Registry Cost?

    Here’s the good news: enrolling in Amazon Brand Registry is completely free. Amazon doesn't charge a dime to join the program or to use its fantastic brand-building tools. That's a common myth, so let's clear it up right now.

    The real cost comes from the prerequisite: getting a registered trademark. That legal process is what you pay for, and the fees can run anywhere from a few hundred to a few thousand dollars. It all depends on the country you're filing in and whether you bring in a lawyer to help. So, to be clear: Amazon's program is free, but the trademark that gets you in the door isn't.

    Can I Enroll With a Pending Trademark?

    Usually, the answer is no. Amazon wants to see a fully registered, active trademark with an official registration number before they let you in.

    However, there's a huge exception that every new brand should know about.

    Amazon has a program called the IP Accelerator, which connects you with a network of trusted law firms. If you use one of these firms to file your trademark, Amazon will grant you access to Brand Registry while your application is still pending.

    This is an absolute game-changer. It means you can start using A+ Content and crucial protection tools right away, effectively skipping the typical 6-12 month wait for your trademark to be approved. It’s Amazon's way of giving legitimate new brands a fighting chance from day one.

    What Happens if Someone Else Already Registered My Brand?

    It’s a gut-wrenching moment: you go to enroll your brand, only to find someone else has already claimed it. Whether it was done by mistake or with malicious intent, the situation is fixable, but you'll have to prove you're the rightful owner.

    You'll need to open a detailed case with Brand Registry support and come prepared with solid evidence. Don't hold back; you want to make your case undeniable. Gather everything you can, including:

    • Your official trademark registration certificate.
    • Links to your brand's official website and active social media profiles.
    • Invoices, purchase orders, or manufacturing agreements that clearly show you are the brand owner.

    This process can test your patience, but by providing clear and comprehensive proof, you can successfully reclaim control of your brand on the platform.


    Ready to elevate your listings with stunning, data-driven visuals that convert? AlgoFuse.ai generates complete, agency-quality image sets for your Amazon products in minutes. Skip the freelancers and complex software—get your first listing's images for free and see the difference AI can make. Start creating with AlgoFuse.ai today.