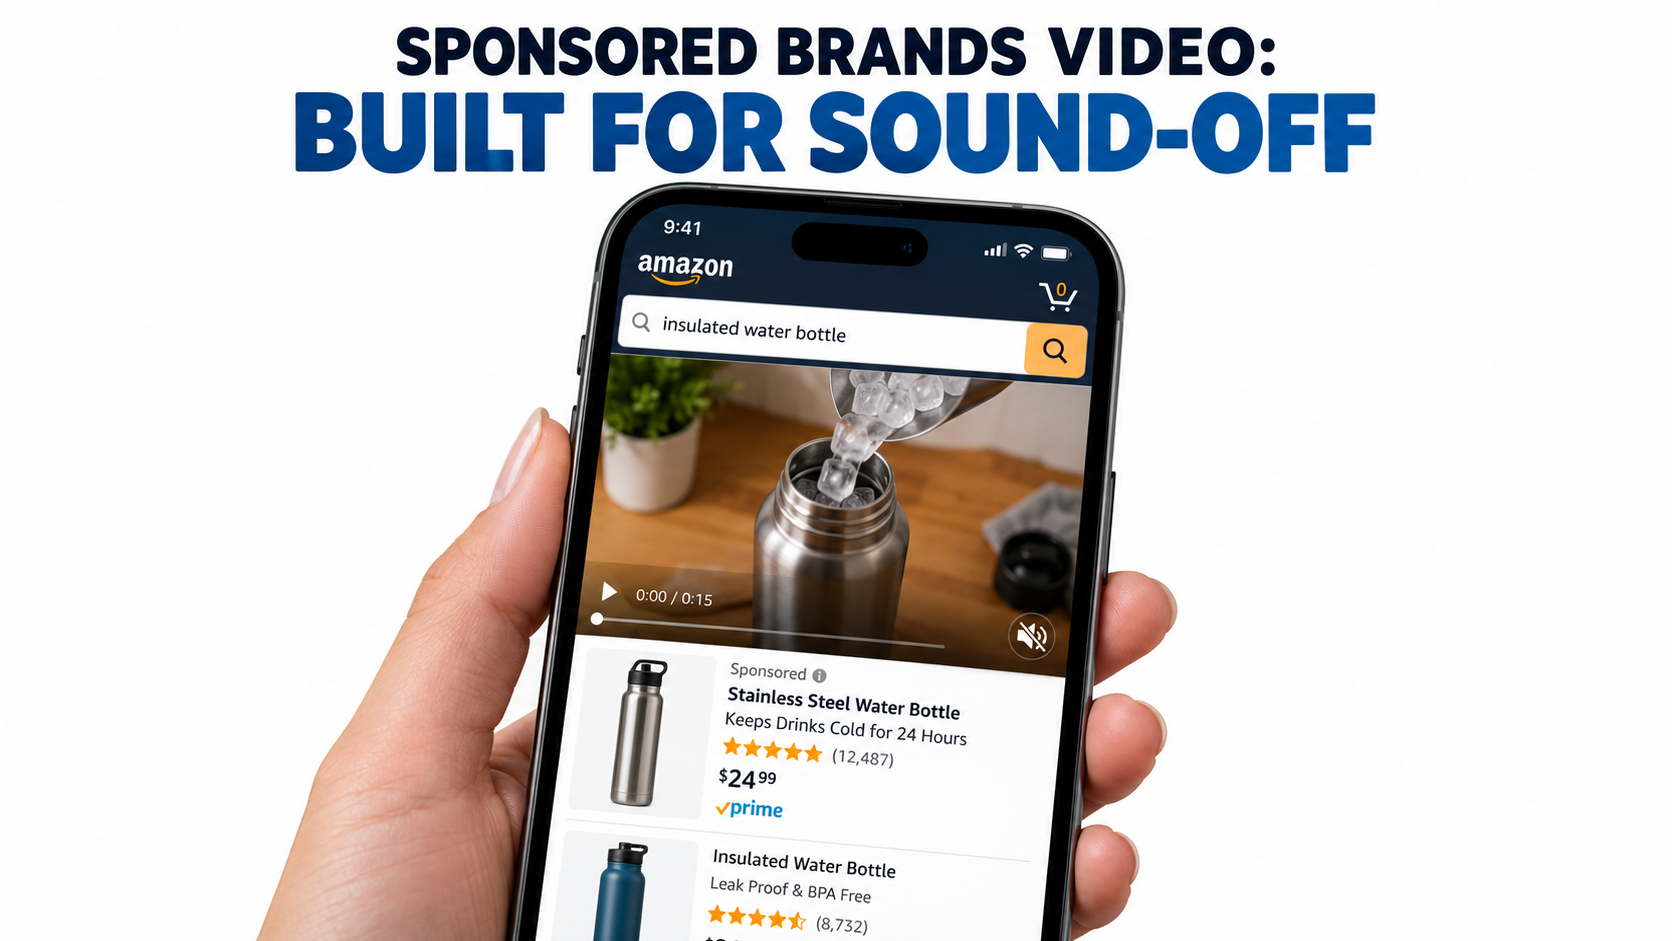
Most Amazon sellers who struggle with Sponsored Brands video don’t have a bidding problem or a targeting problem. They have a mismatch problem. They make a video the way they’d make a commercial, with a voiceover carrying the story, a slow brand intro, and a logo in the first frame. Then they run it inside an ad unit that works almost nothing like a commercial.
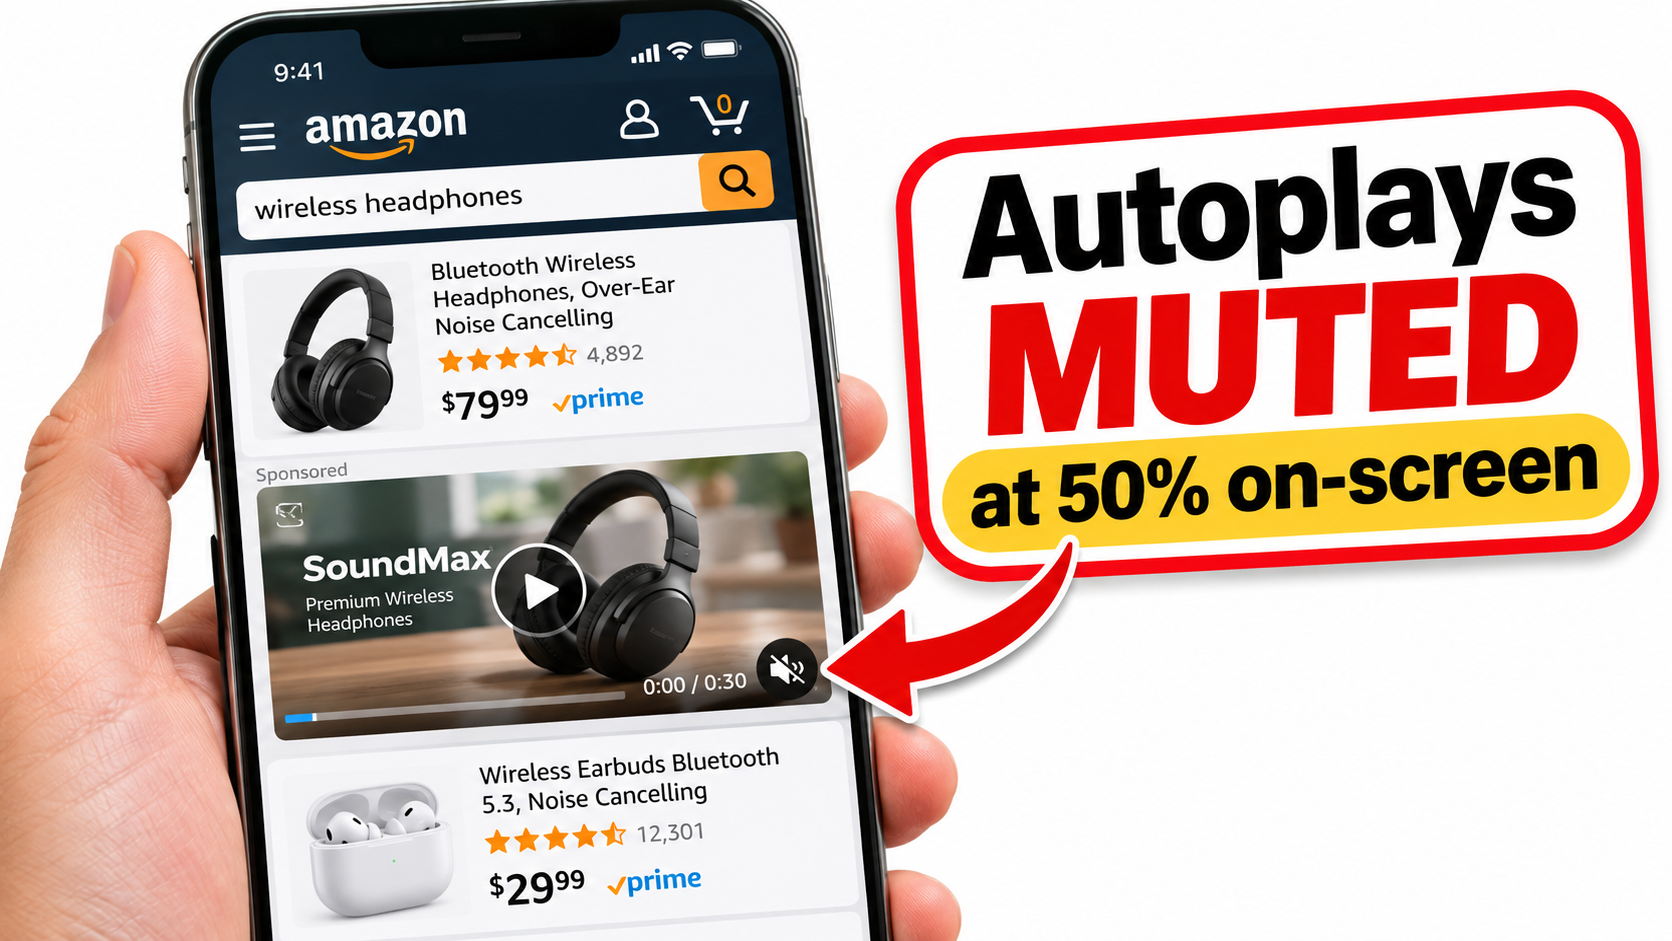
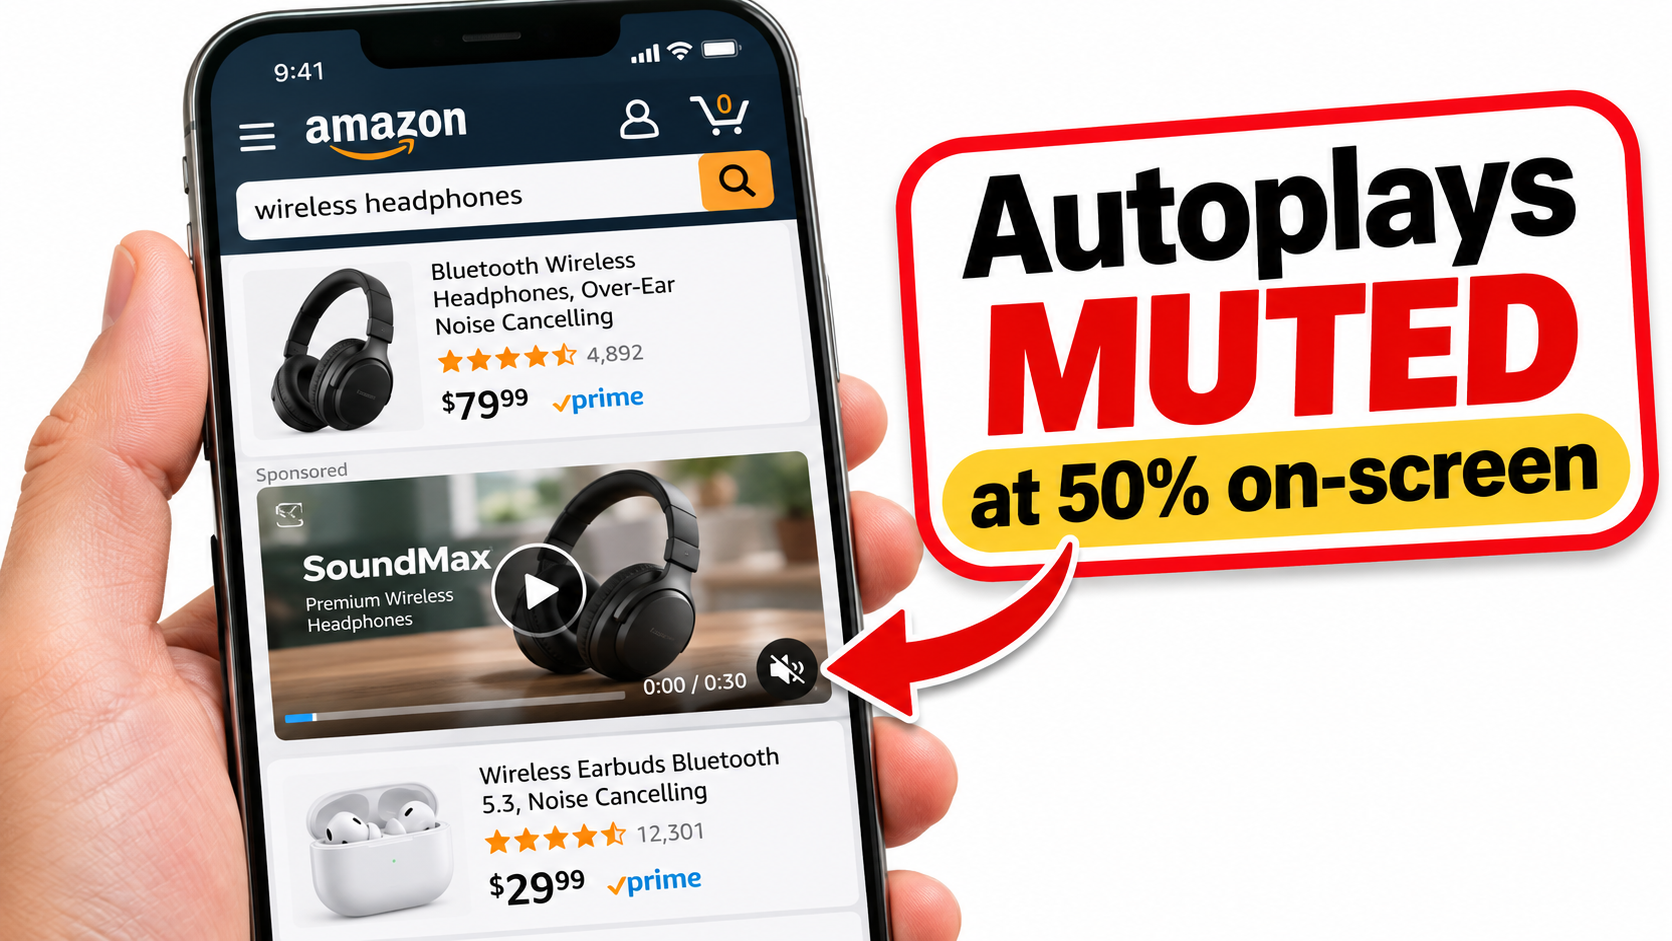
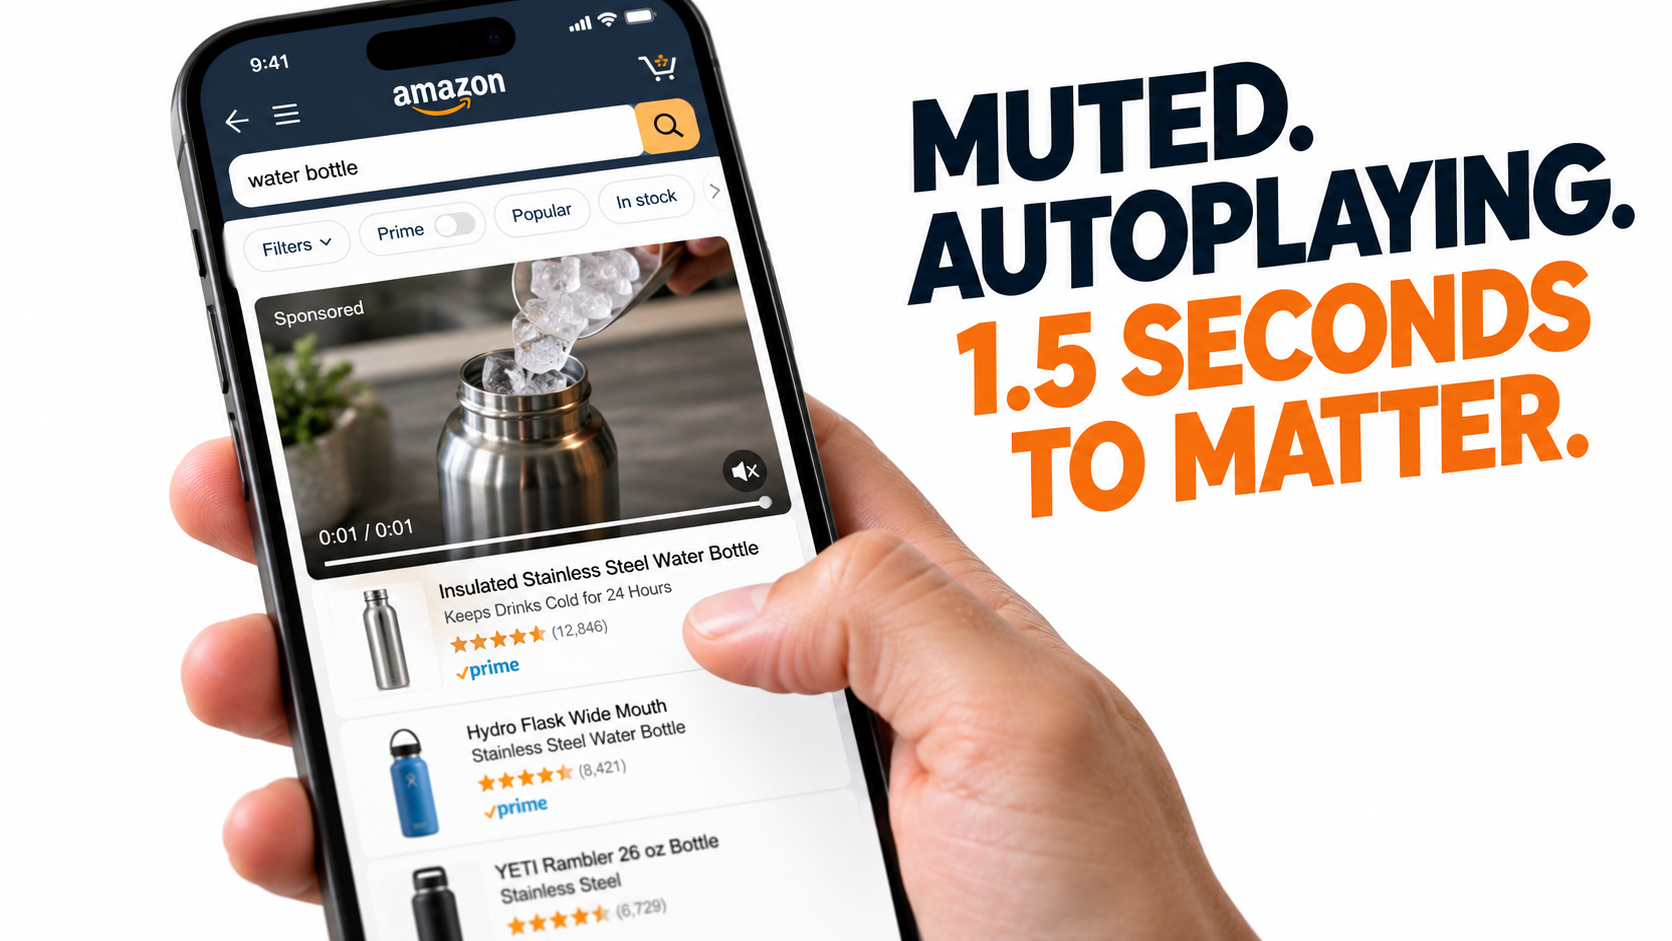
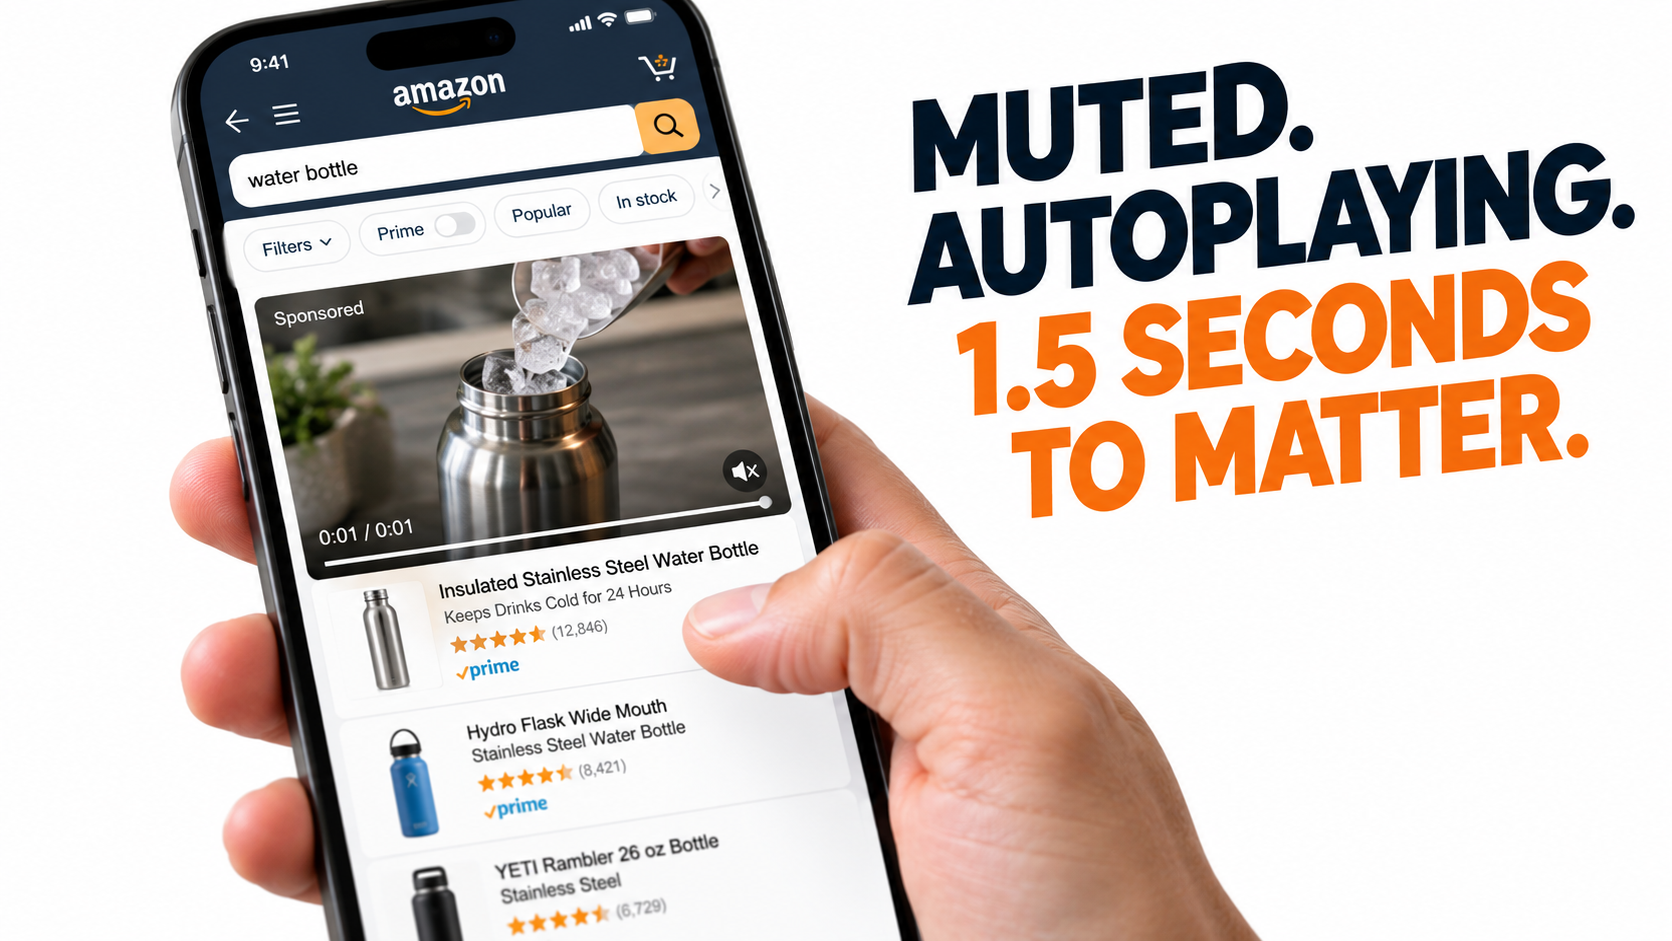
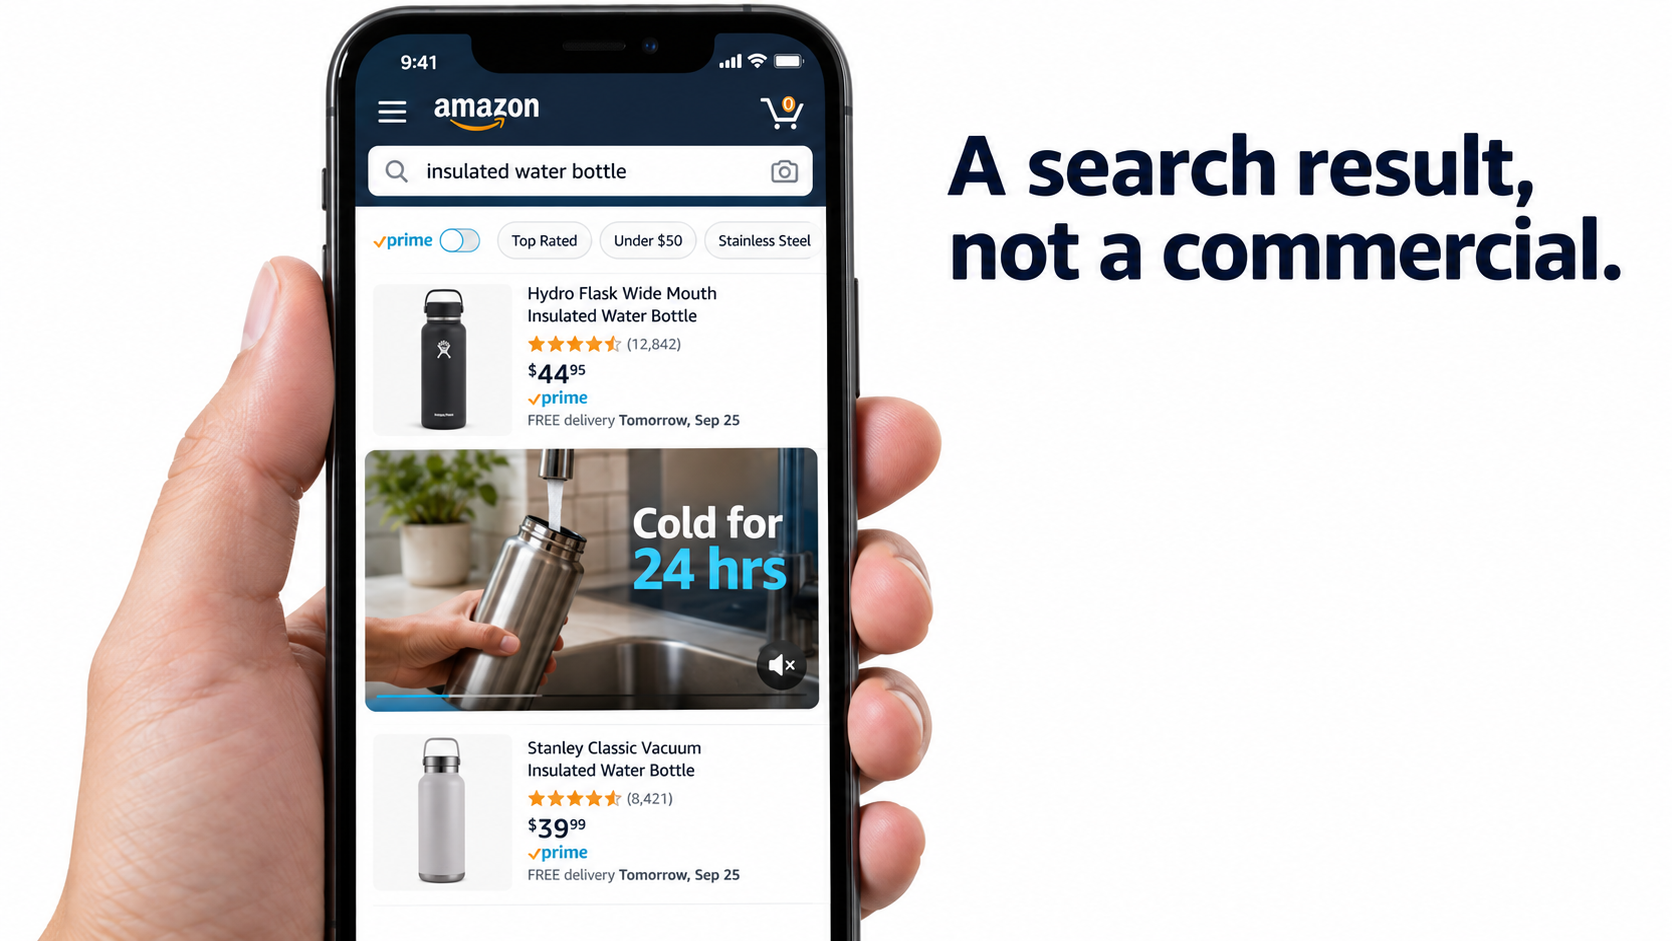
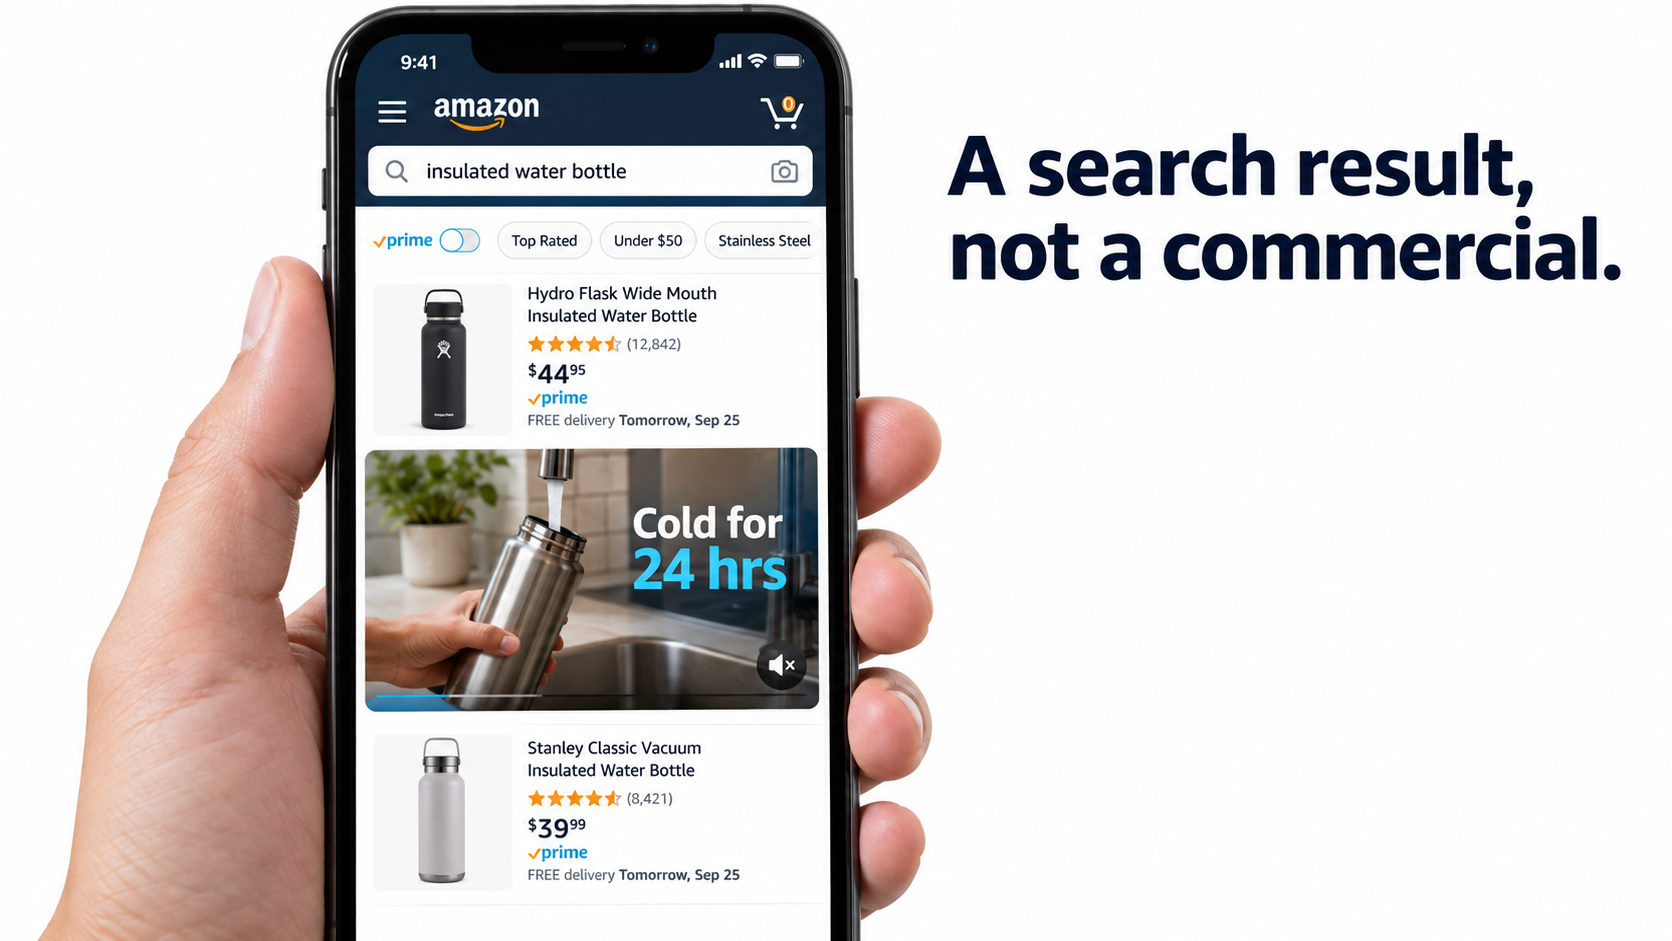
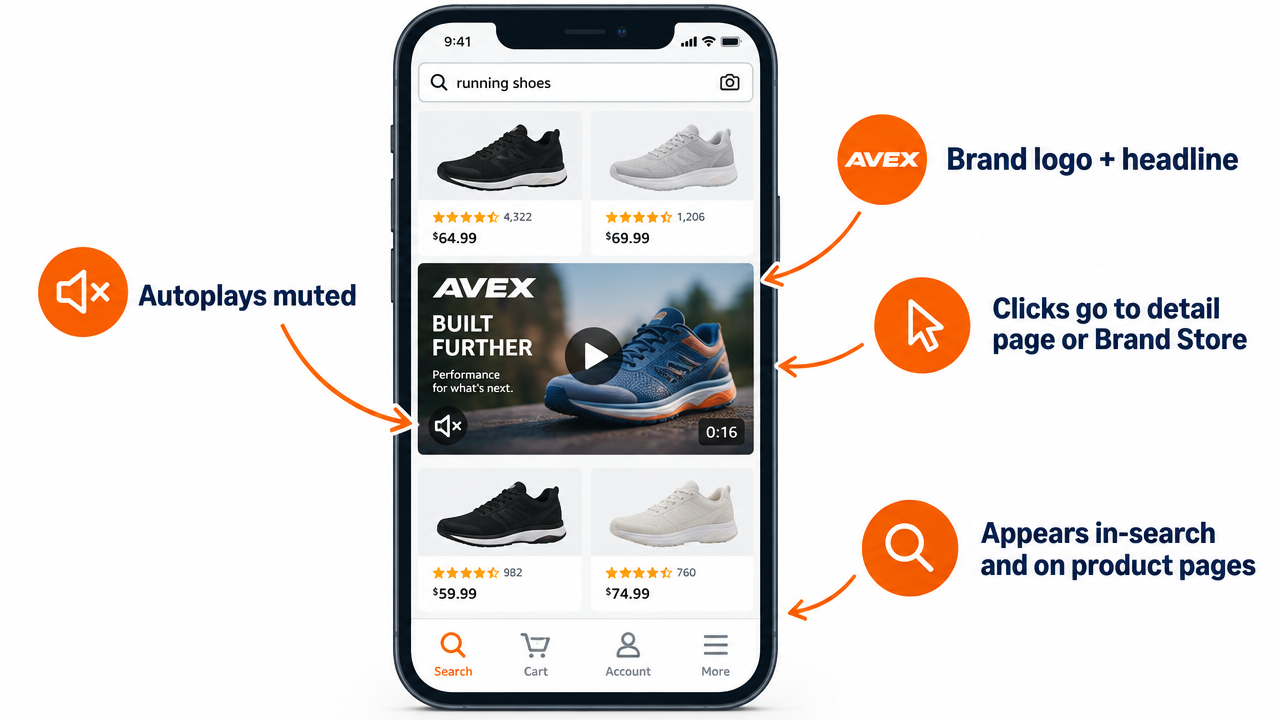
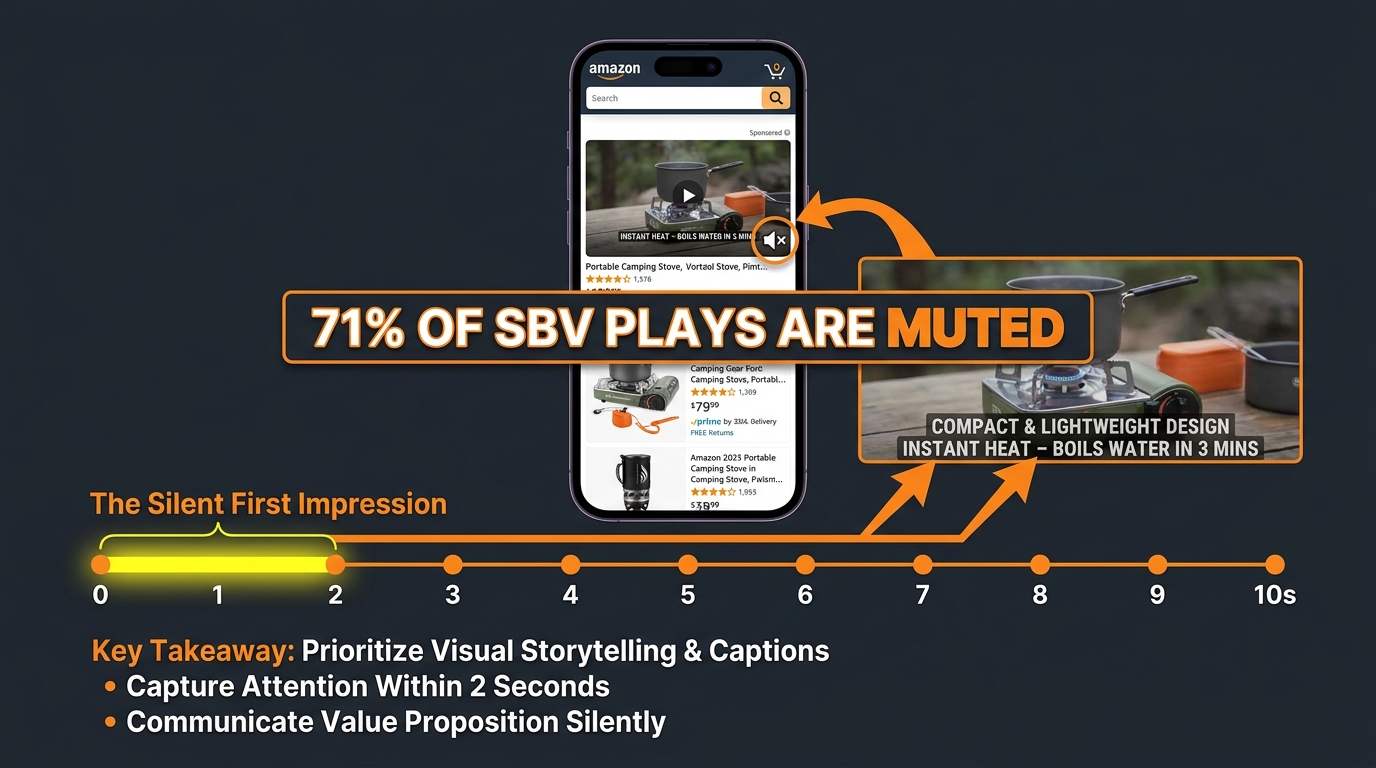
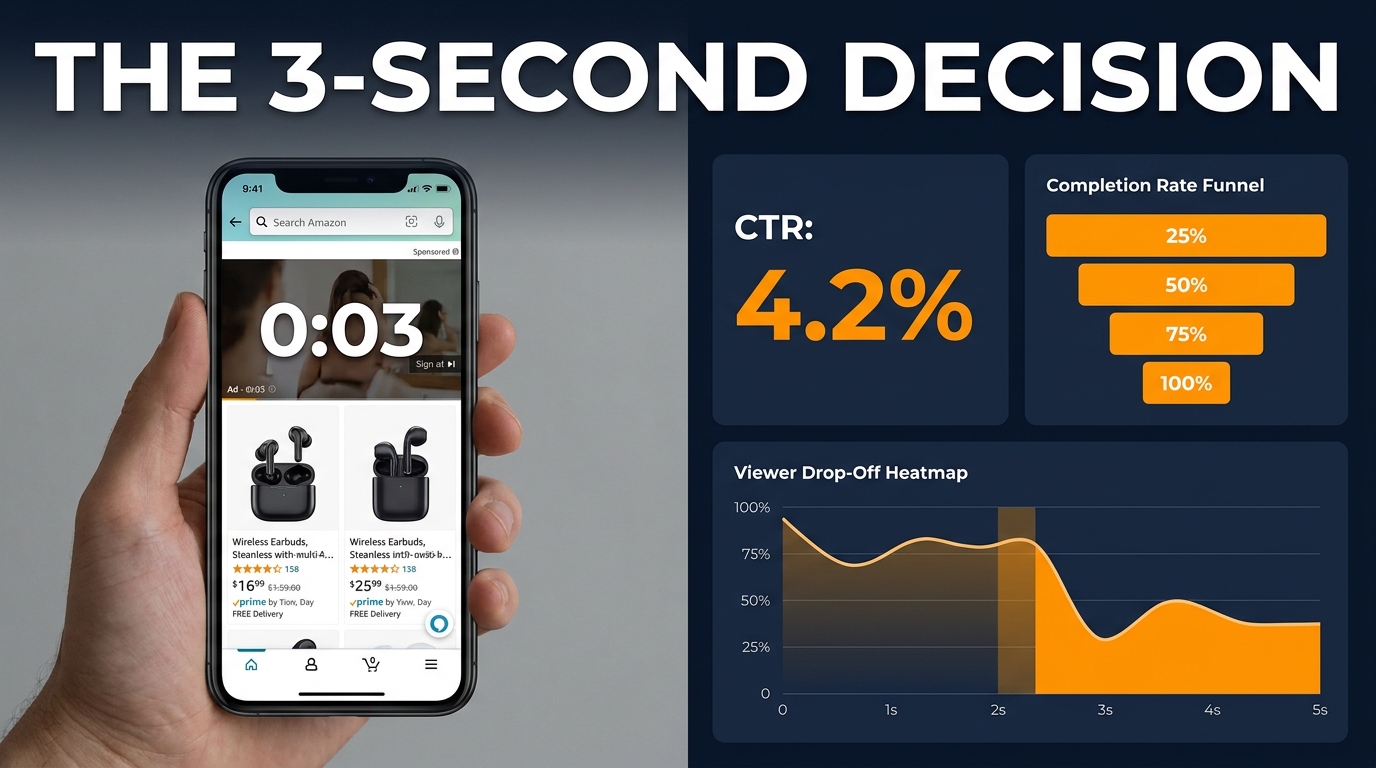
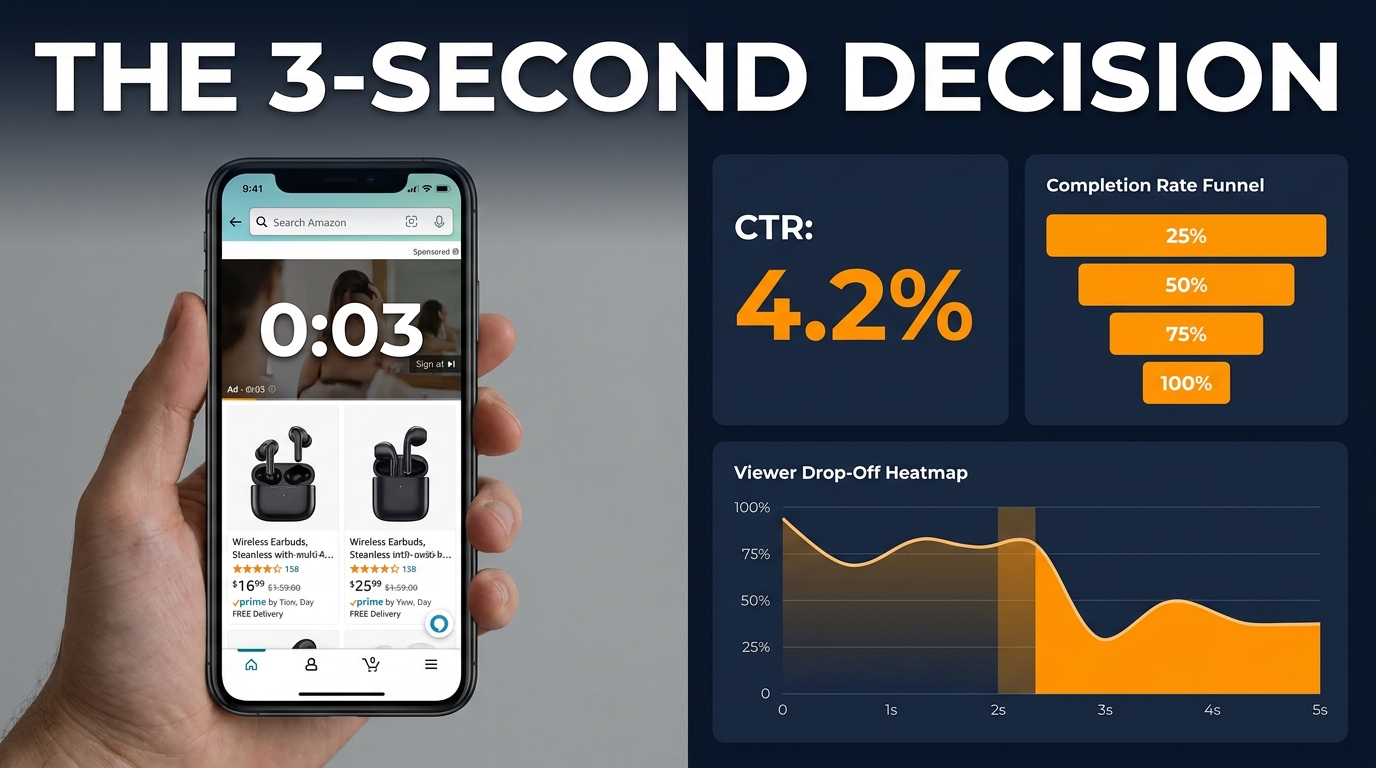
Amazon’s own ad specifications spell out how the unit behaves. The video plays automatically once 50% of its pixels are on-screen. It always starts without audio, and a shopper has to tap a mute toggle in the lower-right corner to hear anything. It sits inside a search results page or a product detail page, surrounded by competing listings, prices, star ratings, and Prime badges. The shopper isn’t sitting back to watch. They’re scrolling to buy.
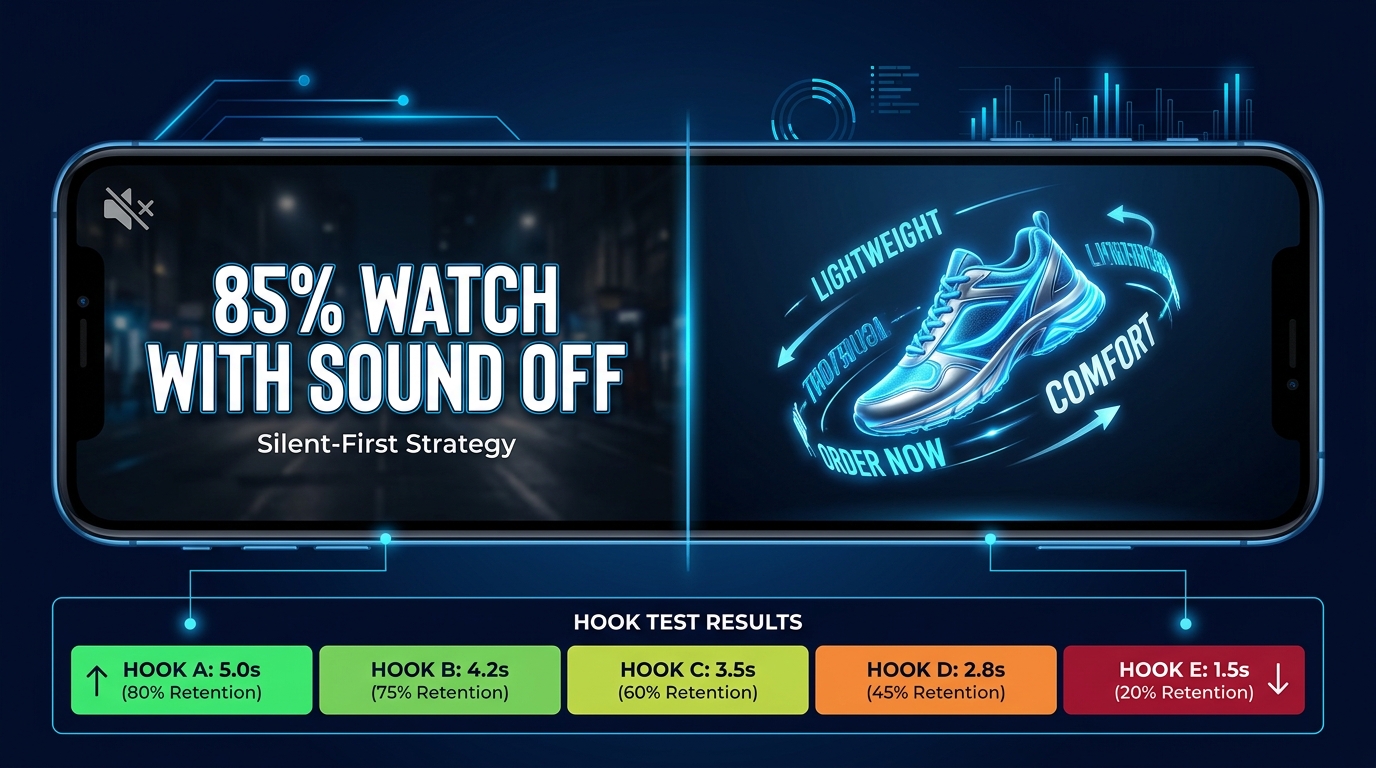
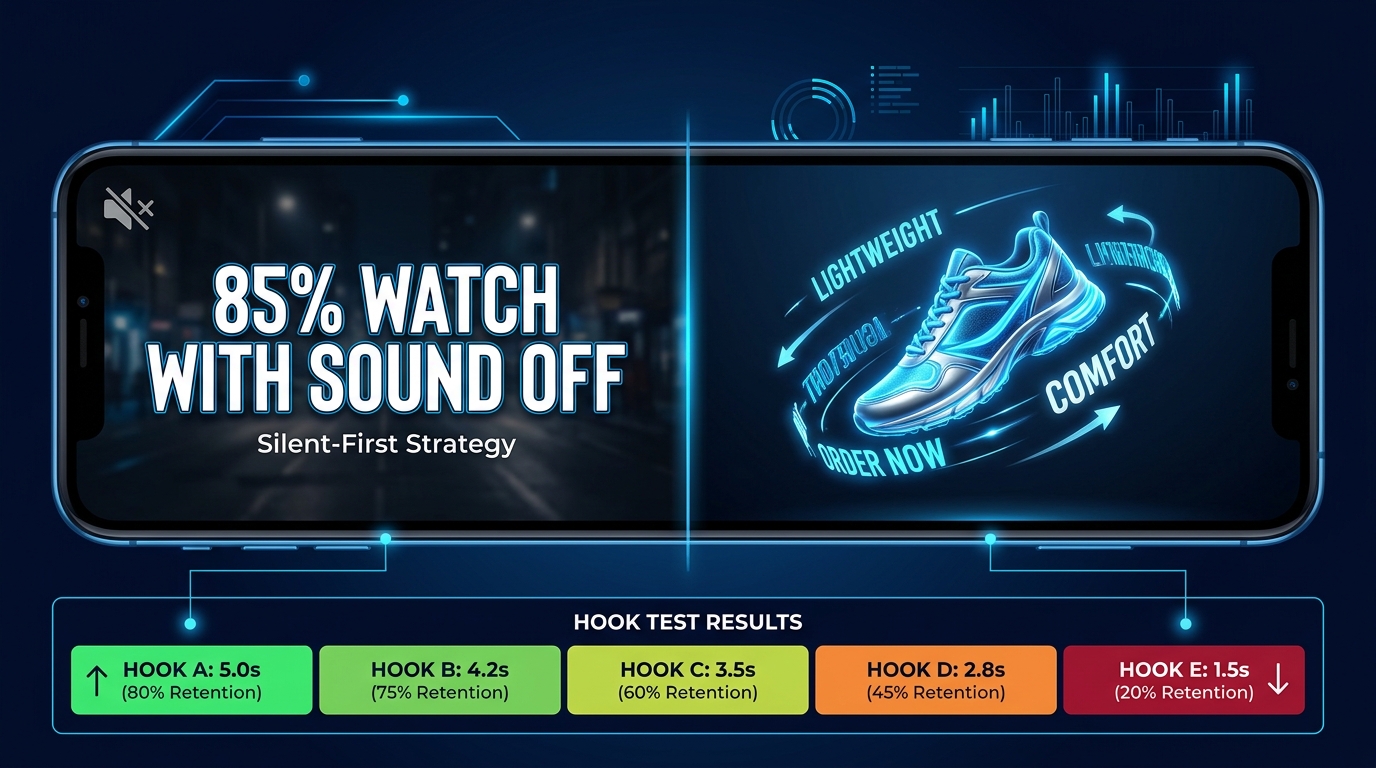
That one detail, muted by default, should shape almost every creative decision you make. Yet it’s the detail most brands skip when they brief an editor or repurpose a social clip.
This article doesn’t give you another list of generic “Amazon ad tips.” It works from the mechanics of the ad unit outward. We’ll look at what Amazon’s specs actually require, why they push you toward silent storytelling, how to edit to the recommended 20 seconds or less, how to choose between a Product Detail Page and a Brand Store destination, which metrics show whether your video is earning attention, and how to run tests that tell you something useful.
The goal is simple: build Sponsored Brands videos for the way shoppers actually see them, not the way you’d like them to.
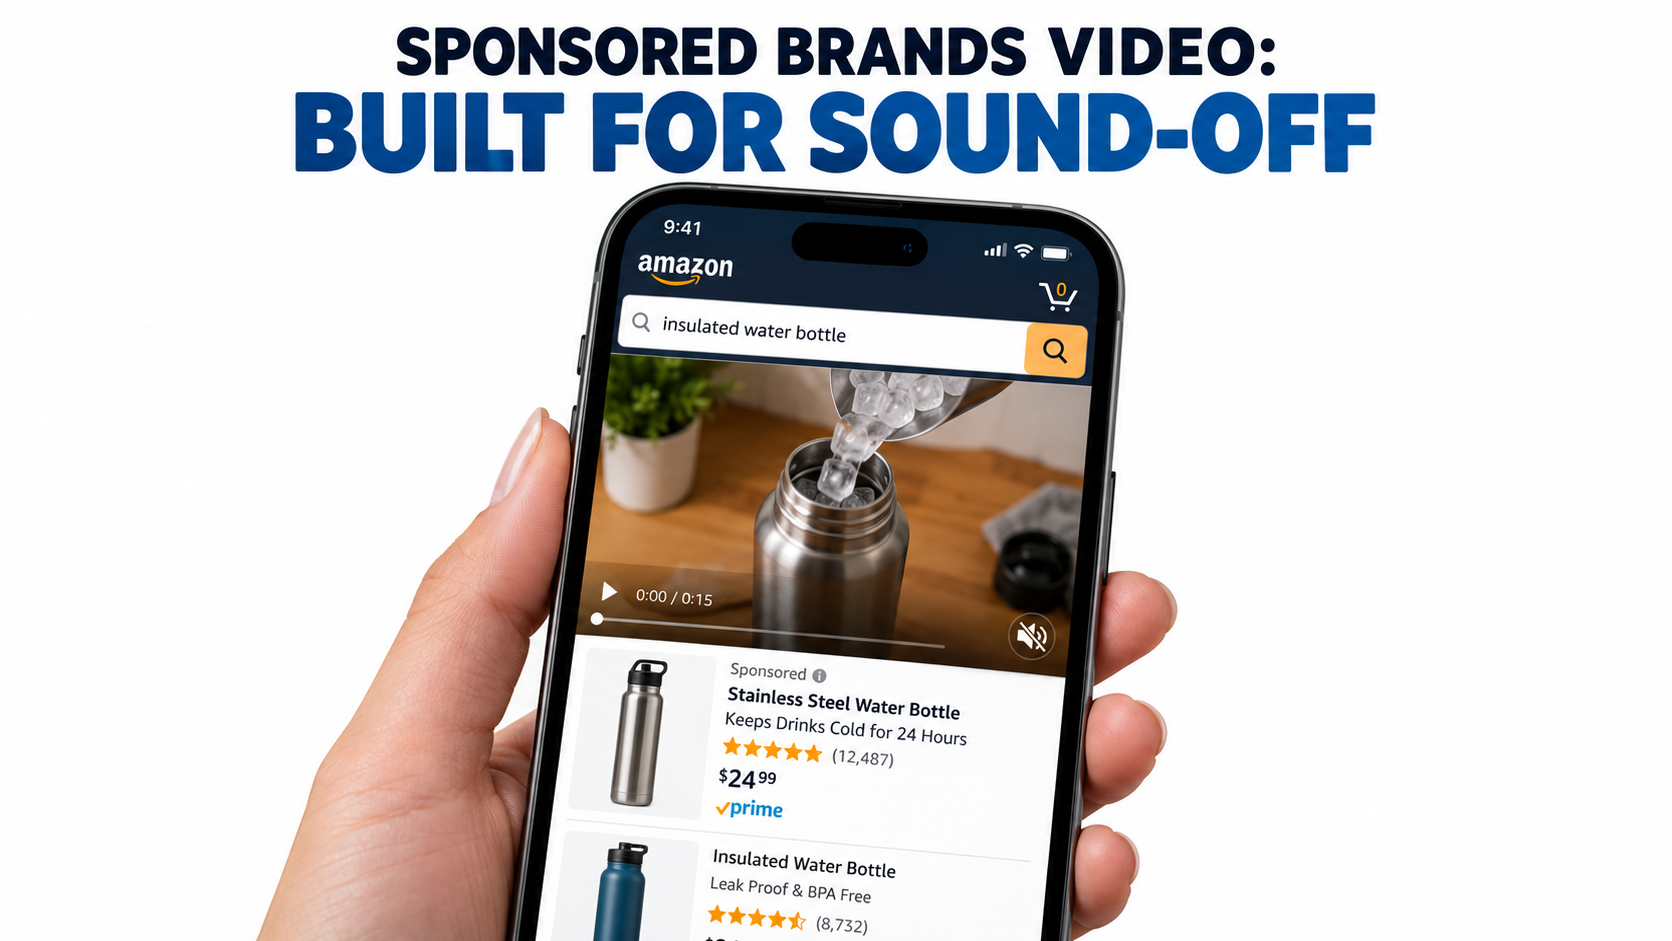
The Ad Unit You’re Actually Buying
Before you write a script, it helps to take apart the placement piece by piece. Amazon describes Sponsored Brands as an ad product that helps shoppers discover a brand through video, image, or collection creatives. These ads show up in prominent spots such as top of search and product pages. Video is one creative format inside that product. It’s billed on a cost-per-click basis and targeted through keywords, categories, and products.
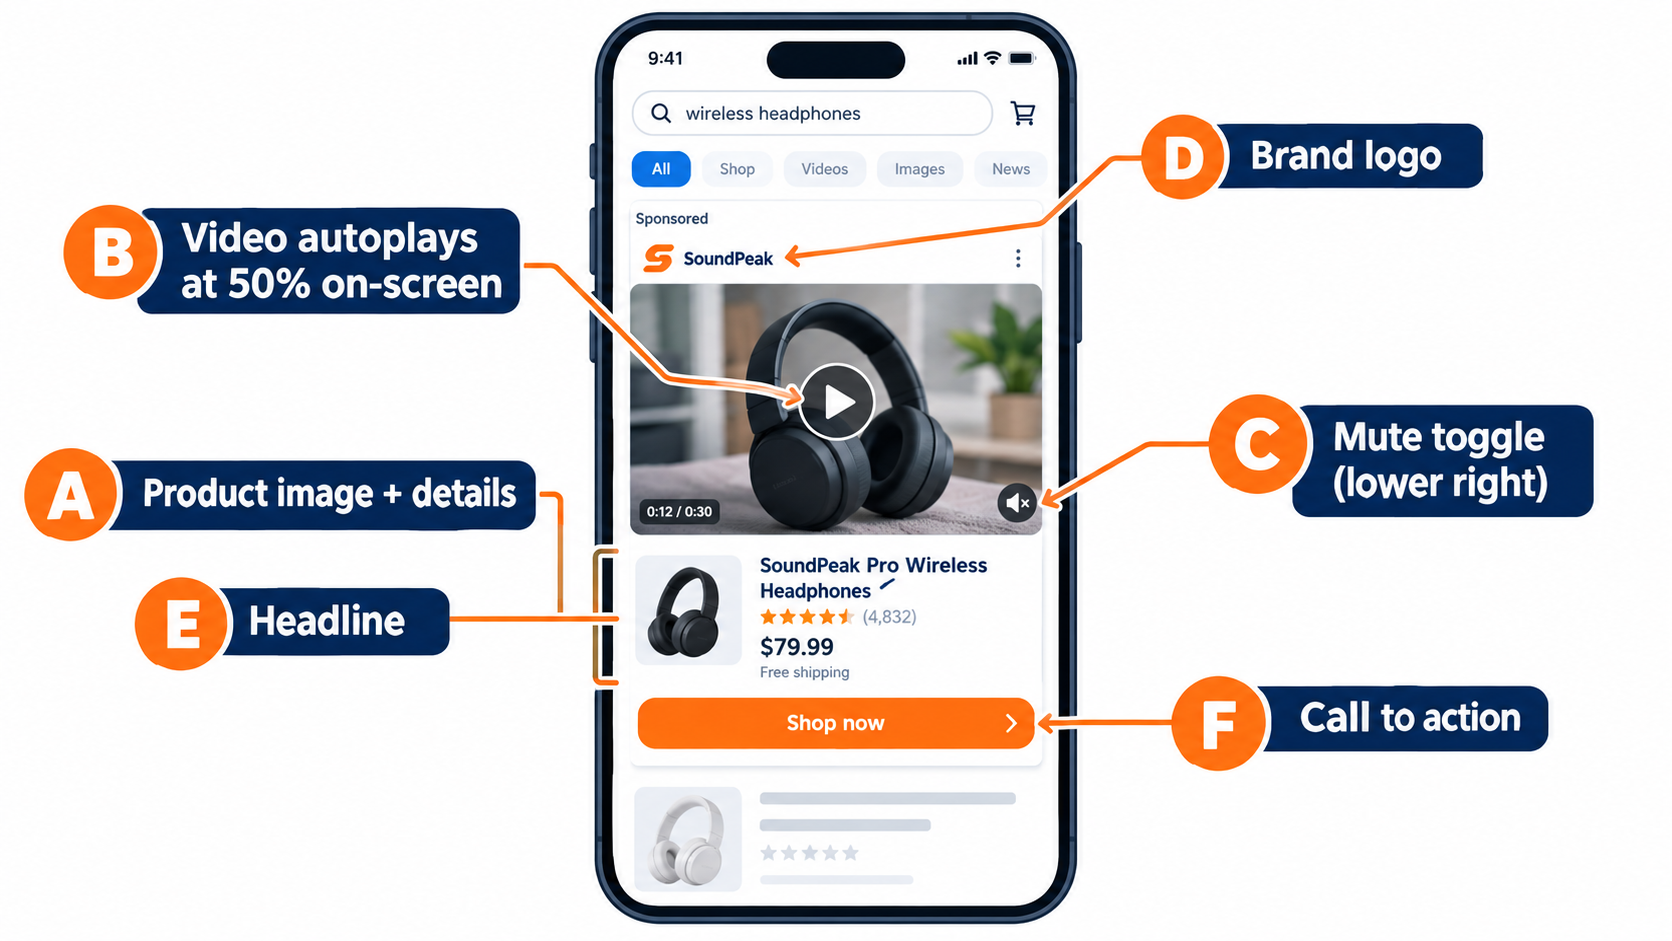
The six parts of the unit
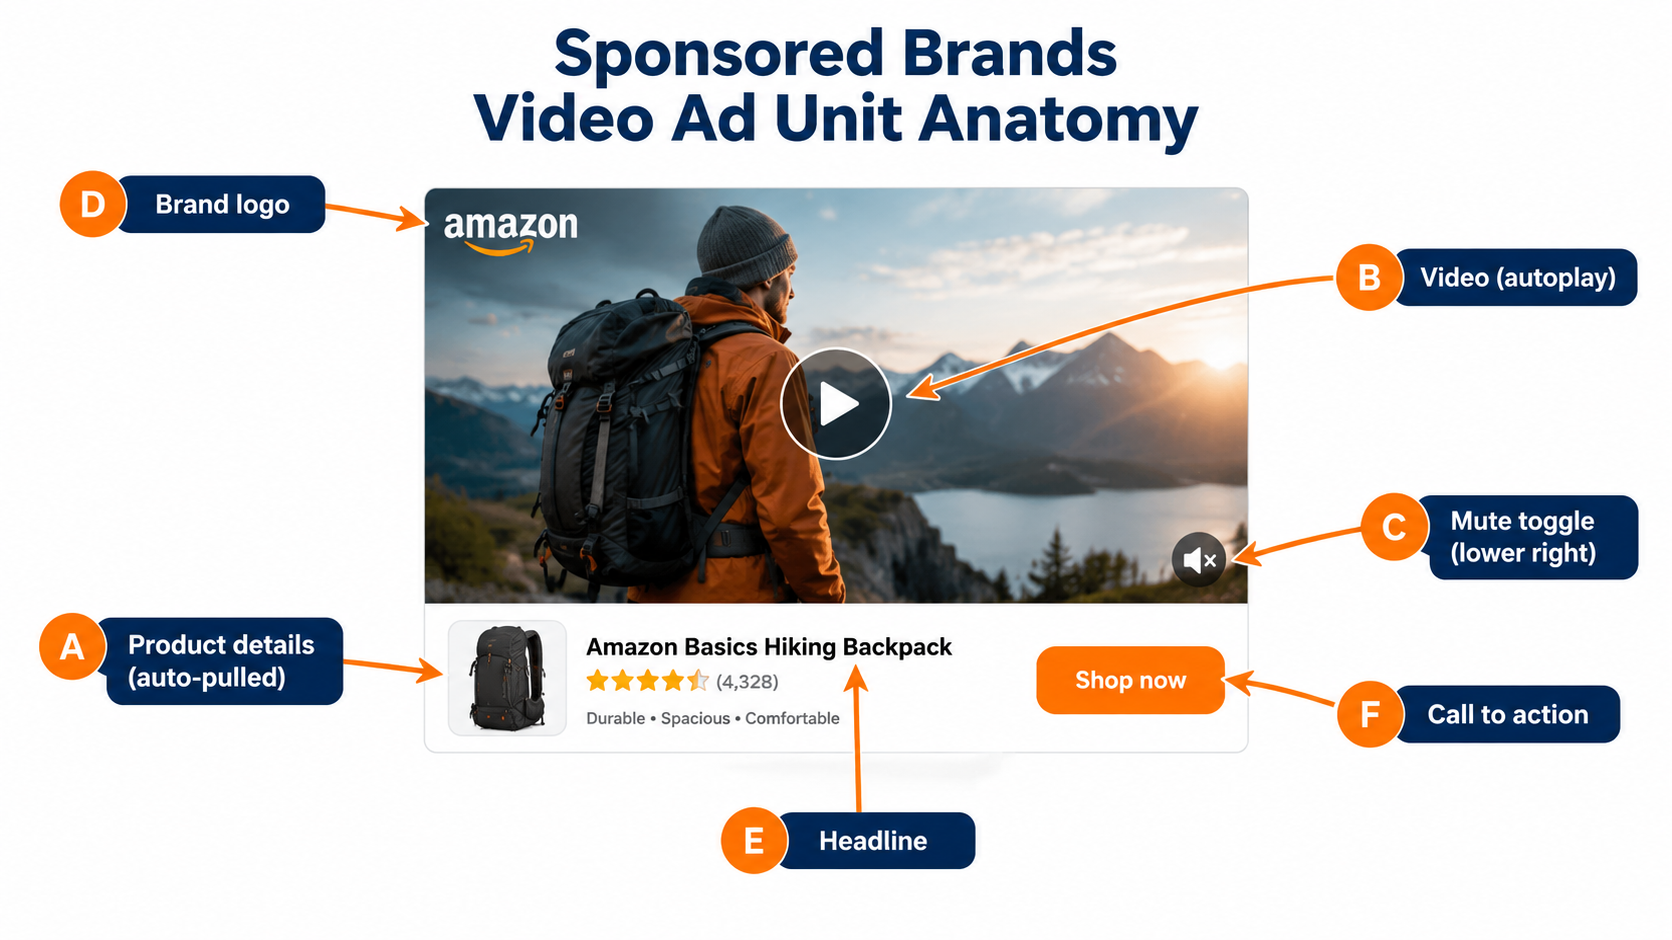
Amazon’s spec page breaks the video ad unit into labeled parts:
- Product details: The primary product image and related information pulled automatically from the detail page.
- Video: Autoplays when 50% of its pixels are visible.
- Mute toggle: Overlaid in the lower-right corner. Videos always start without audio, and the toggle isn’t shown if the video is silent.
- Custom brand logo: Amazon recommends a clear, easy-to-read logo.
- Headline text: Custom copy that communicates your brand’s value.
- Call to action: Lets shoppers know they can take an action, such as visiting your Brand Store.
Two of those parts come from your detail page, not from your video file. Your main image, title, price, and rating appear next to the video whether you plan for them or not. A weak main image or a thin review count undercuts the ad before the video even has a chance to work.
Where it appears
Amazon says Sponsored Brands ads may show above, alongside, or within shopping results, on both desktop and mobile. The Sponsored Brands overview lists top of search results, top of mobile search results, and top of the Amazon home page among the placements. The video spec page adds that Sponsored Brands video can also appear within detail pages.
On the spec page, Amazon notes that Brand Store campaigns can be featured both above and below the fold of search results. In practice, a lot of video impressions show up mid-scroll inside the results grid. That’s where shoppers move fastest and pay the least attention.
Why this framing matters
When you see the unit as “a muted, autoplaying, 16:9 rectangle inside a busy shopping page next to my own listing data,” a lot of common creative choices start to look wrong. A cinematic slow fade-in burns seconds you don’t have. A spokesperson talking to camera says nothing to someone who never unmutes. A logo-first open tells shoppers who you are before they have any reason to care.
Everything that follows comes from that one reframe.
Muted by Default: Rewriting the Script for Silence
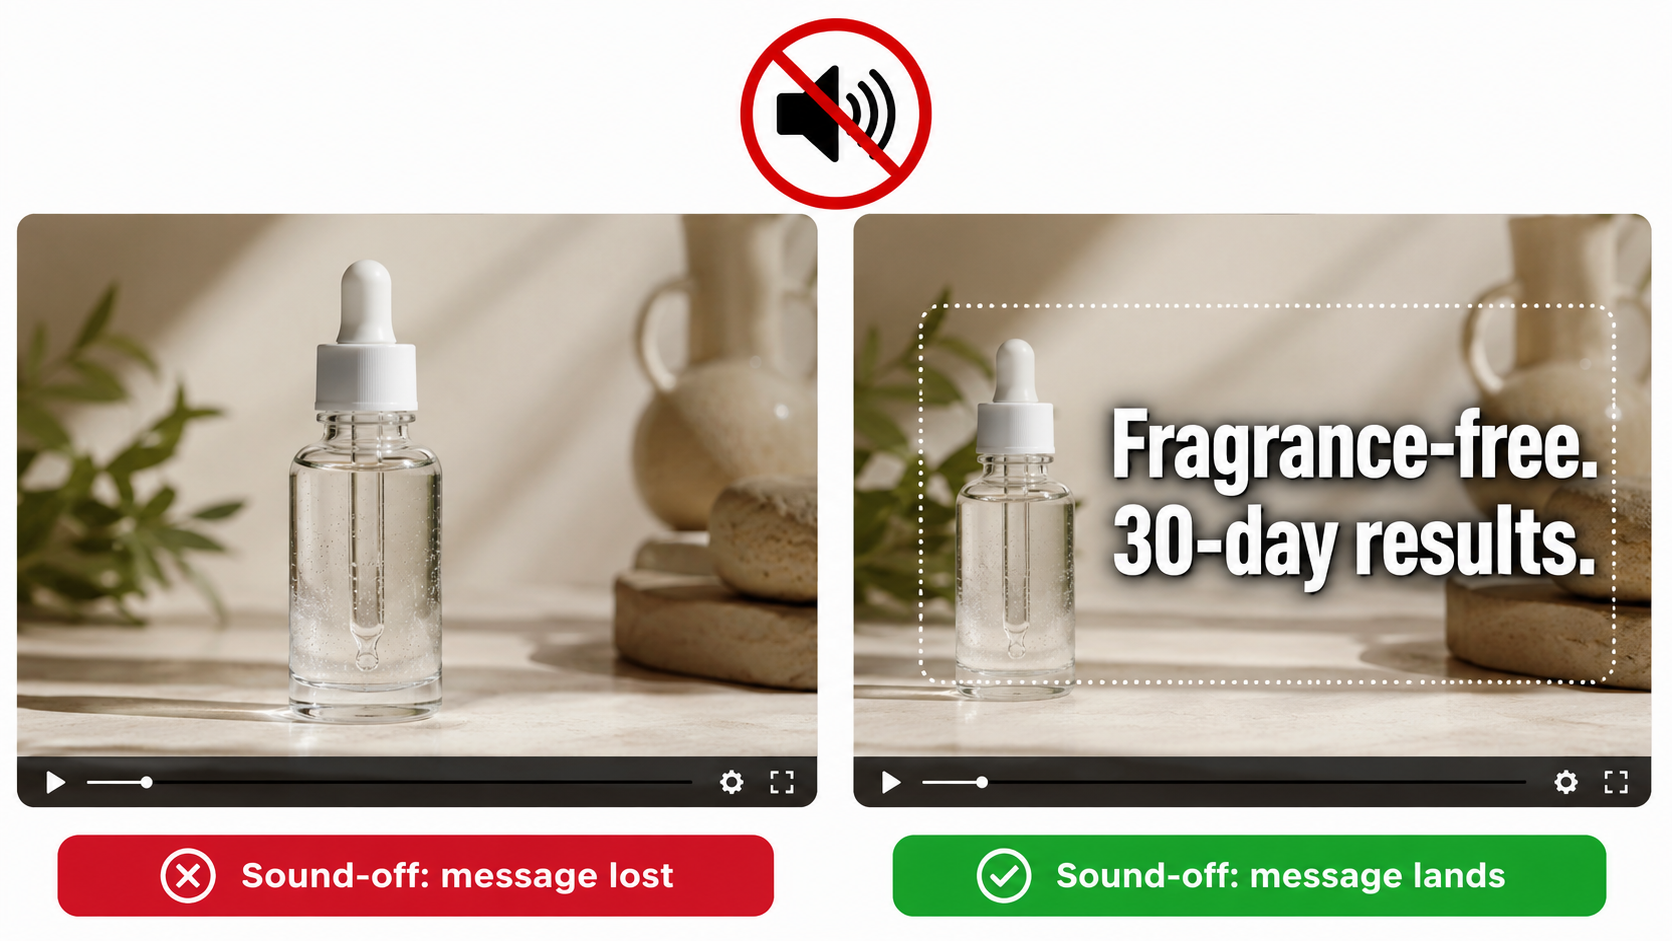
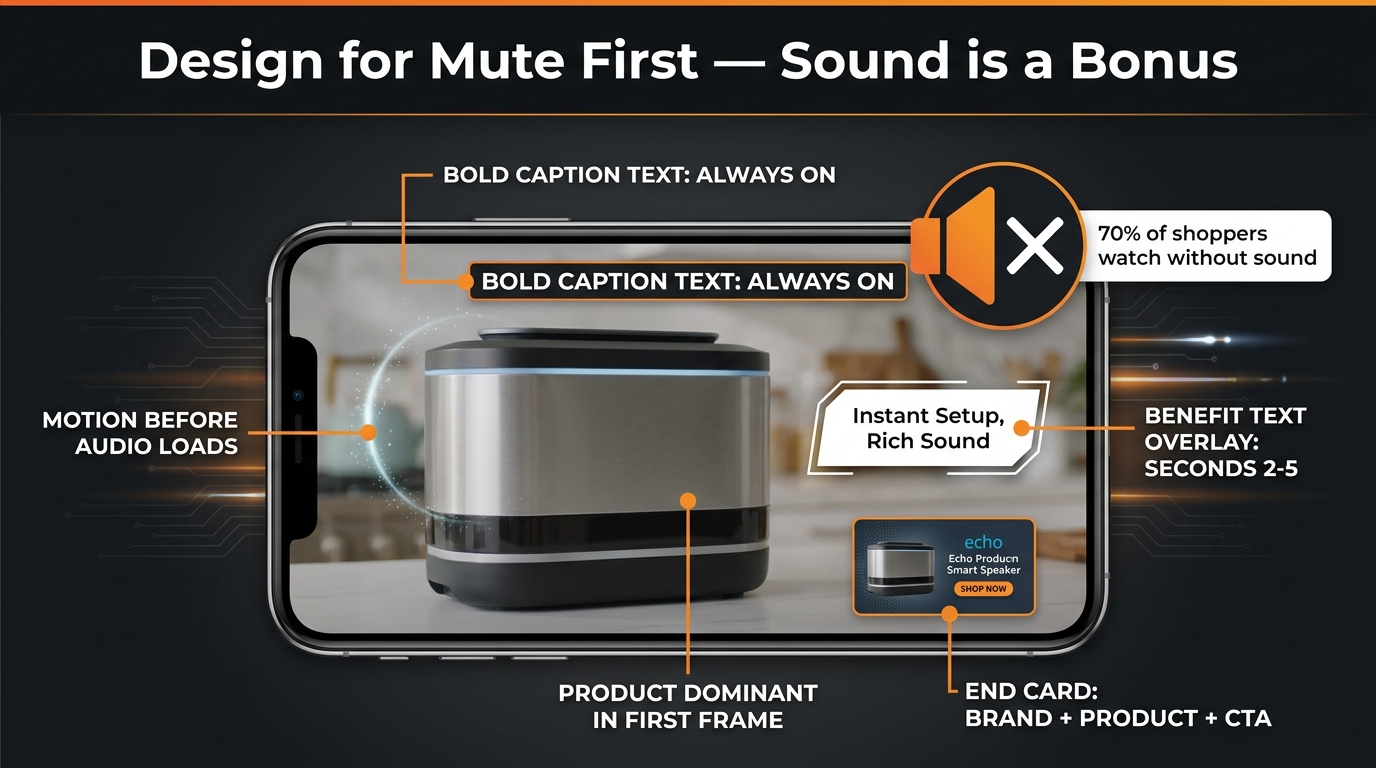
Amazon’s wording is direct: “By default, videos always start without audio.” Shoppers can turn sound on by tapping the toggle, but that takes a deliberate action from someone who came to shop, not to watch. Your working assumption should be that most viewers will never hear your audio track.
The silent-first test
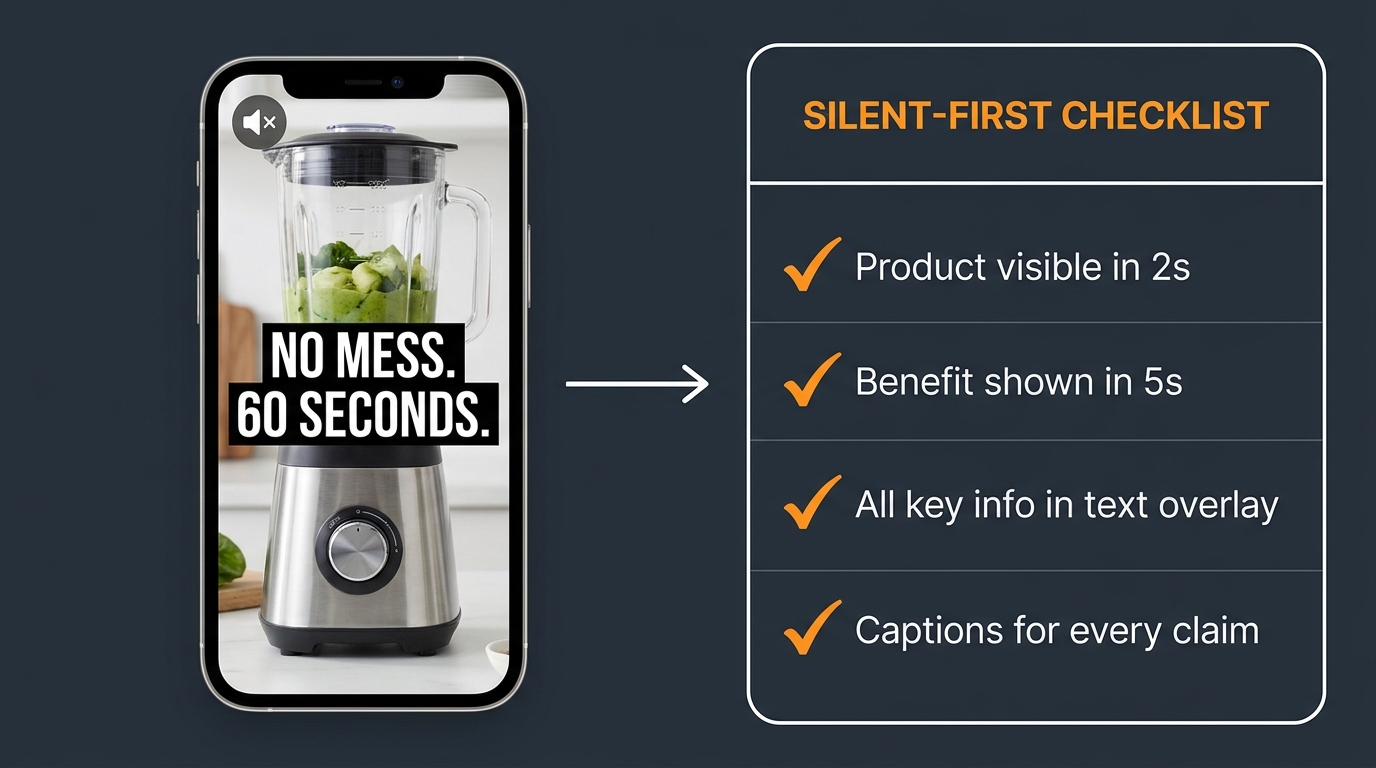
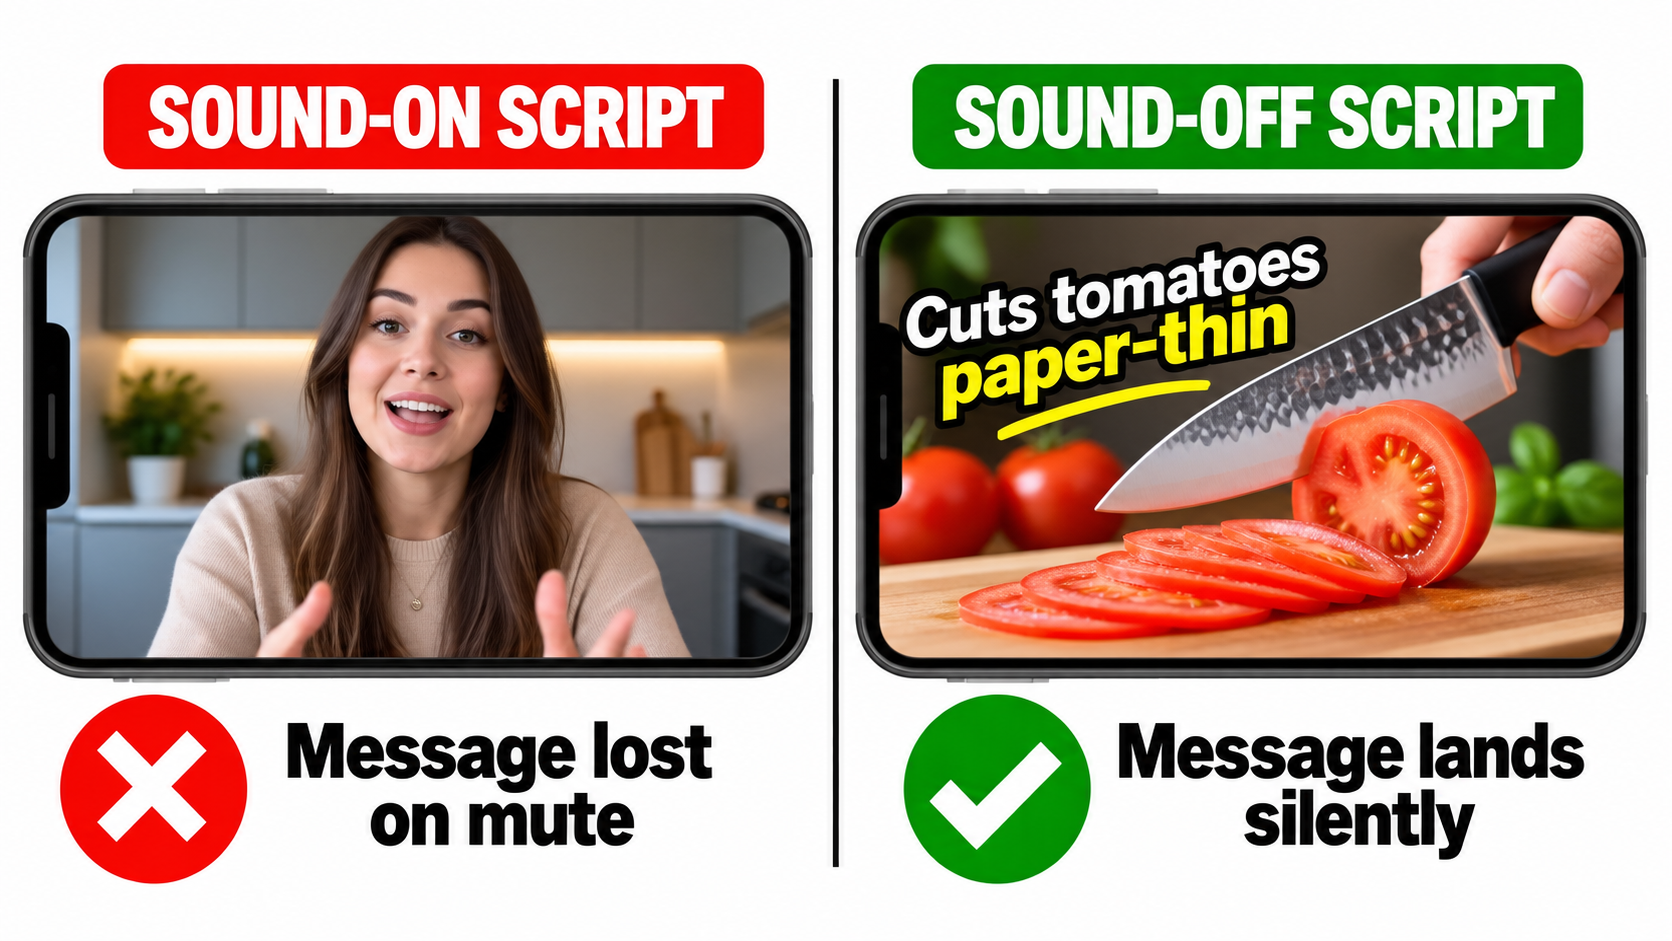
Here’s a simple check you can run on any draft. Watch it with the sound off, once, at normal speed, on a phone. Then answer three questions:
- What is the product?
- What does it do better than the alternative?
- Why should I tap?
If you can’t answer all three from the visuals and on-screen text alone, the video isn’t ready. Audio can add to the message, but it can’t be the only place the message lives.
Show the action, not the explanation
Silent video does best when it shows a visible change: before and after, problem and solution, ordinary versus your product. A stain disappears. A cable organizer turns a nest of wires into a clean line. A blender crushes ice in one pulse. These moments read in a fraction of a second with no narration needed.
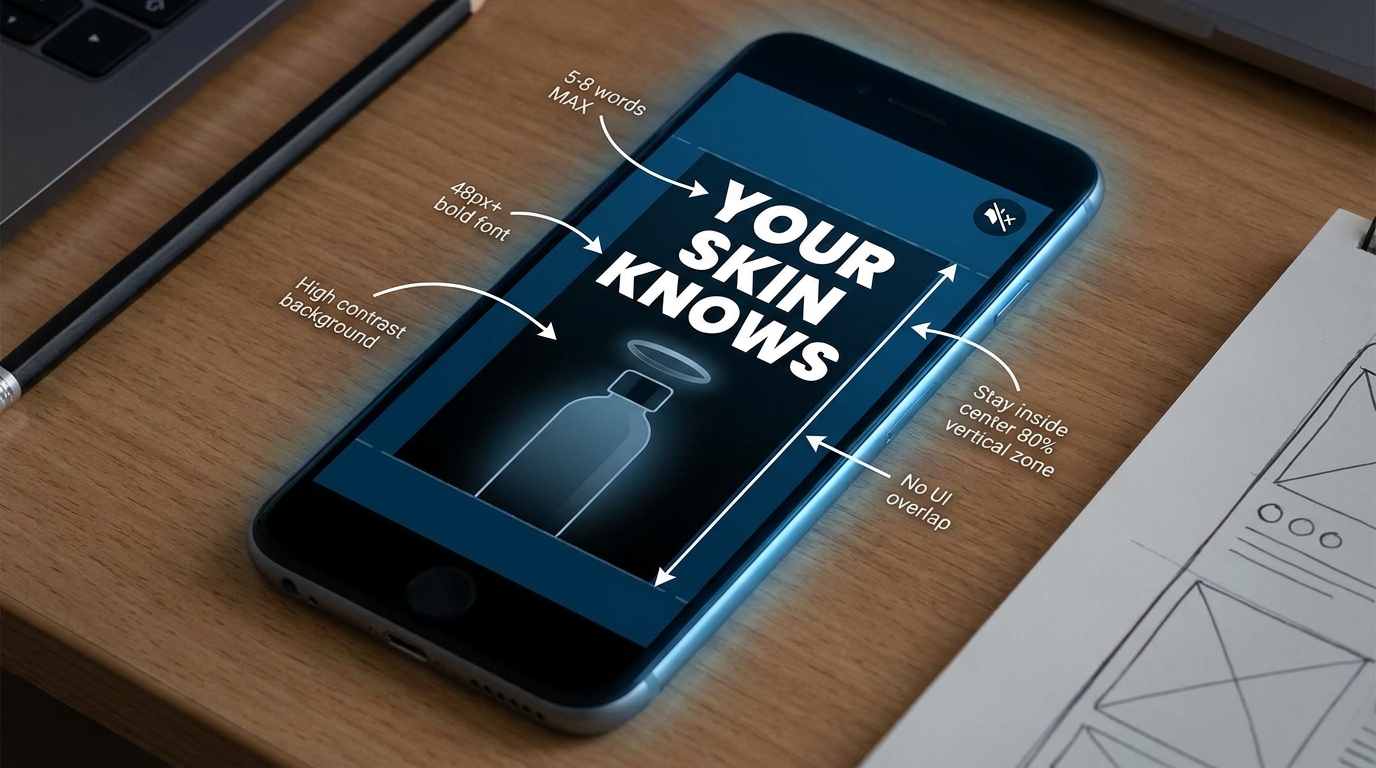
Products whose value is hard to see, like supplements, software accessories, or anything sold on specs, need more on-screen text to carry the claim. That’s fine. Just make sure the text is large, high contrast, short, and on screen long enough to read on a small phone.
On-screen text rules that hold up on mobile
- One idea per card. “Leak-proof lid” works. “Leak-proof lid with triple-seal silicone gasket and lifetime warranty” doesn’t.
- Keep it on screen long enough. A good rule of thumb is to leave a text card up long enough to read it out loud twice.
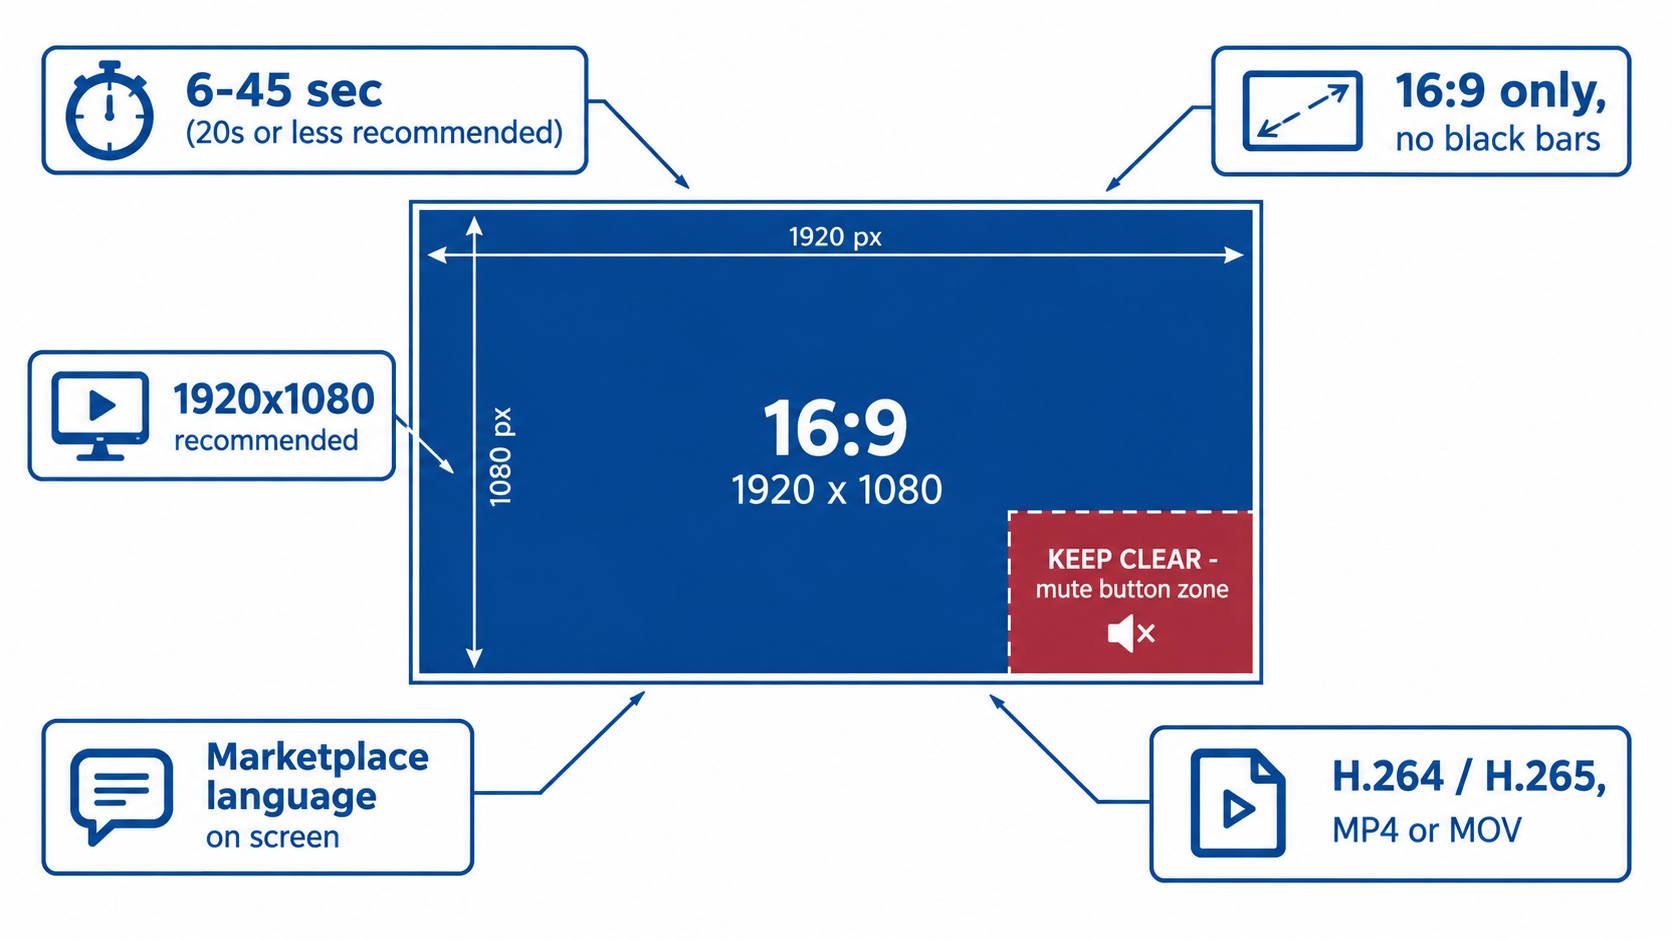
- Match the marketplace language. Amazon requires videos to match the language of the marketplace. English-speaking locales need English on-screen text or English voiceover, and the Italian marketplace needs Italian. If you sell across marketplaces, Amazon suggests subtitles or separate localized versions.
- Stay away from the lower-right corner. More on that in the safe-area section below.
Should you still use audio?
Yes, but treat it as a bonus layer. Shoppers who do unmute are showing real interest, and a clean voiceover or satisfying product sound can reward that. Just write the audio track after the visual story is finished, not before. If your edit only makes sense with the voiceover, it’s a radio ad with pictures.
One more point: if your video has no audio at all, Amazon says the mute toggle won’t appear. Some brands choose a fully silent cut for a cleaner frame. That’s a reasonable choice for product-demo creative where sound adds very little.
The First Two Seconds: Designing for the Scroll
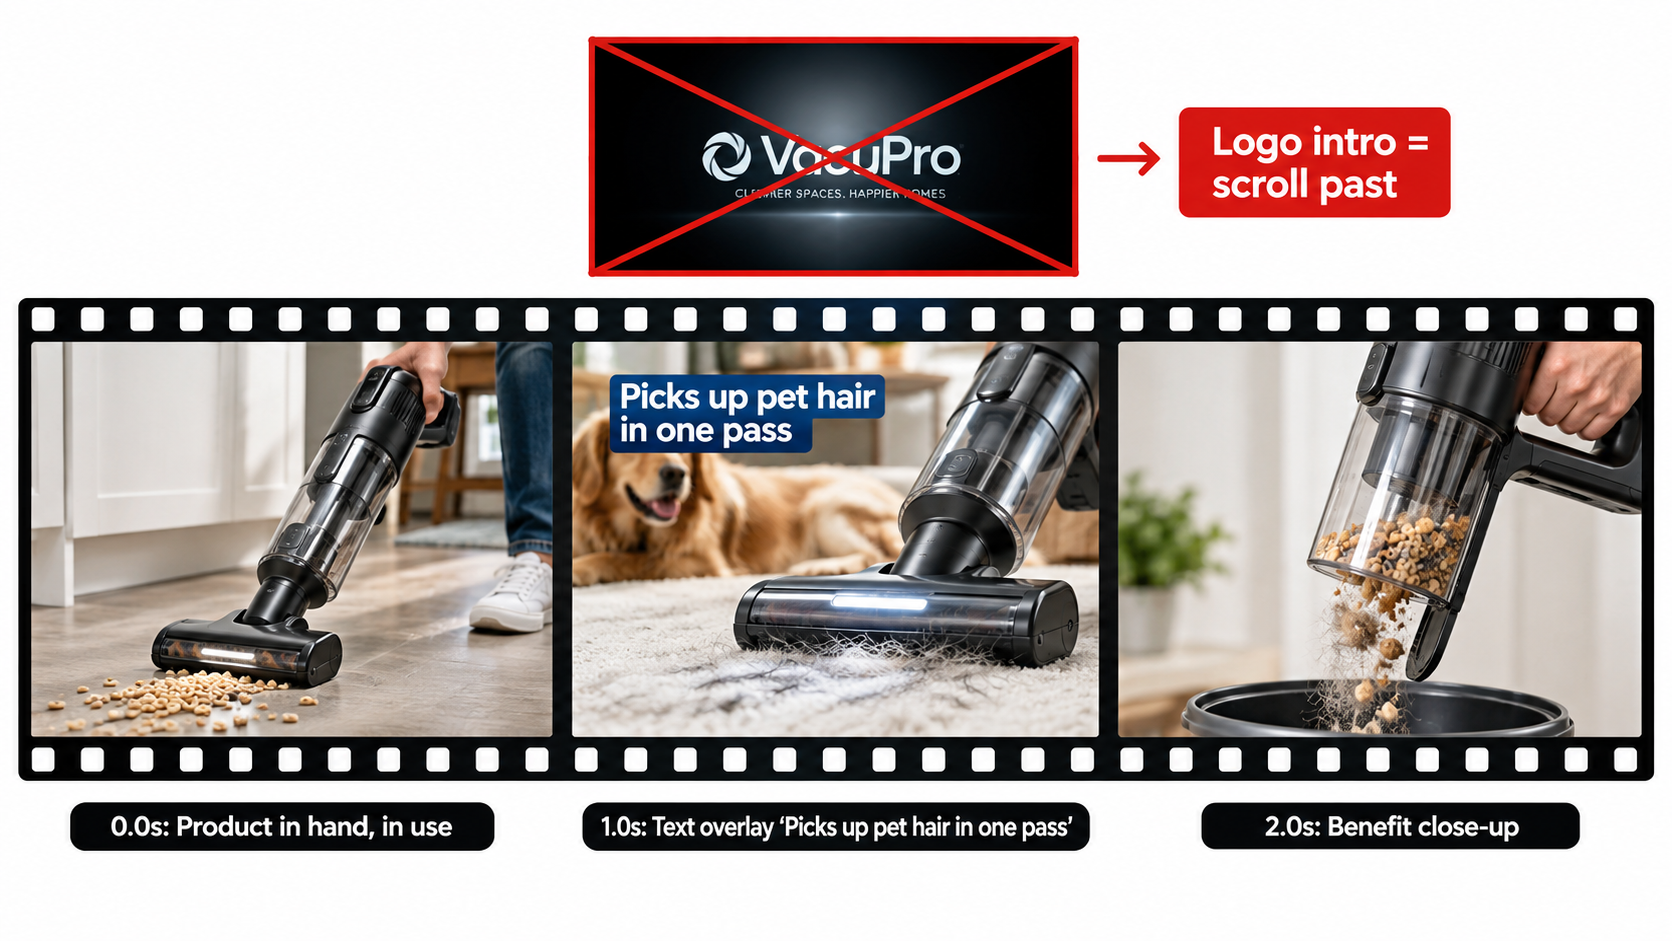
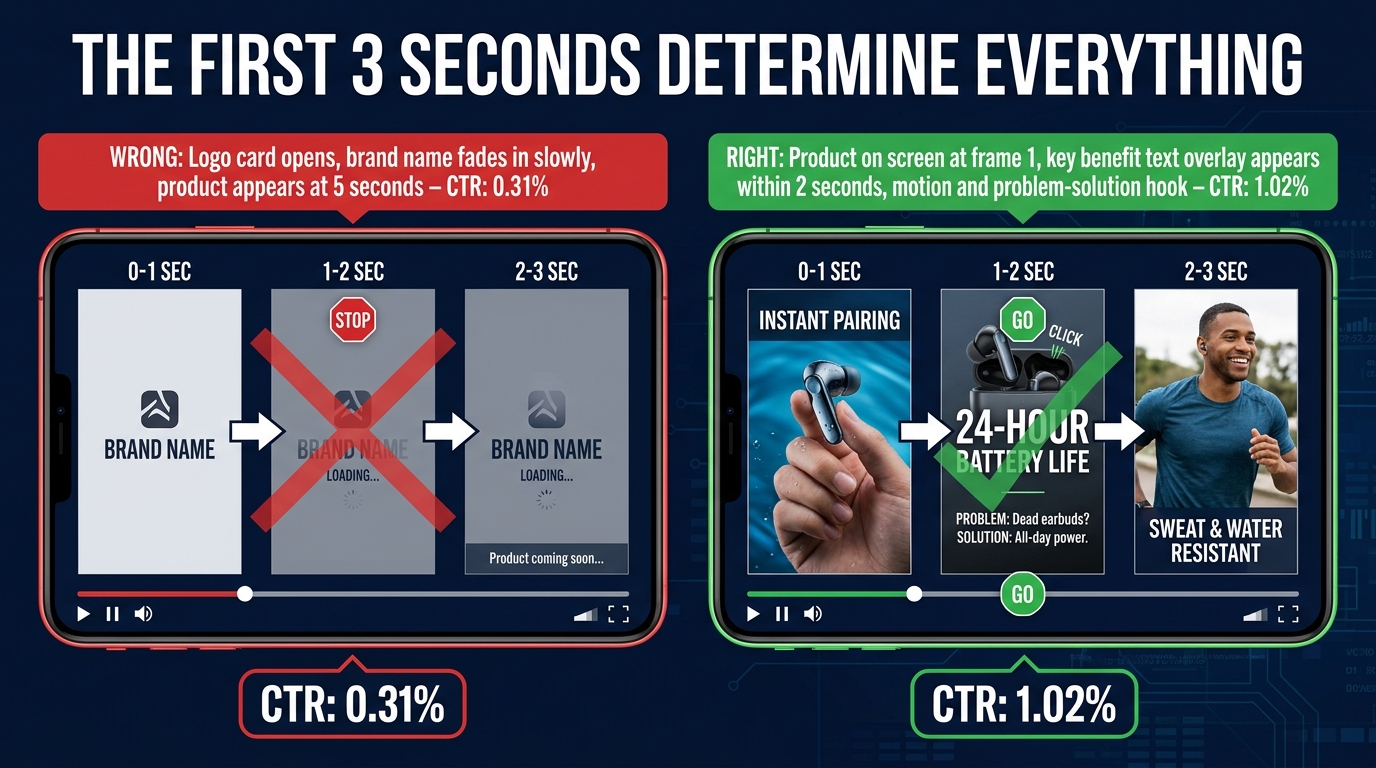
Amazon’s creative guidance says to “showcase your product or something interesting within the first few seconds to catch the shopper’s attention.” It also says to “wait until later in the video to include your brand name and logo.” That second line goes against how many brand teams are trained to work, and it’s worth taking seriously.
Why the logo shouldn’t open the video
When a shopper scrolls past, your video autoplays as soon as half of it is visible. For that moment, the only question is whether the frame looks relevant to what they searched. A logo answers “who made this,” which is a question nobody has asked yet. A product in use answers “is this what I’m looking for,” which is the question every searcher has.
The logo still matters. It belongs at the end, on an end card, after the product has earned some attention. Amazon specifically recommends an end card that clearly shows your brand name and logo.
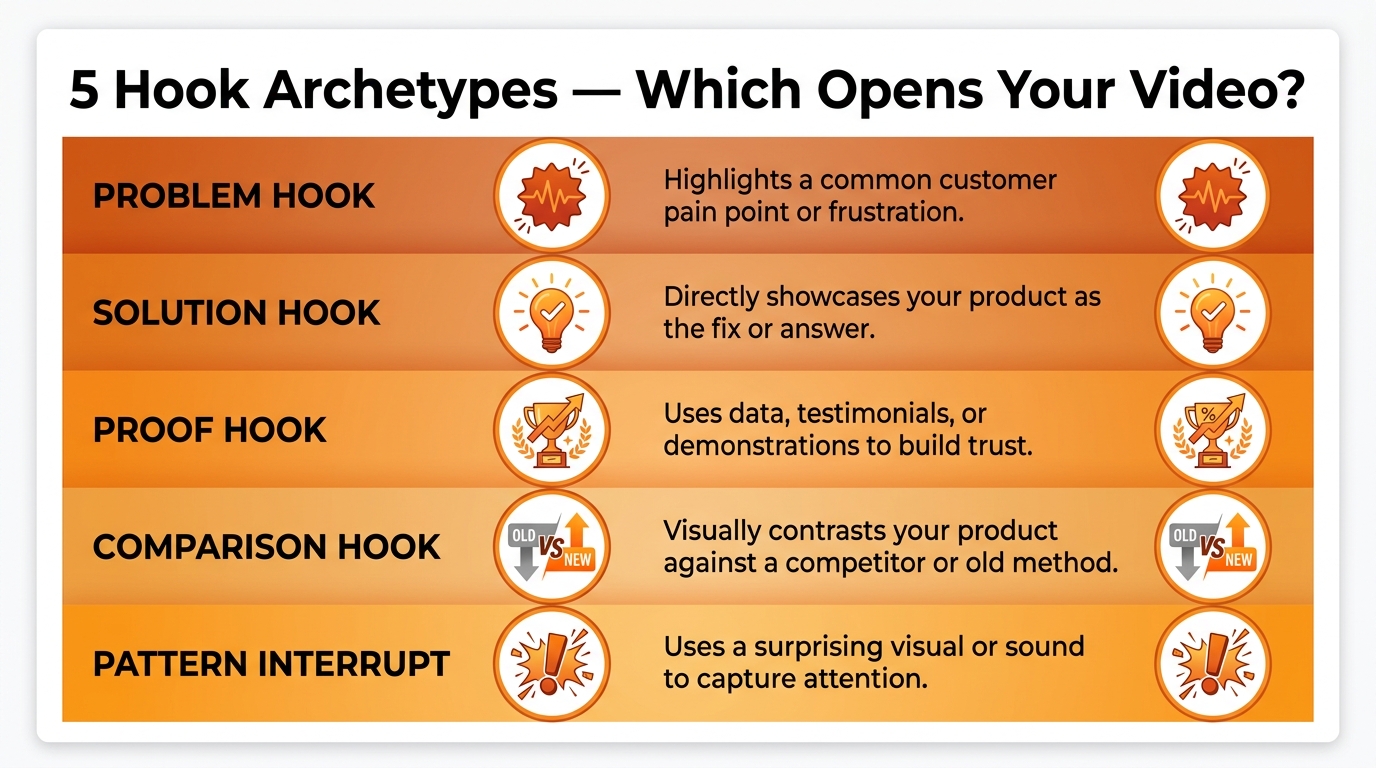
Three opening patterns that work silently
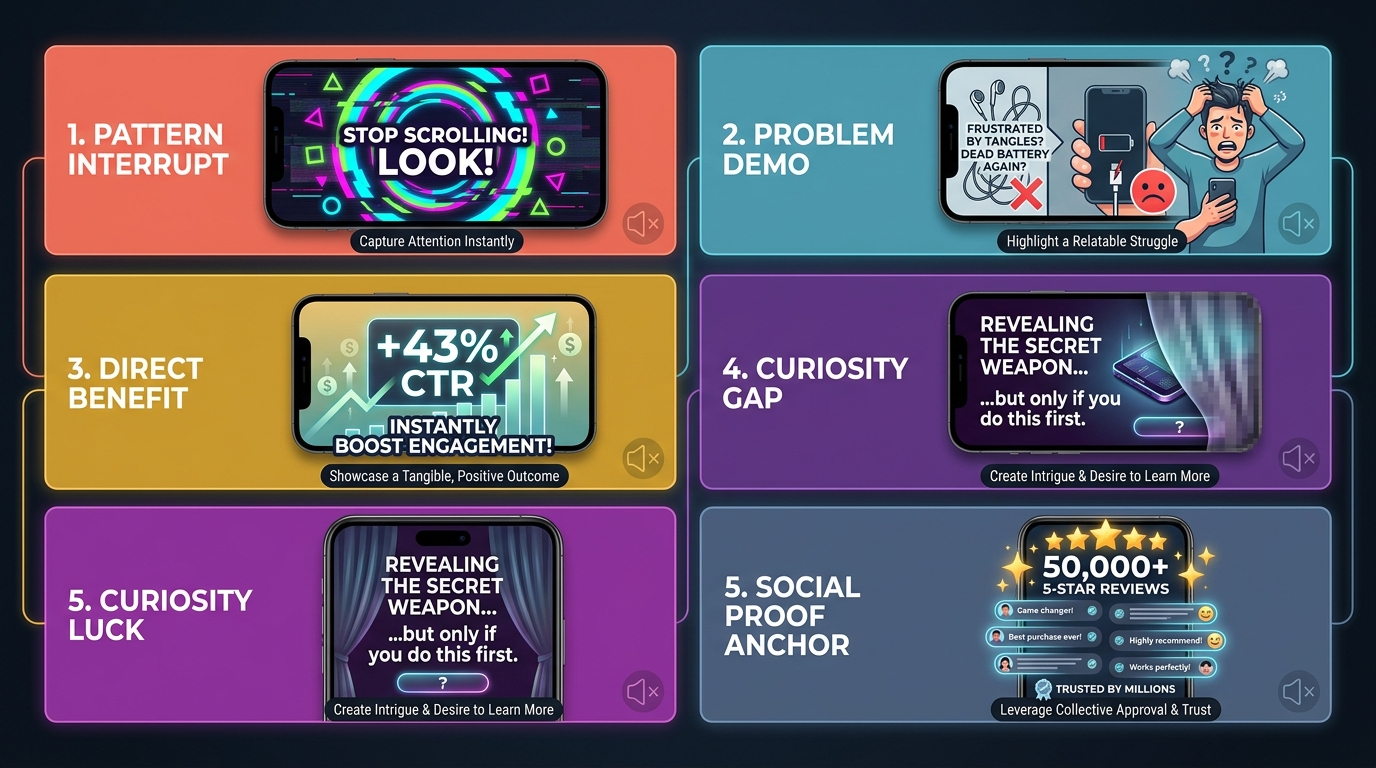
1. Mid-action open. Start partway through the product doing its job: the pour, the cut, the click, the fold. No setup shot or establishing scene. The motion itself pulls the eye in a static results page.
2. Problem frame. Open on the frustration your product fixes, like a tangled cord, a soggy lunch, or a phone at 2% battery. The shopper recognizes it right away. Then cut to the fix.
3. Outcome first. Show the end result up front, like the spotless surface, the finished meal, or the organized drawer. Then rewind to show how you got there. This works well for categories where the result is the selling point.
Match the opener to the search term
This is where creative and targeting connect. If a video targets “insulated water bottle for hiking,” an opener on a trail with ice clinking into the bottle (silently showing cold retention) fits the shopper’s intent. If the same video targets “kids water bottle,” that opener misses. One generic video stretched across every keyword cluster tends to underperform a few versions with openers matched to intent.
You don’t need a full reshoot for each version. Often a different first three seconds and a different headline are enough.
Watch for frame clutter
Your video plays next to your own product image, headline, and CTA, plus everything else on the page. A busy opening frame with props, patterned backgrounds, or several products competes with all of it. Clean backgrounds, one hero product, and strong contrast make that first frame read faster on a small screen.
Specs, Safe Areas, and the Rejections You Can Avoid
Creative rejections cost you time, and they’re usually preventable. Amazon publishes its technical specs and acceptance criteria, and most failures come from a short list of issues.
The technical specs
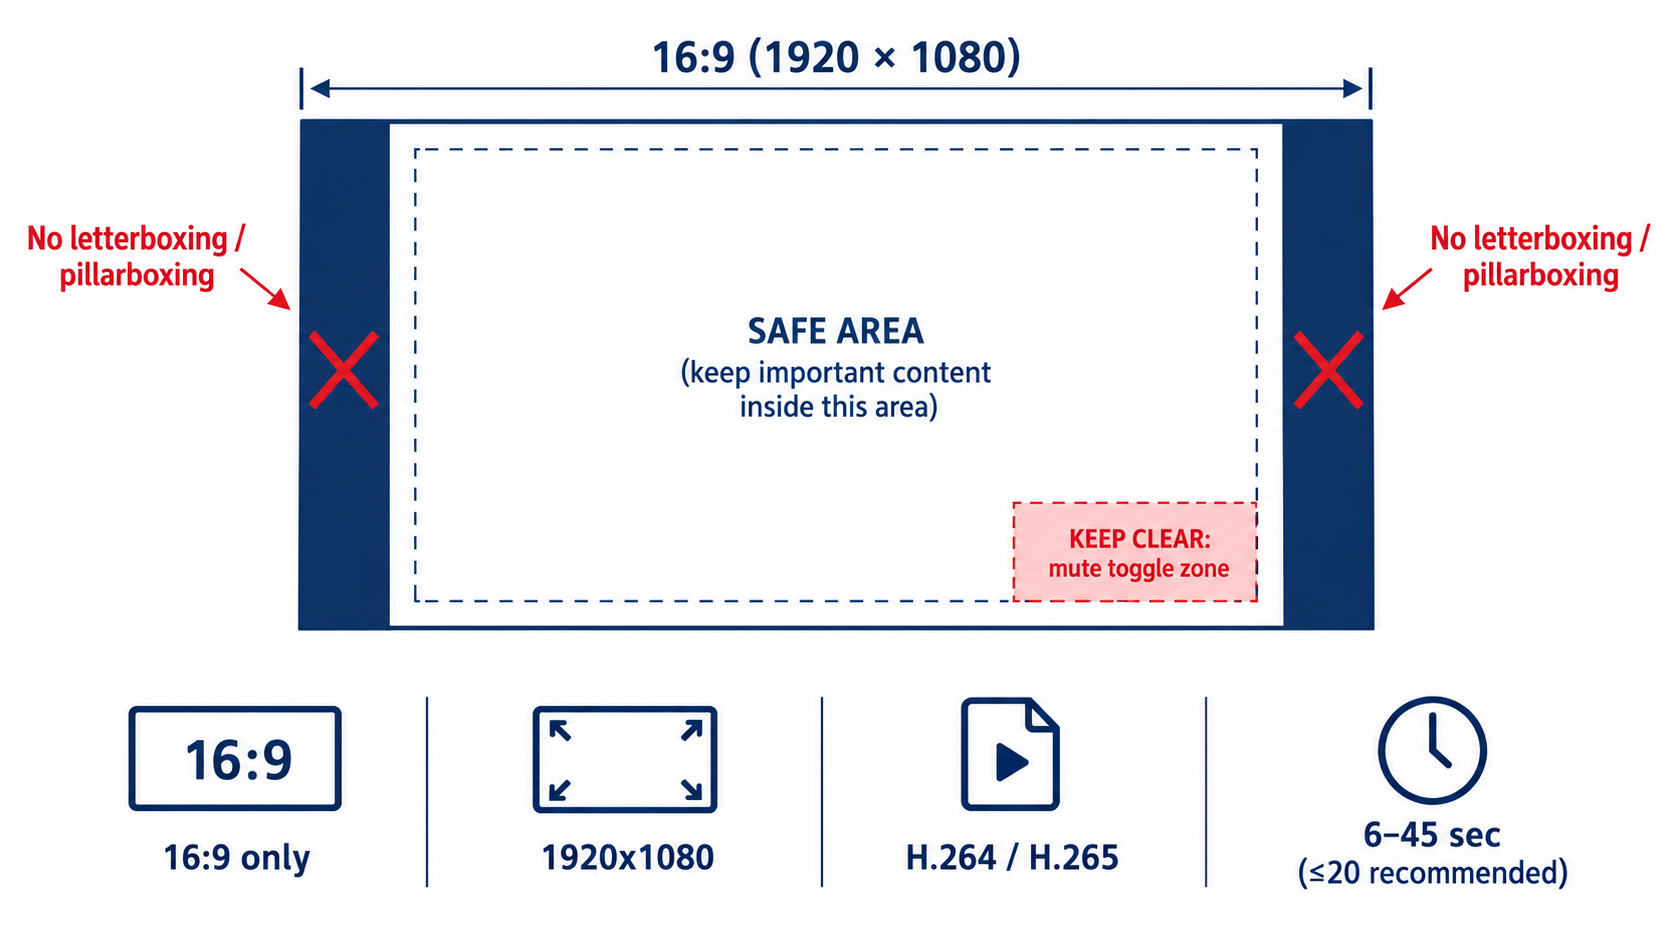
According to Amazon’s Sponsored Brands video ad spec page:
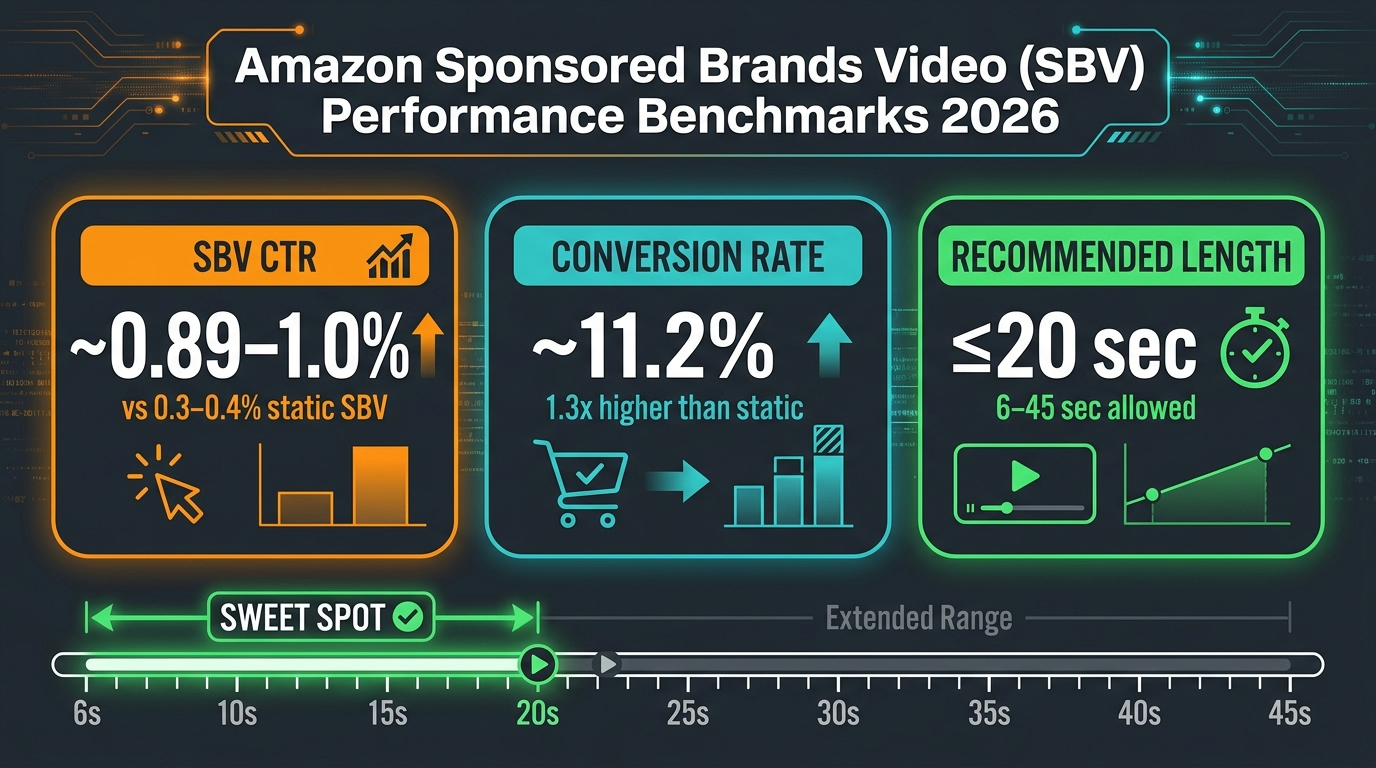
- Duration: 6 to 45 seconds, with 20 seconds or less “highly recommended”
- Dimensions: 1280×720, 1920×1080, or 3840×2160 px
- Aspect ratio: 16:9 (square pixel) only
- File size: 500 MB or less
- Format: .MP4 or .MOV
- Video codec: H.264 or H.265, Main or Baseline profile
- Frame rate: 23.976, 23.98, 24, 25, 29.97, 29.98, or 30 fps
- Video bit rate: Minimum 1 Mbps, with 4 Mbps or higher recommended
- Scan type: Progressive
- Audio: PCM, AAC, or MP3; stereo or mono; minimum 96 kbps; minimum 44.1 kHz sample rate
The 16:9 trap for social-first brands
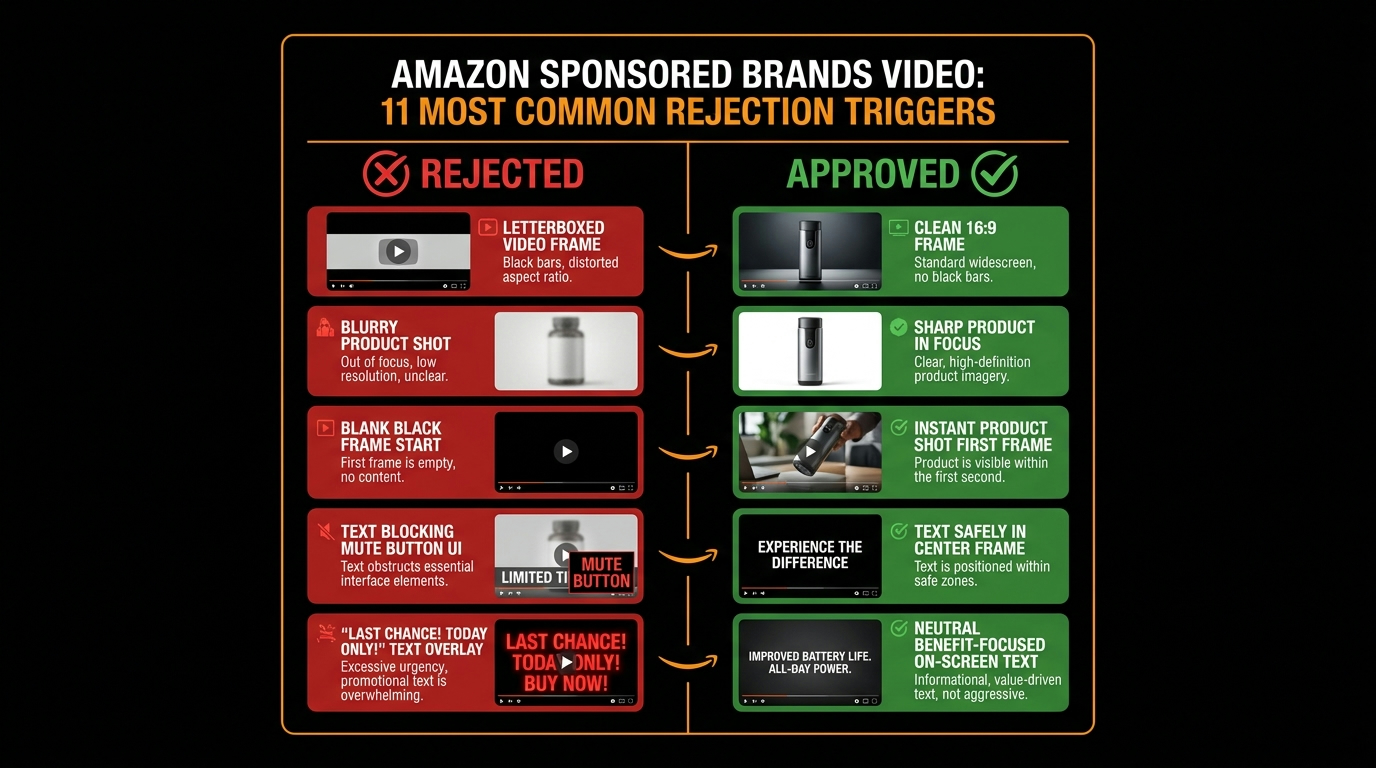
The most common mismatch today is vertical content. Many brands produce most of their video for vertical social feeds, and it’s tempting to reuse those assets. But Sponsored Brands video accepts 16:9 only. Dropping a 9:16 clip into a 16:9 frame creates side bars, and Amazon explicitly says to avoid letterboxing or pillarboxing, meaning horizontal or vertical black, colored, or blurred bars.
The blurred-background trick that social editors often use to fill a horizontal frame falls under that rule too. If your source footage is vertical, you have two real choices. You can reframe it, by cropping into the shot where the resolution allows and recomposing the subject. Or you can reshoot horizontally. Plan for both orientations at the shoot so you aren’t stuck with this later.
The lower-right safe area
Amazon tells advertisers to avoid placing text and other important information in the lower-right corner of the video, and it provides a safe-area template. The reason is practical: that’s where the mute toggle sits. A price callout, a key claim, or a “Shop now” prompt in that corner may get covered.
Build this into your editing template so every new video respects it automatically. Keep text in the upper and central parts of the frame, and keep the lower-right corner for background visuals only.
Policy and language checks
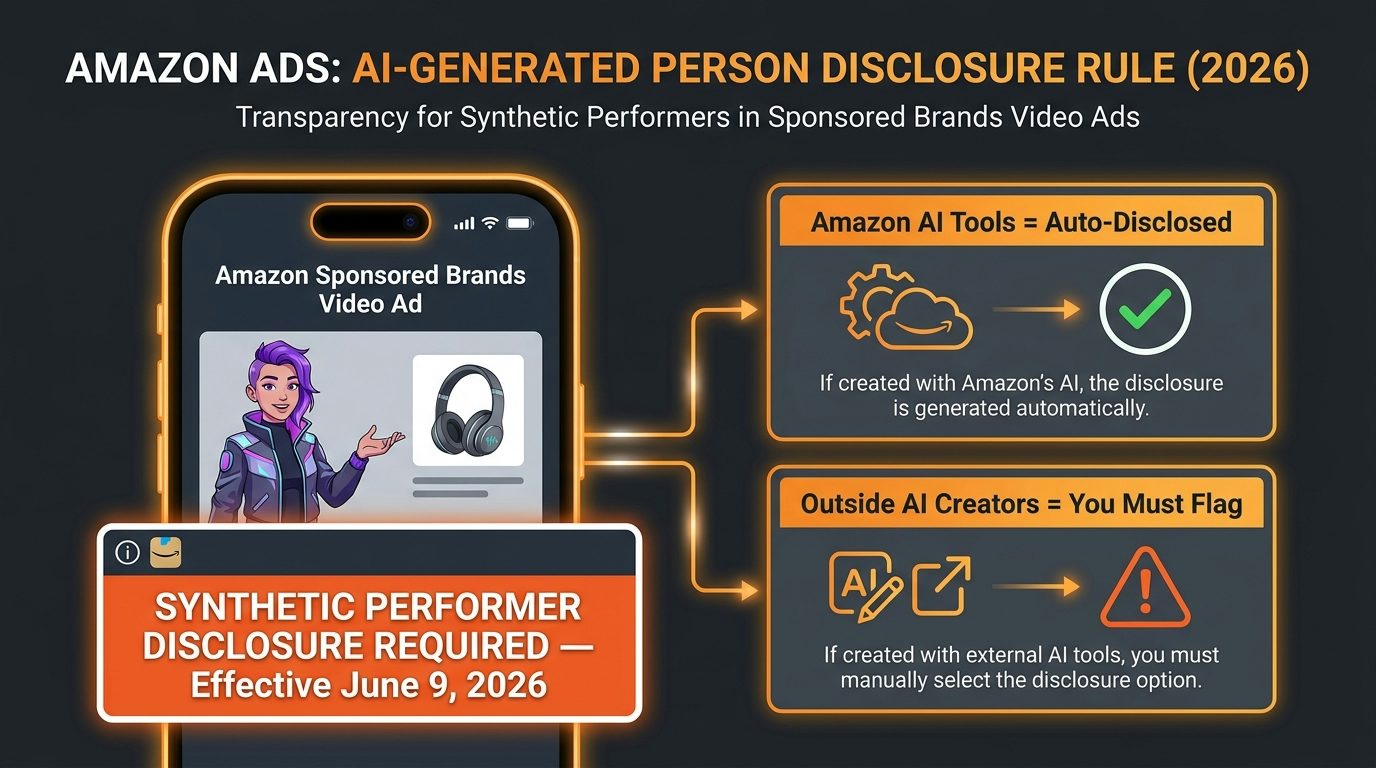
Amazon says all content must be suitable for a general audience, follow relevant laws and regulations, and meet its creative acceptance policies for sponsored ads. It recommends reviewing the Amazon Ads policies page before launch. The language-matching requirement covered earlier is also part of acceptance. A video with English text submitted to a non-English marketplace without localization is an easy rejection to avoid.
A pre-upload checklist
- Is it 16:9 with no bars of any kind?
- Is the lower-right corner free of text and key visuals?
- Does the on-screen language match the target marketplace?
- Is the bit rate at least 4 Mbps (the recommended level), progressive scan, and at an accepted frame rate?
- Is the duration within 6 to 45 seconds, ideally 20 or under?
- Are all claims ones you can support, and suitable for a general audience?
Editing to 20 Seconds: What to Cut and What to Keep
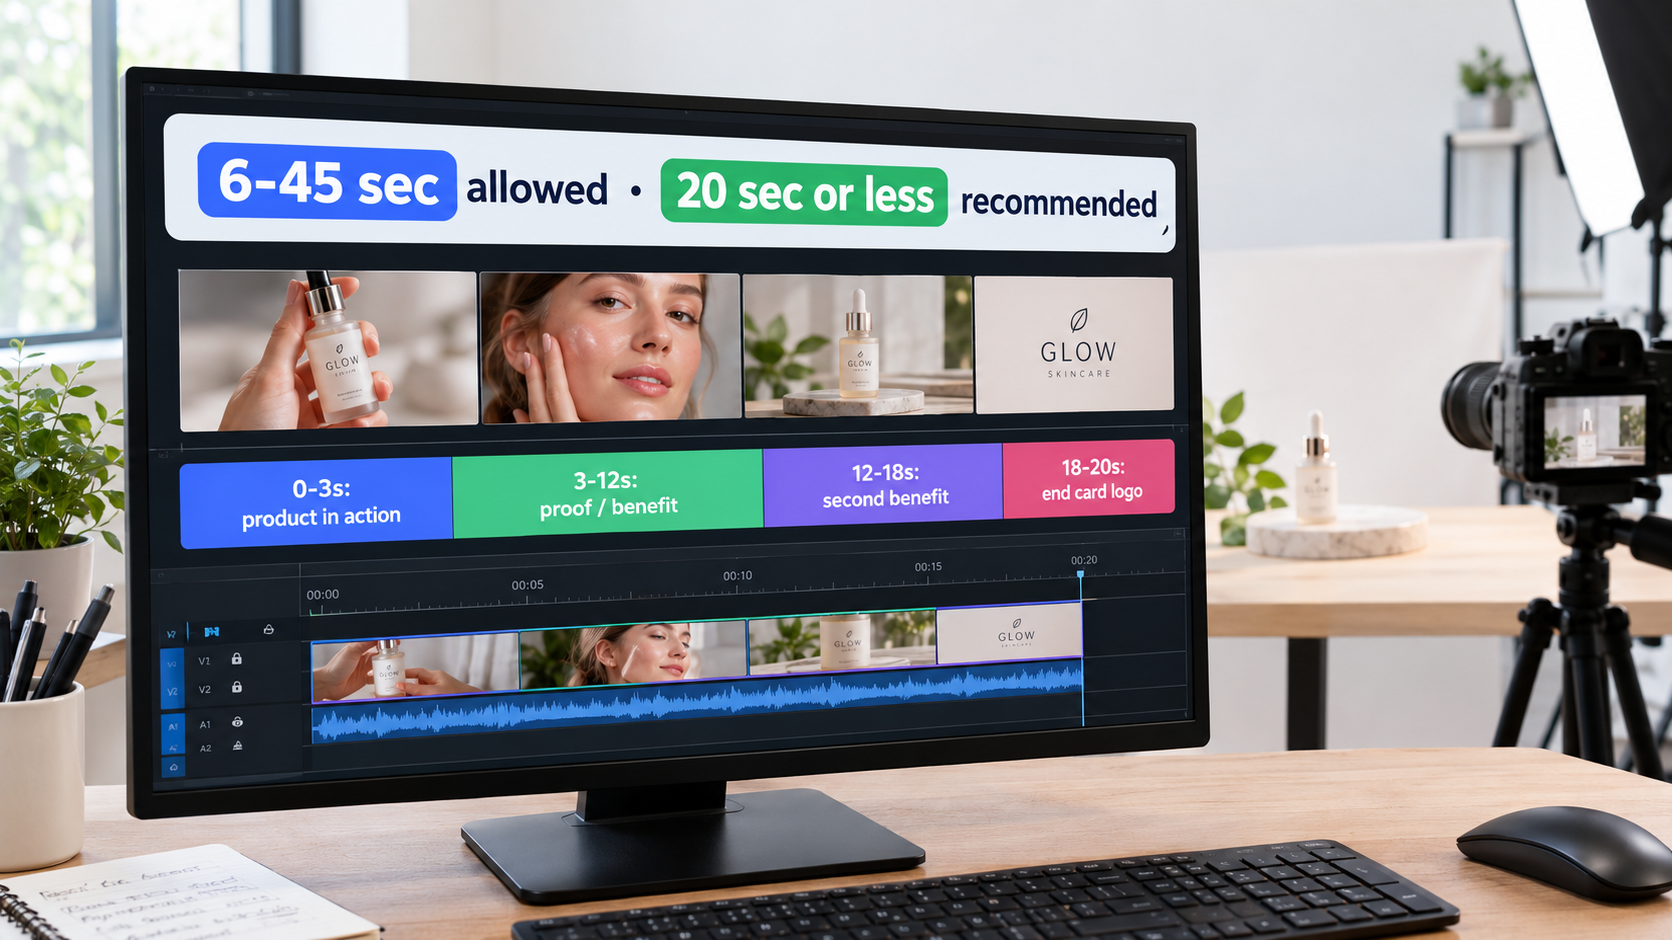
Amazon allows up to 45 seconds but “highly recommends” 20 seconds or less. Its guidance explains why: the goal of the video “is not to provide all the details about the product, but rather to create a sense of excitement and curiosity that will drive viewers to your product or Stores page for more information.”
That’s an important distinction. Your detail page already holds the bullets, the A+ content, the image stack, and the reviews. The video’s job is to earn the click, not to replace the listing.
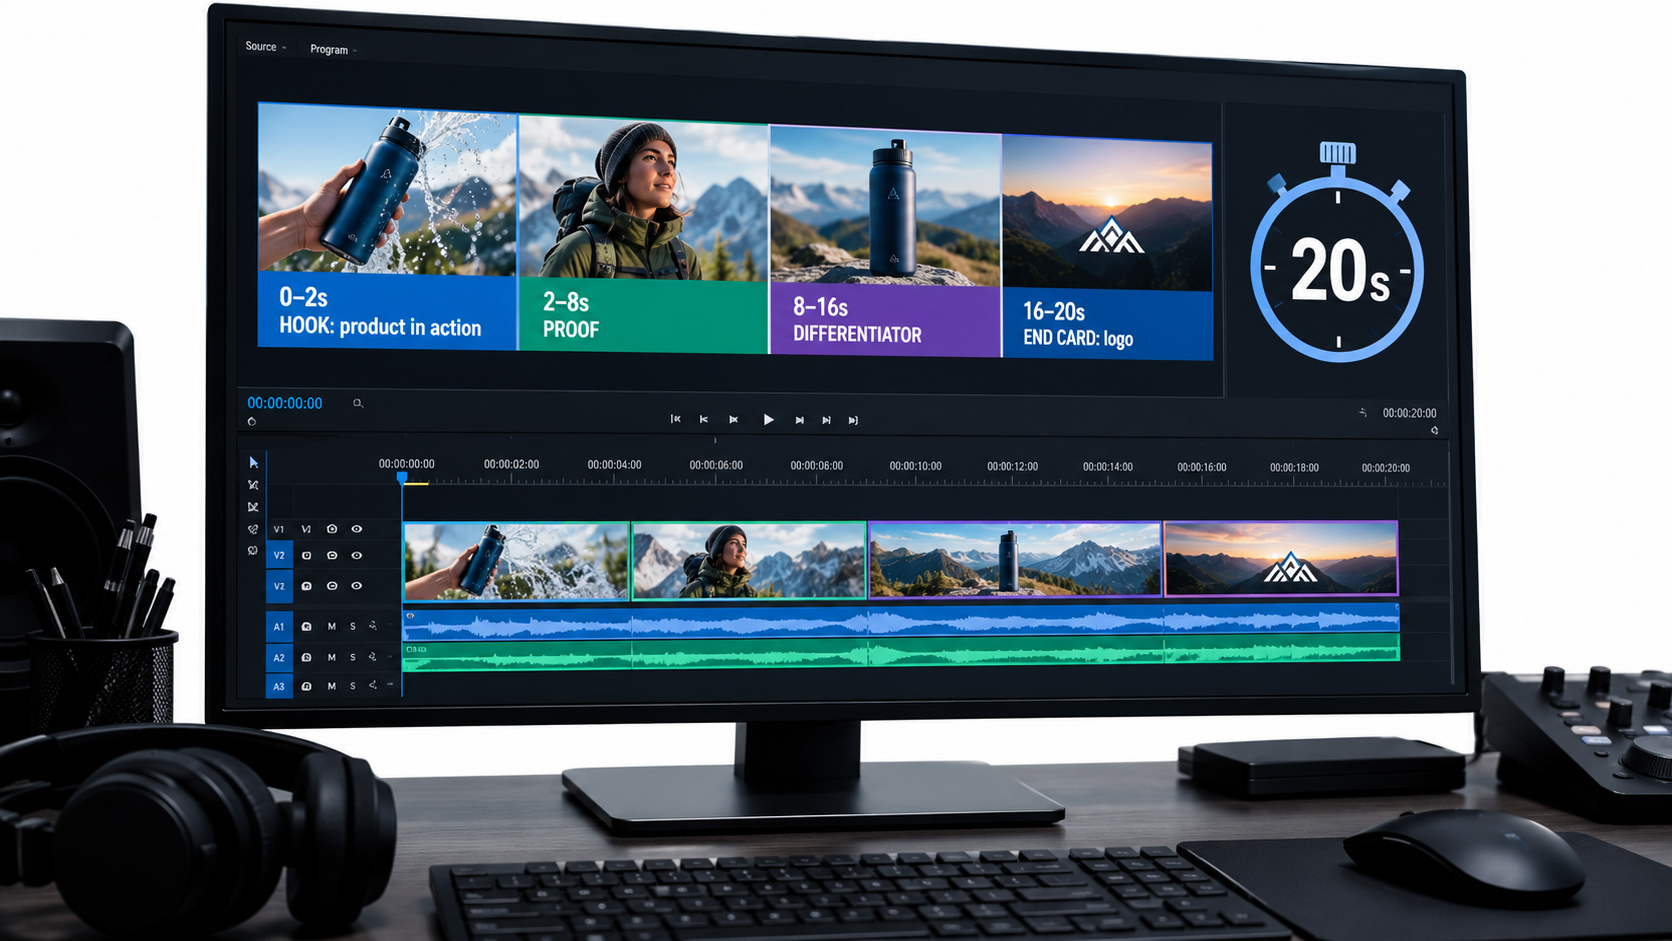
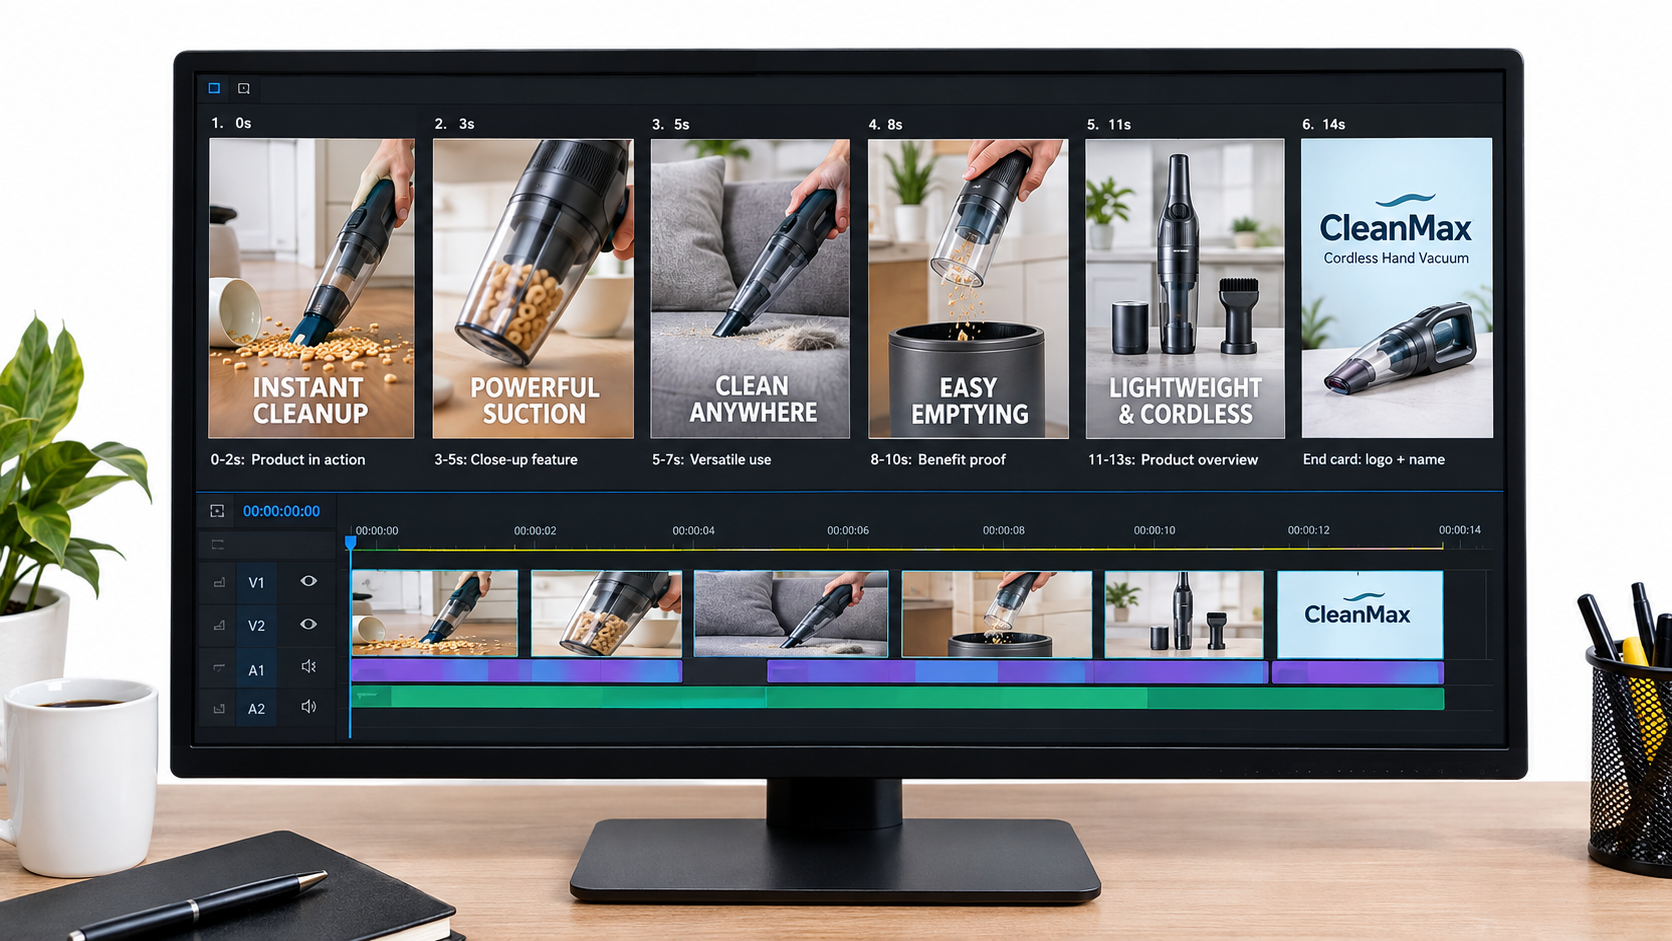
A working 20-second structure
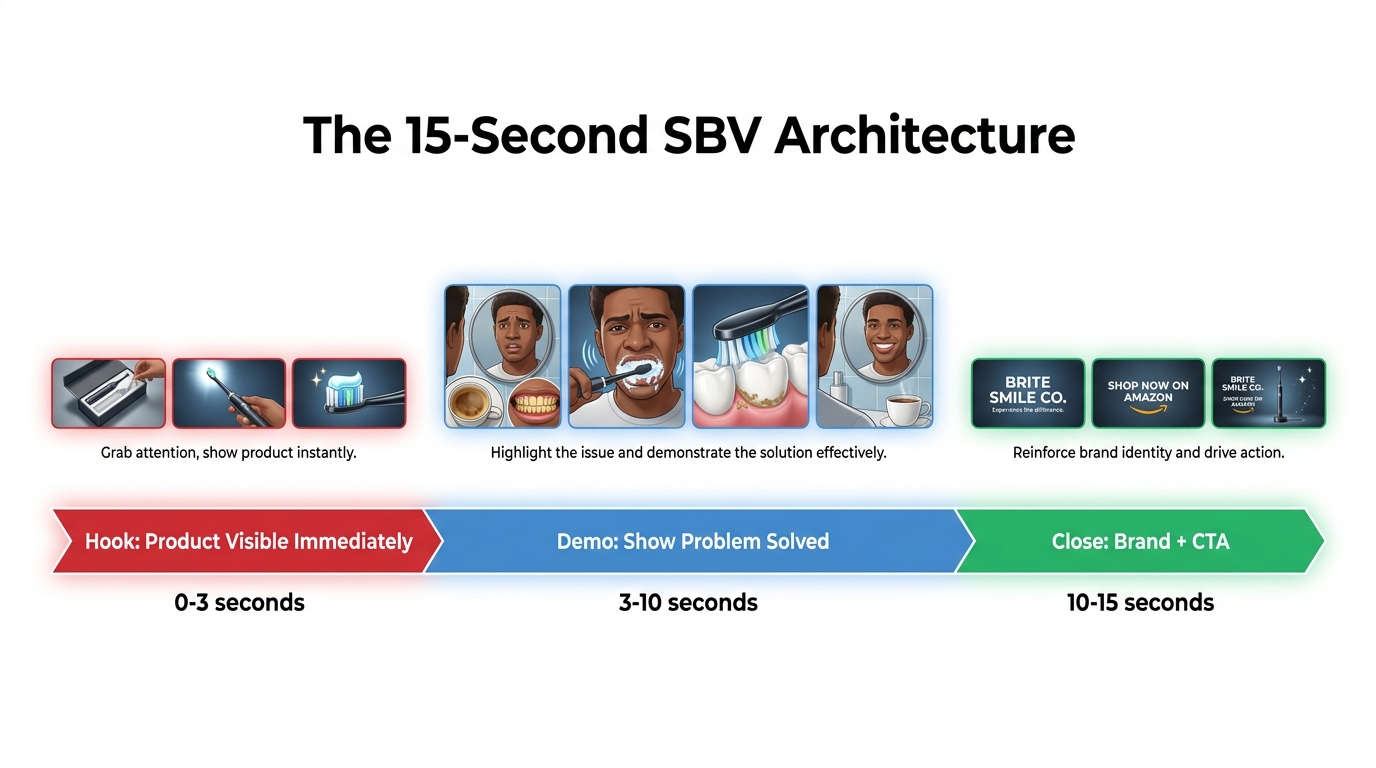
This structure isn’t an Amazon rule. It’s a practical way to apply Amazon’s guidance (product early, brand later, short and clear, end card) on a fixed timeline:
- 0–2 seconds: Hook. The product in action, or the problem it solves. No logo.
- 2–8 seconds: Proof. The main benefit, shown visually, with one short text card.
- 8–16 seconds: Differentiator. One or two things that set you apart from the listings around you, such as a material, a feature, or a use case.
- 16–20 seconds: End card. Brand name and logo, shown clearly.
What usually gets cut
When editors trim a 45-second brand film down to 20 seconds, the same things tend to go:
- Establishing shots. Wide lifestyle scenes that set a mood but don’t show the product.
- Founder or spokesperson segments. These are valuable on your Brand Store or detail page, but weak in a muted autoplay unit.
- Feature lists. Five features in 20 seconds means none of them land. Pick one or two.
- Packaging shots. Unless the unboxing experience is the selling point, the box isn’t what shoppers are deciding on.
Loop-awareness
Shoppers often scroll back up or pause on a results page, so a short video may play more than once in a session. A clean end card that cuts well back to a strong opening frame looks deliberate when it repeats. A video that ends on a fade to black and restarts on a slow intro looks unfinished.
When longer can make sense
The 45-second ceiling exists for a reason. Complex products, like tools with several modes or devices with a setup flow, sometimes need more time to show what they do. If you go longer, front-load even more. The first 20 seconds should still work as a complete ad on their own, with the extra time adding depth for the smaller group who keep watching.
Amazon’s guidance on production quality applies at any length. It says a “polished, high-quality, professionally-produced video is an effective way to convey the quality of your product and instill trust in your brand.” Shaky footage and bad lighting read as a low-quality product, fairly or not.
Product Detail Page vs. Brand Store: Choosing Where the Click Goes
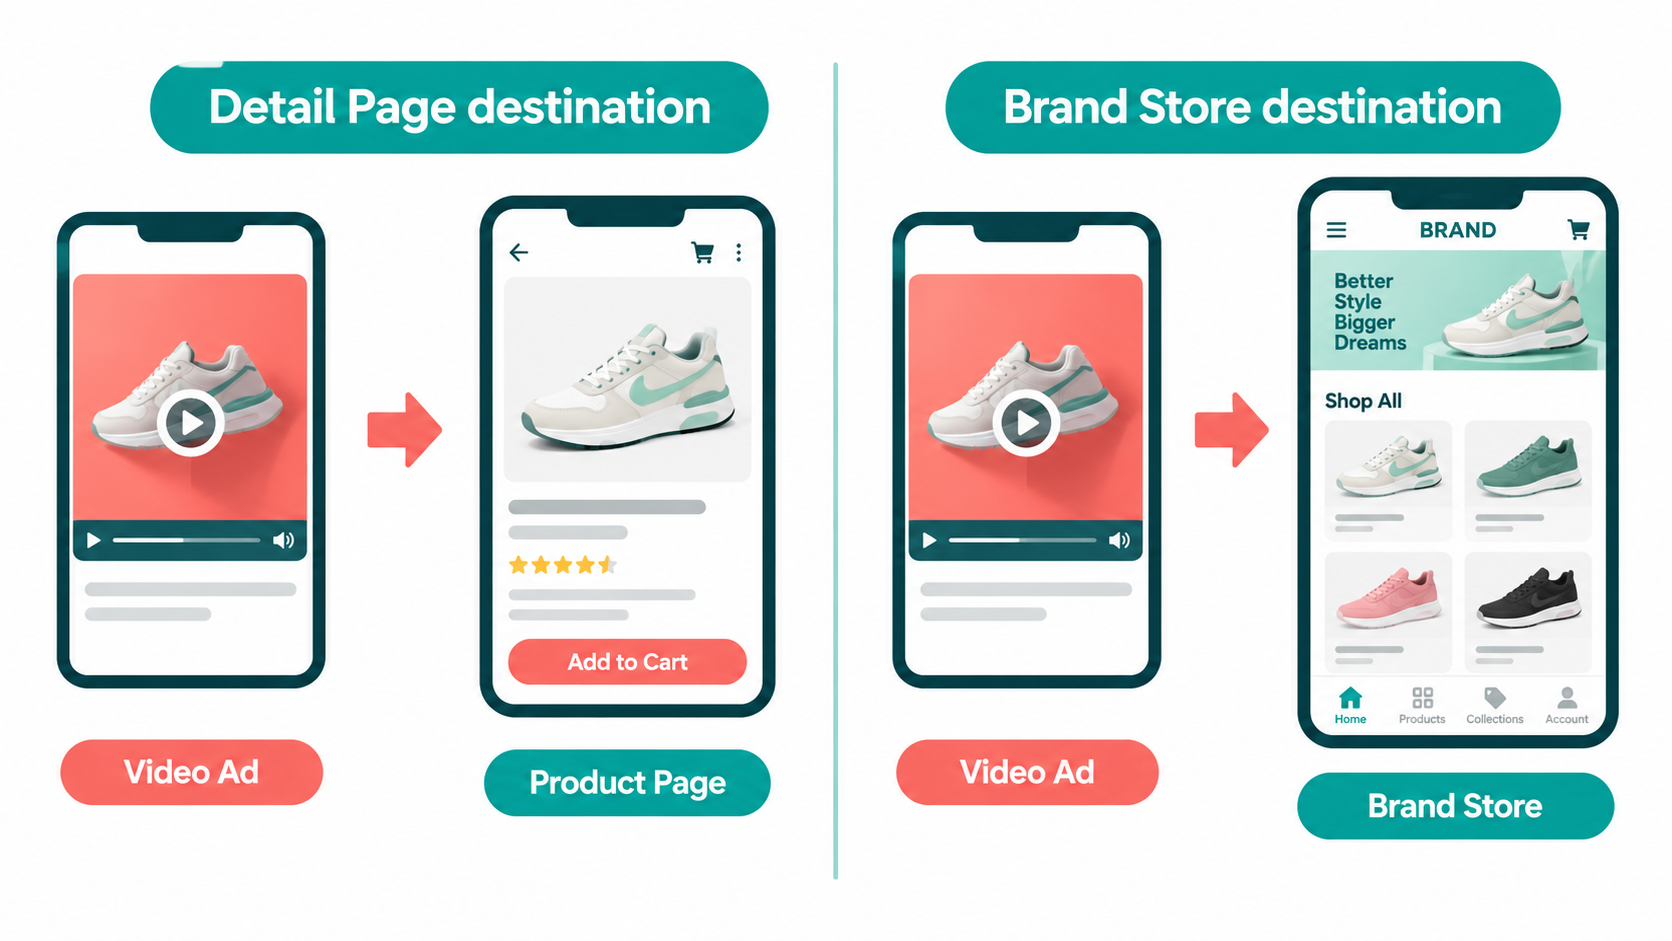
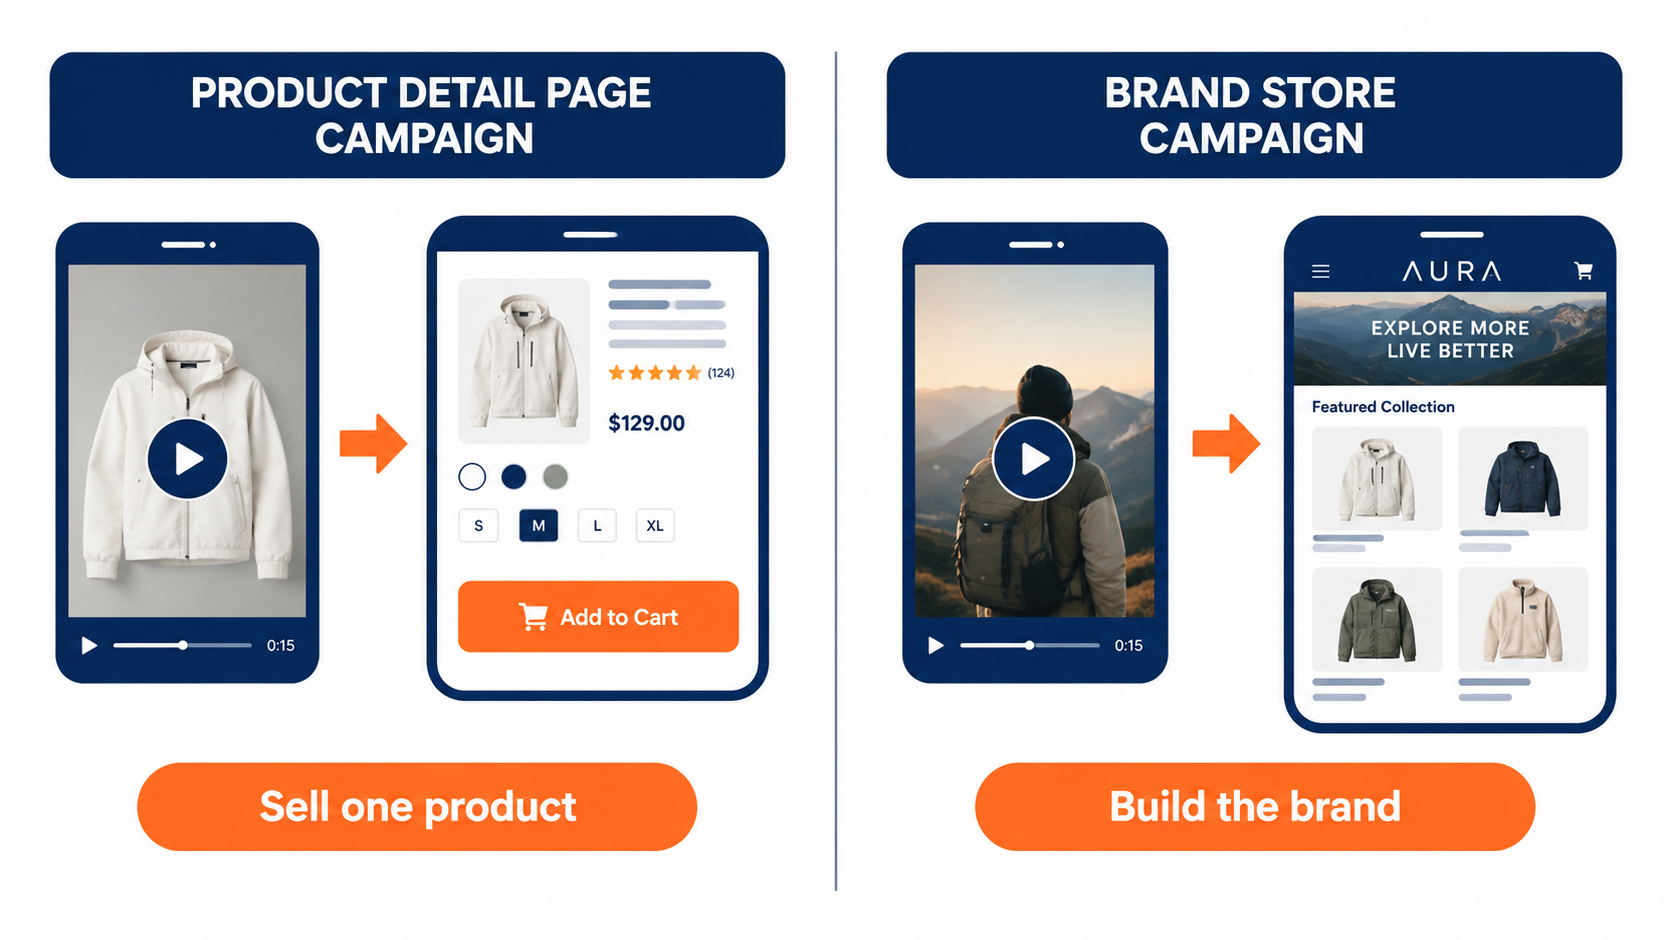
Amazon offers two ways to connect shoppers through Sponsored Brands video. The choice affects what the video should say and how you should judge it.
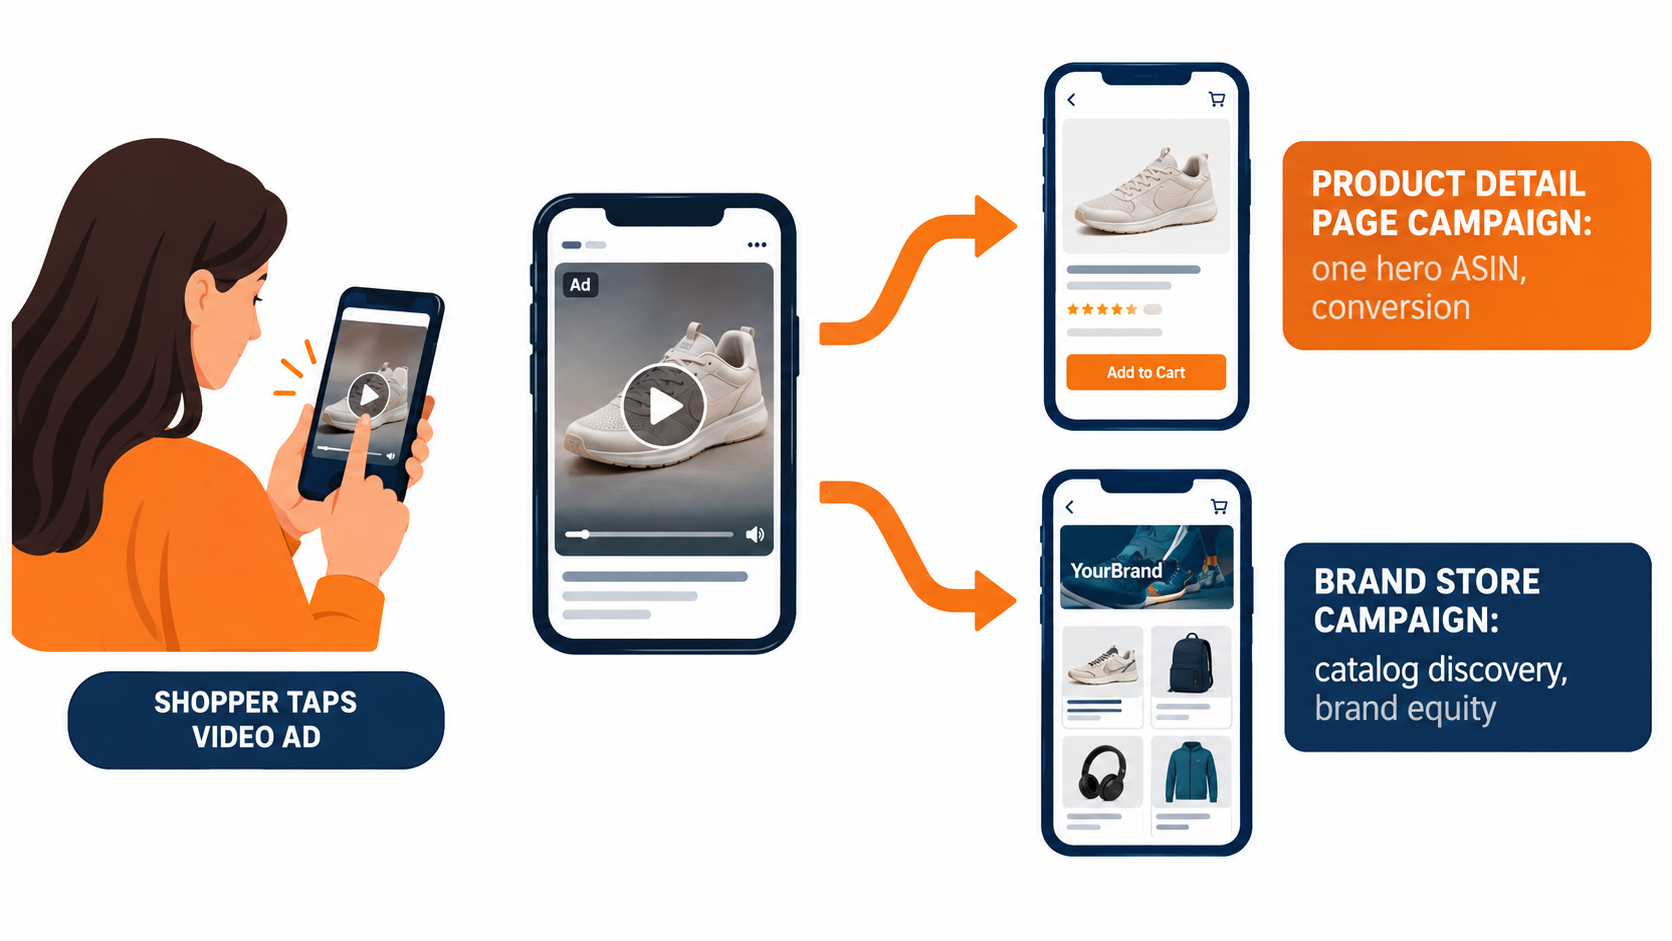
Product Detail Page campaigns
Amazon describes the Product Detail Page campaign as best for connecting shoppers with your product. These campaigns show in shopping results and on detail pages. The click goes straight to one listing.
This is the more direct-response option. The video should focus on one hero product, and everything in it should support that specific listing. The match between what the video promises and what the detail page delivers matters a lot. If the video shows a blue variant and the click lands on a page defaulting to black, you’ve added friction at the worst moment.
Good fit for: hero SKUs with strong reviews, products with a clear visual demo, and campaigns judged mainly on ACoS or ROAS.
Brand Store campaigns
Amazon positions the Brand Store campaign as a way to “increase brand equity and build lasting value” by sending shoppers directly to your Brand Store through shopping results. Amazon notes these can be featured above and below the fold of search results.
The video can be broader here: a product range, a brand promise, or a lifestyle. But the silent-first rules still apply. “Broader” doesn’t mean vaguer. A video that shows three products solving three related problems in 20 seconds can work. A mood piece with no clear product usually doesn’t.
Good fit for: brands with a deep catalog, product lines where shoppers often buy several items, and campaigns judged on new-to-brand customers or long-term value instead of immediate ROAS.
Your Brand Store has to be ready
Amazon’s Sponsored Brands overview says that paired with Brand Stores, the format “drives discovery, consideration, and long-term engagement with your brand.” That pairing only works if the Store is worth landing on. Before you send paid video traffic to a Store, check that:
- The landing page matches the video’s theme. A video about travel accessories should land on a travel page, not the Store homepage.
- The page loads with clear navigation and visible products above the fold on mobile.
- Top sellers are easy to find, with prices and ratings showing.
Measure them differently
Comparing a Brand Store video campaign to a Product Detail Page campaign on ACoS alone will almost always favor the detail page campaign. That doesn’t make the Store campaign a failure. It’s doing a different job. Set separate goals for each before launch so budget decisions don’t end up penalizing the campaign meant for brand building.
Targeting Strategy for Video: Keywords, Products, and Intent
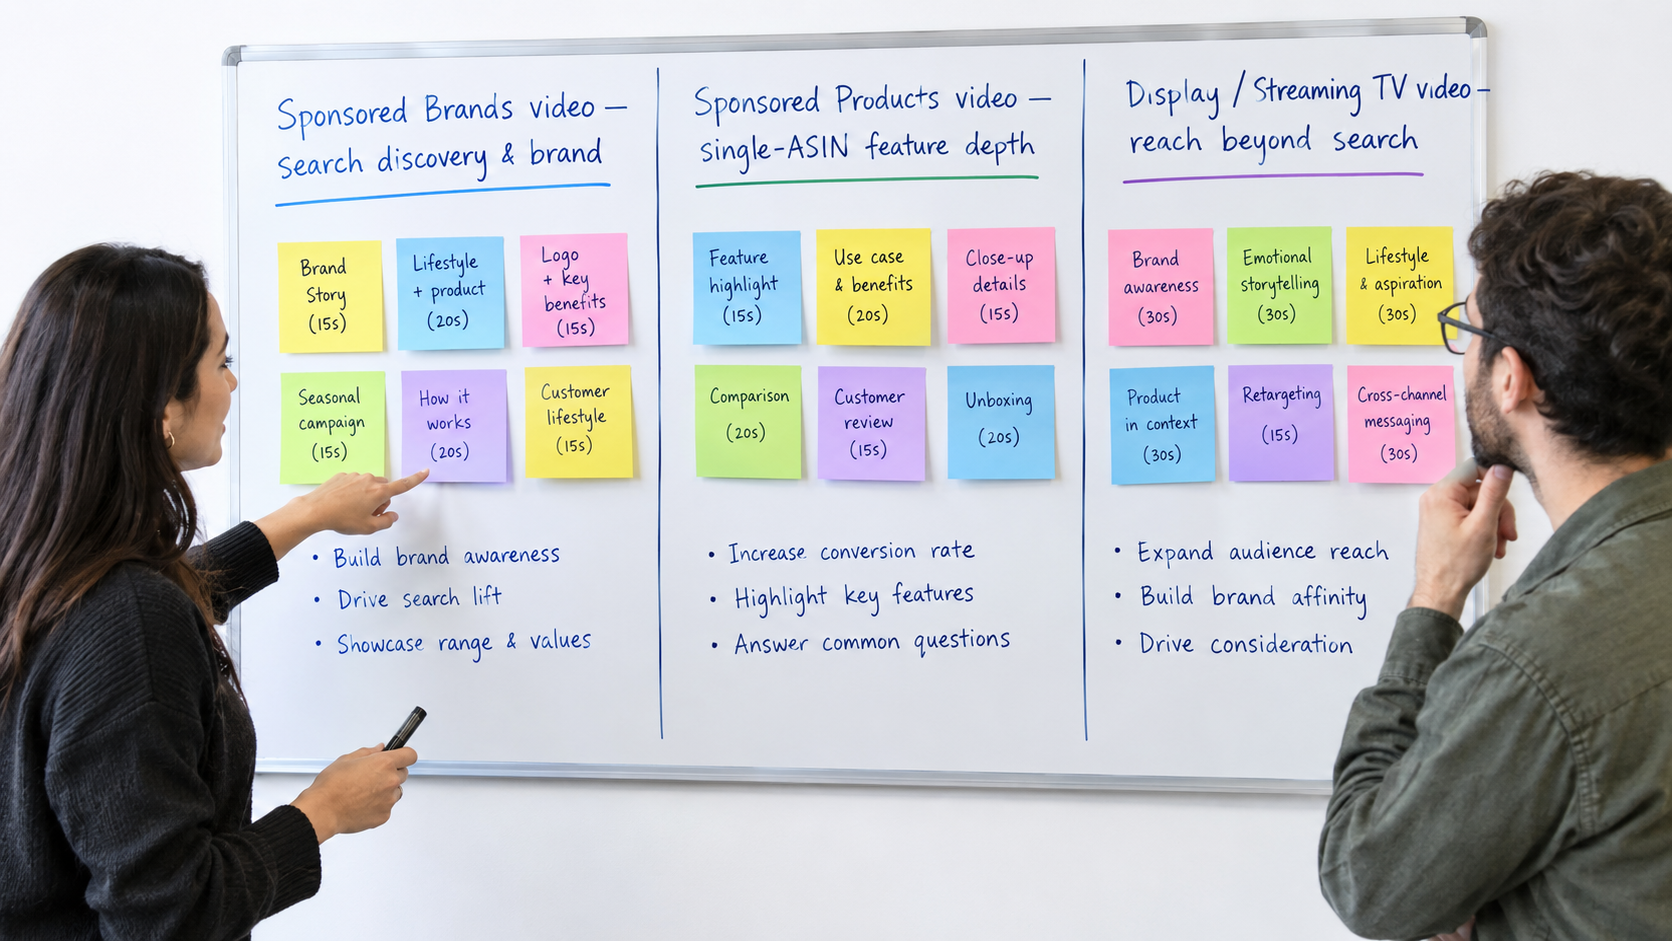
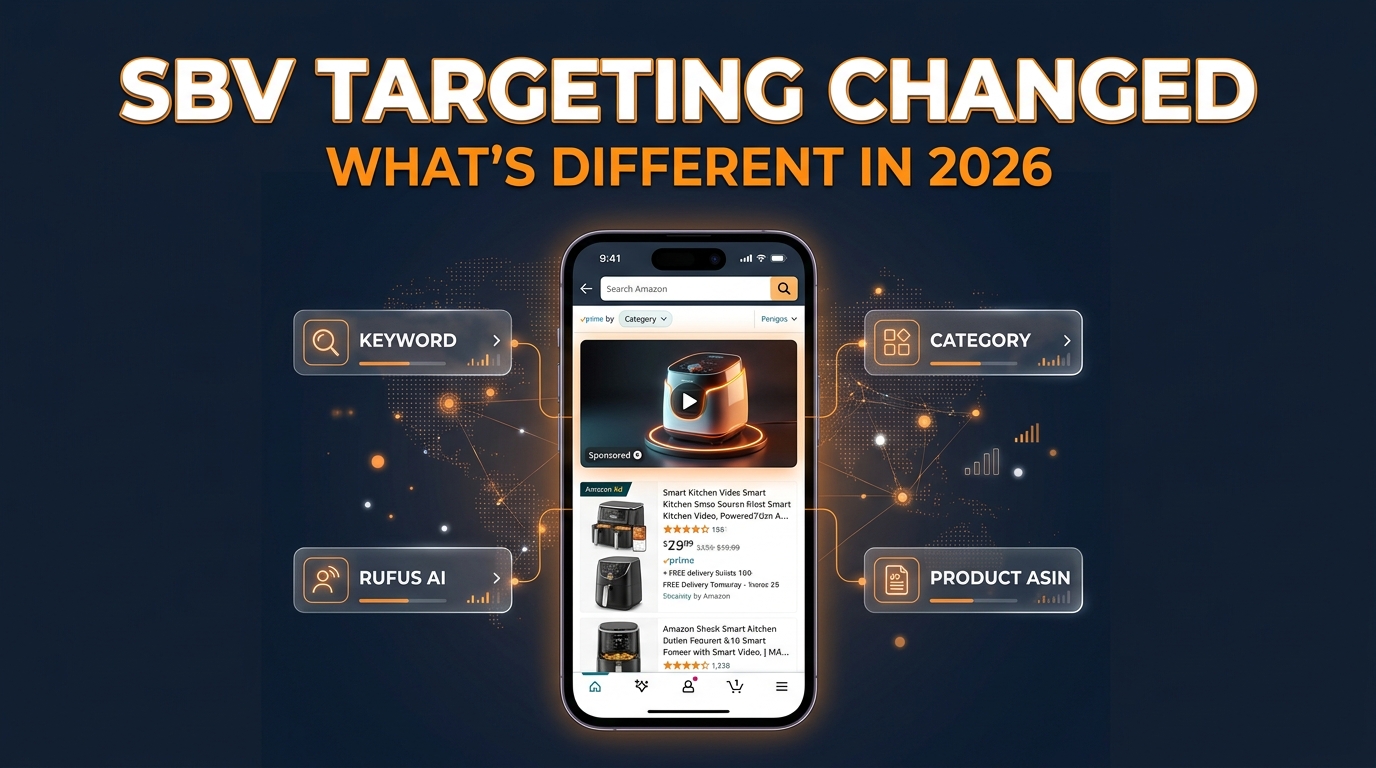
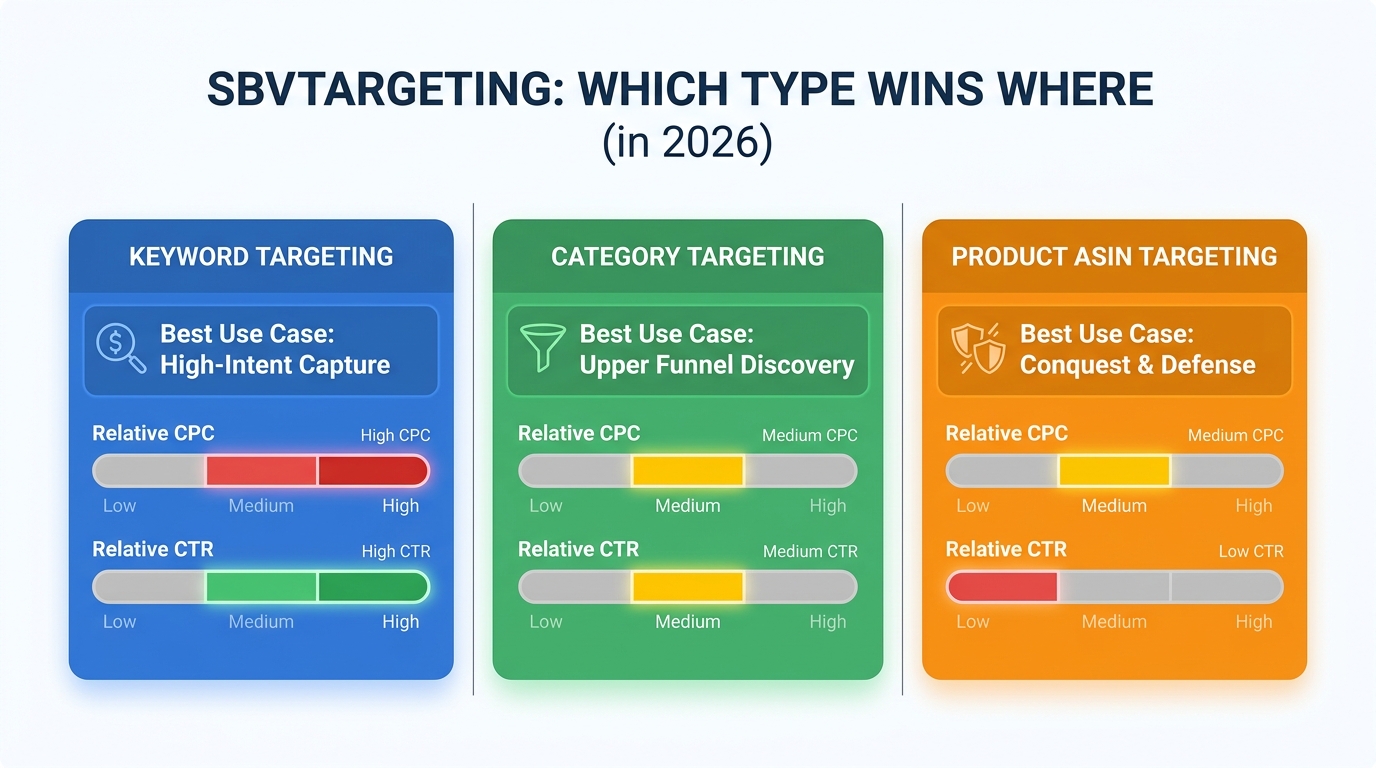
Amazon says Sponsored Brands video can target shoppers through keywords, categories, and products. The overview also mentions reaching relevant shoppers “through precise keyword and product targeting.” How you split those options should depend on what the video is built to do.
Keyword targeting: match the creative to the query
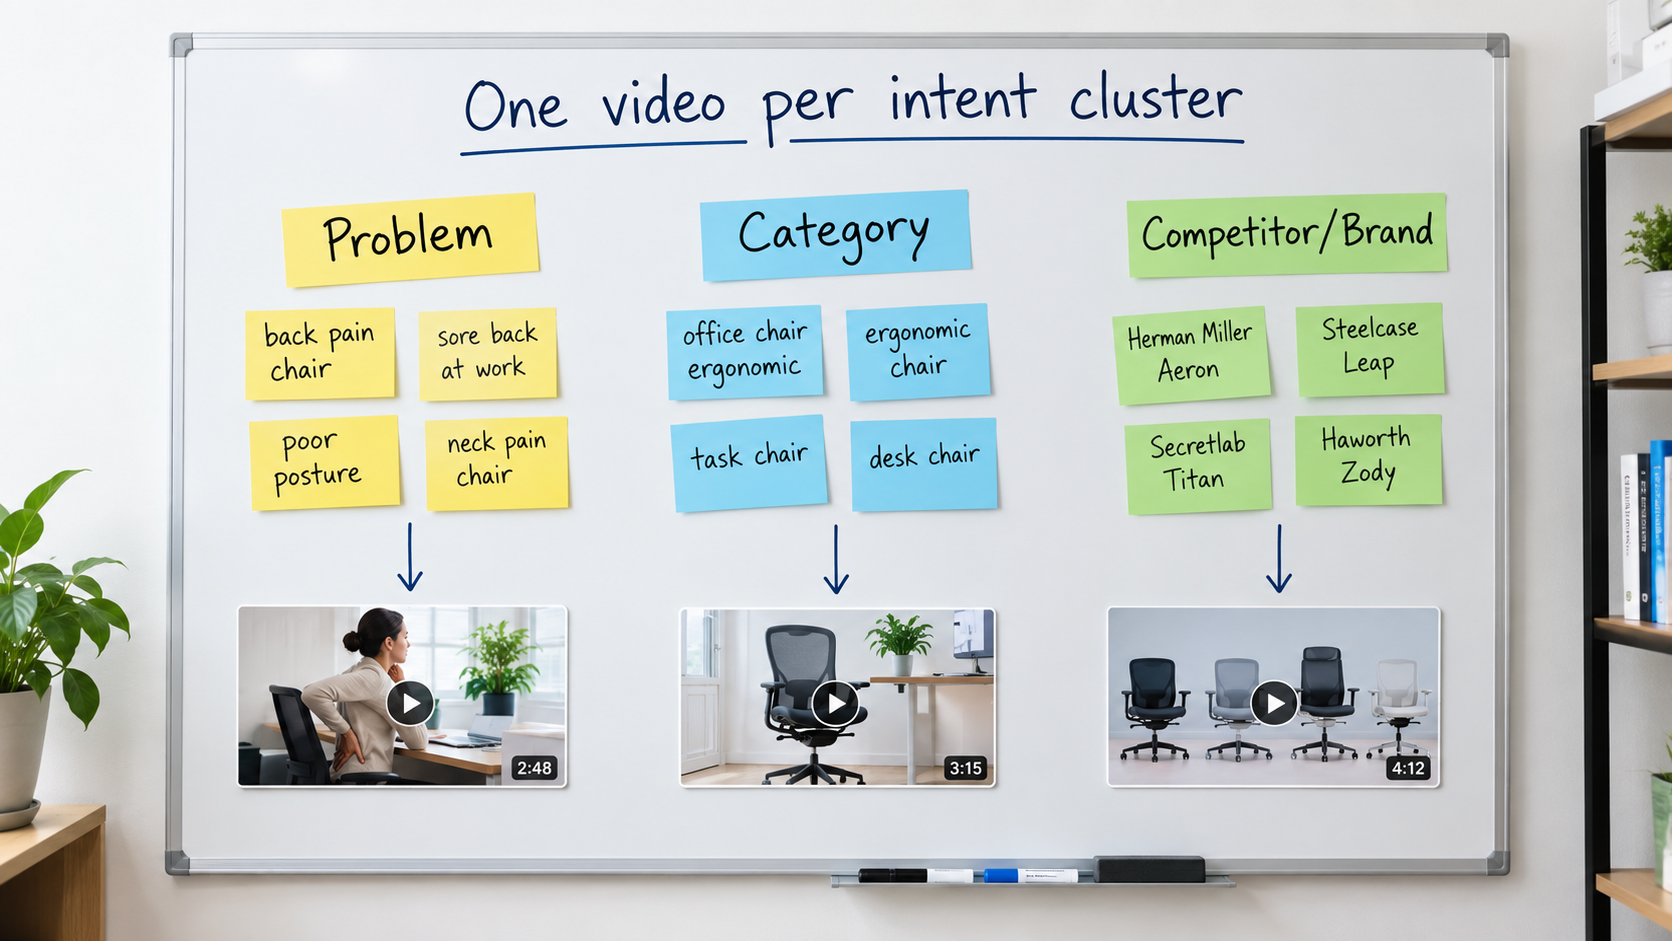
Keyword targeting puts your video in front of shoppers who just told you what they want. That’s the best case for intent-matched openers. Group keywords by intent, not just by product:
- Use-case clusters (“blender for smoothies,” “blender for crushing ice”): each cluster gets an opener showing that exact use.
- Problem clusters (“leak proof lunch box,” “lunch box that keeps food hot”): open on the problem being solved.
- Branded and category head terms: broader brand-plus-product creative tends to fit better here.
Even two or three intent-specific versions of one video give you a cleaner signal than one video spread across every term.
Product targeting: winning a comparison
When video runs on or around competitor detail pages through product or category targeting, the shopper is already looking at someone else’s product. Your video is a comparison whether you planned it that way or not. Creative built for this placement should make your difference obvious: a feature the competitor lacks, a material that looks better, a size or capacity advantage you can show.
Be careful with direct comparison claims. They have to be accurate, supportable, and within Amazon’s ad policies. Showing what your product does is usually safer and works better than naming what a competitor doesn’t do.
Defending your own listings
Targeting your own product pages with video is a common defensive move. It fills placements that a competitor might otherwise take. Creative here can push shoppers toward upgrades, bundles, or related products in your line instead of repeating what they already know about the page they’re on.
Placement visibility options
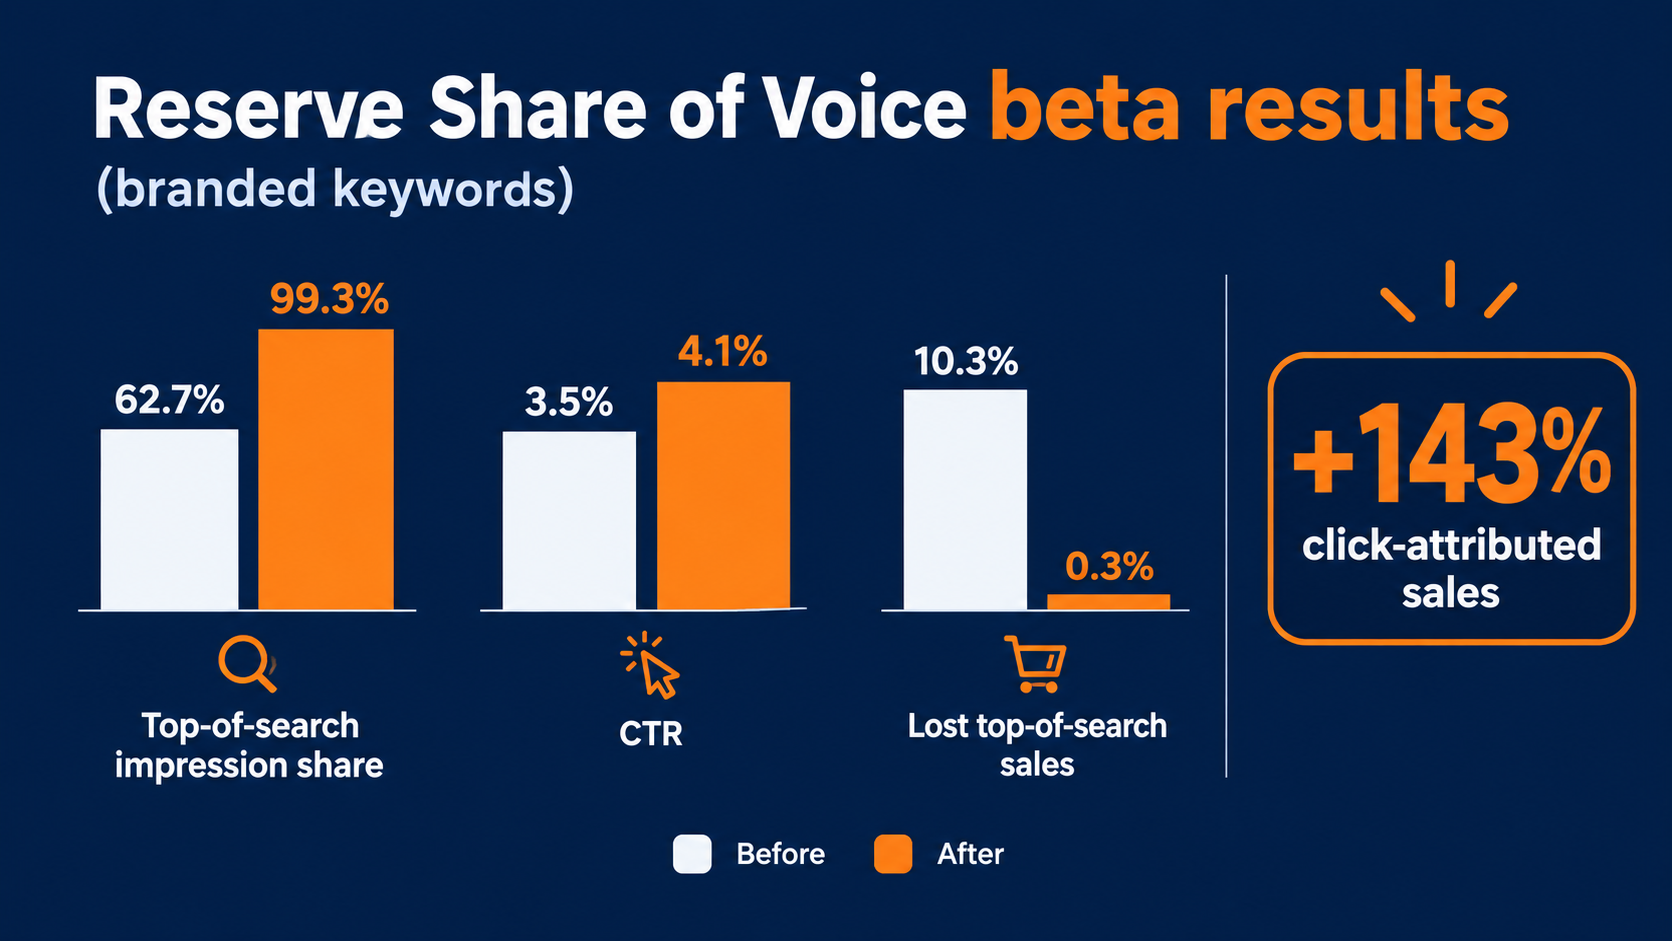
Amazon also offers Sponsored Brands reserve share of voice, which its resources describe as a way “to secure top-of-search visibility and strengthen your brand presence.” For brands with a product launch, seasonal peak, or a period where top-of-search presence really matters, it’s worth checking whether that option is available in your account and how it fits with your video creative.
The Metrics That Tell You Whether the Video Is Working
Many sellers judge Sponsored Brands video the same way they judge Sponsored Products: clicks, spend, sales, ACoS. Those numbers matter, but they can’t tell you why a video is underperforming. For that, you need the video-specific engagement metrics in Sponsored Brands reporting. Amazon Ads offers dedicated reporting courses for Sponsored Brands, and those reports include video-specific fields.
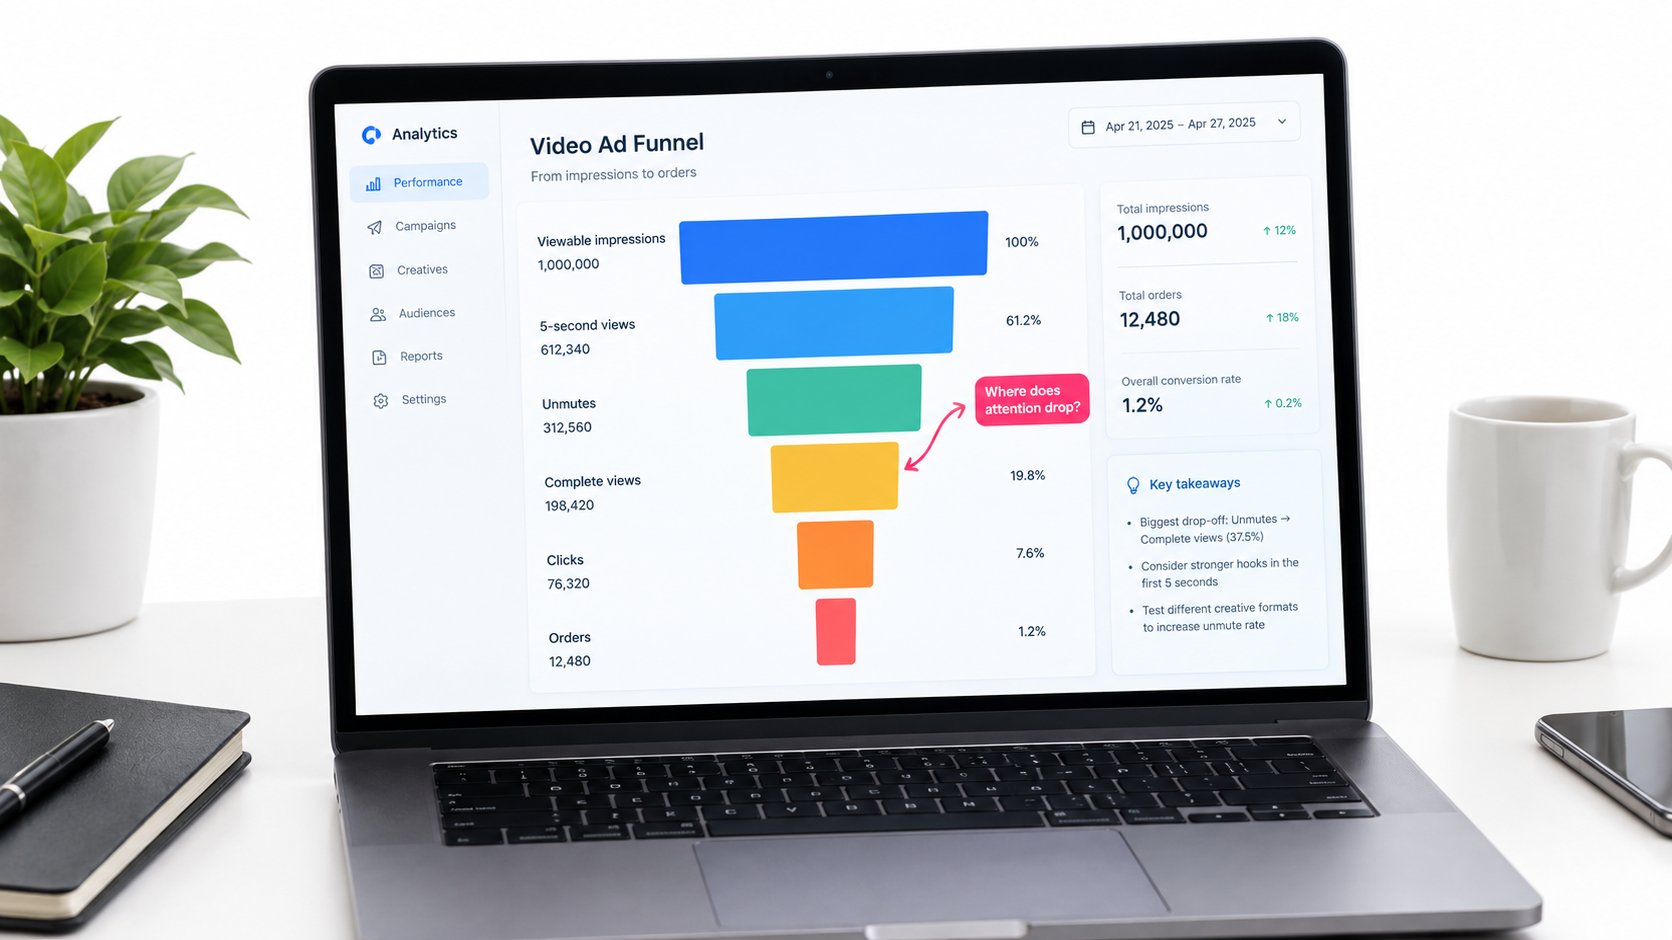
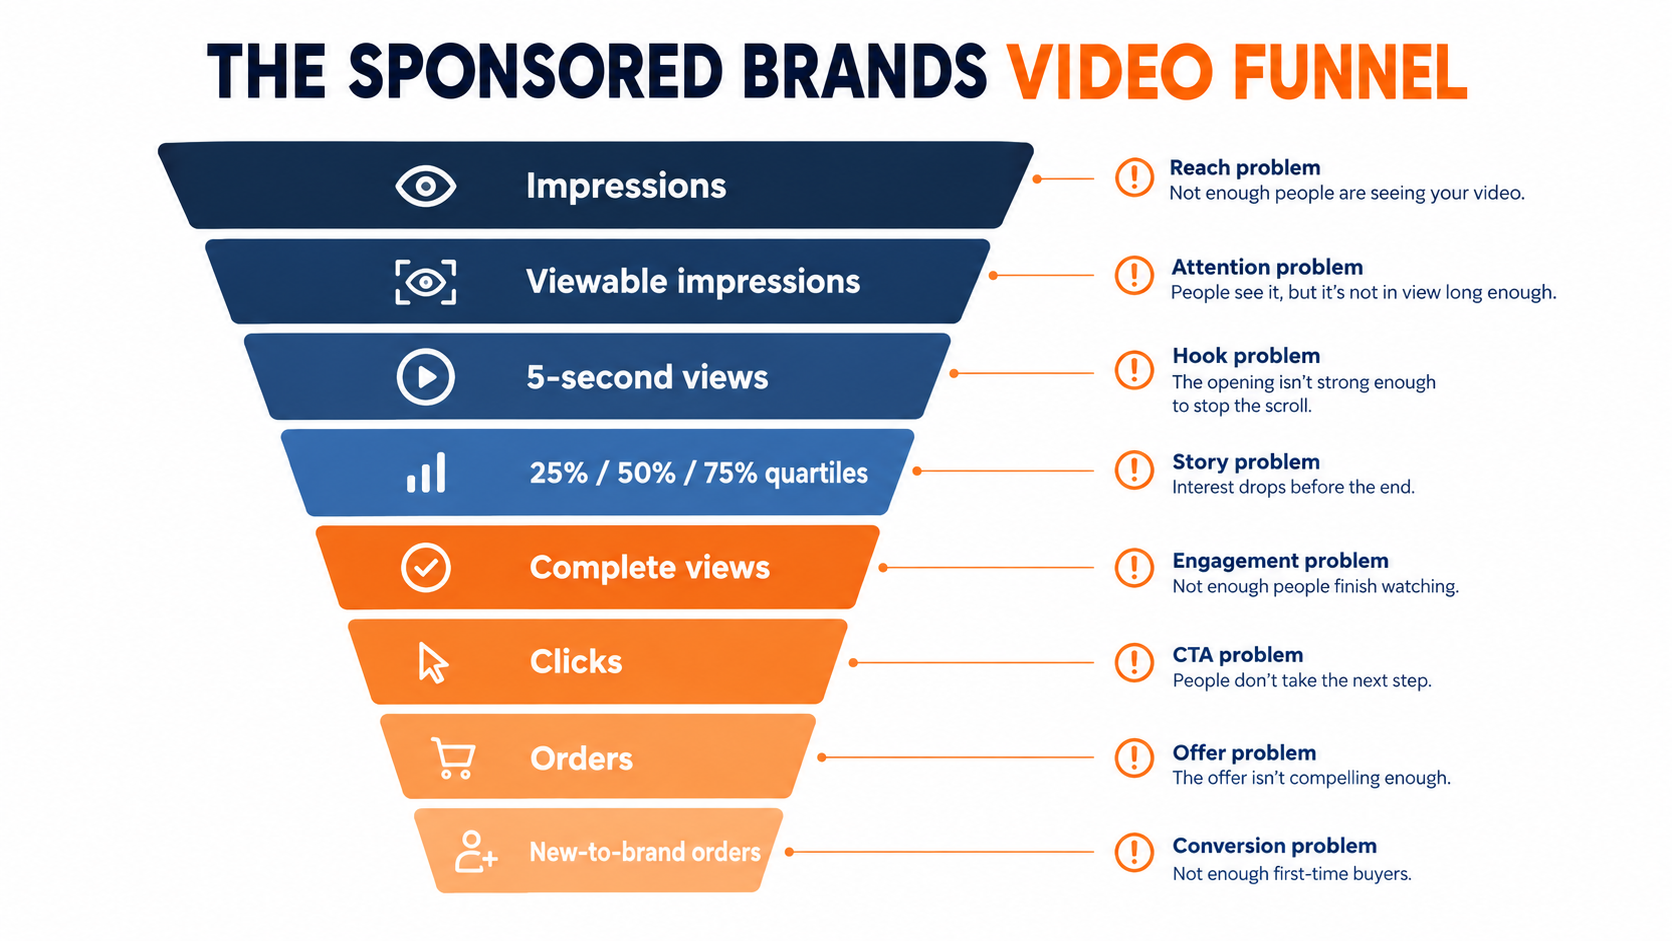
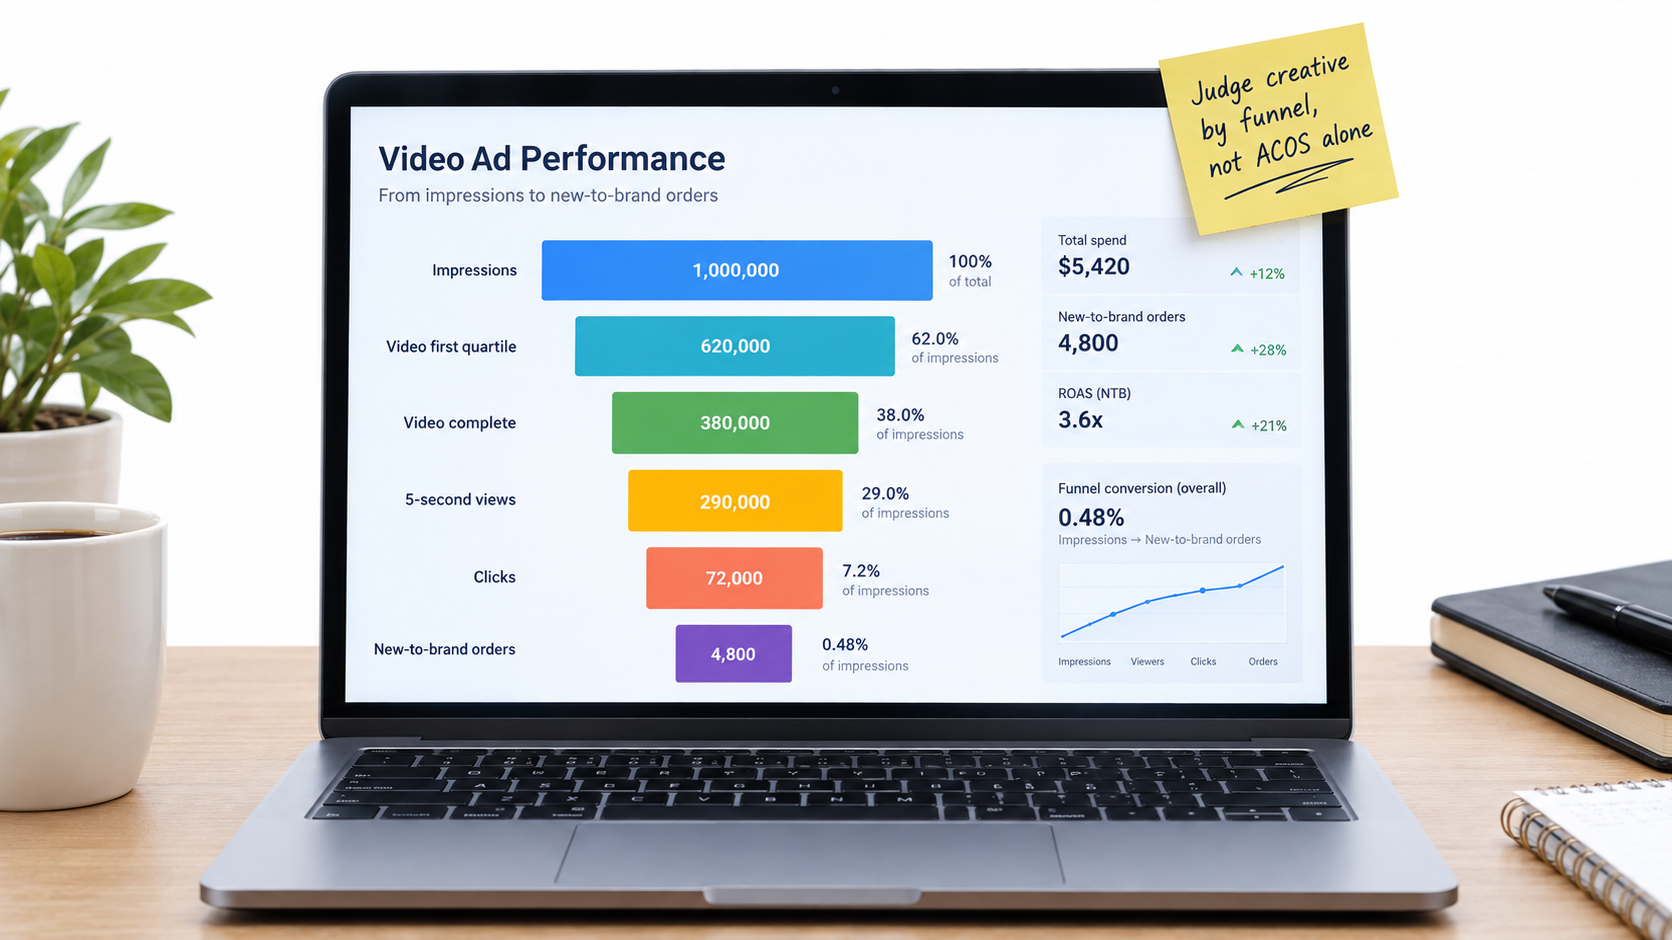
Read the video as a funnel
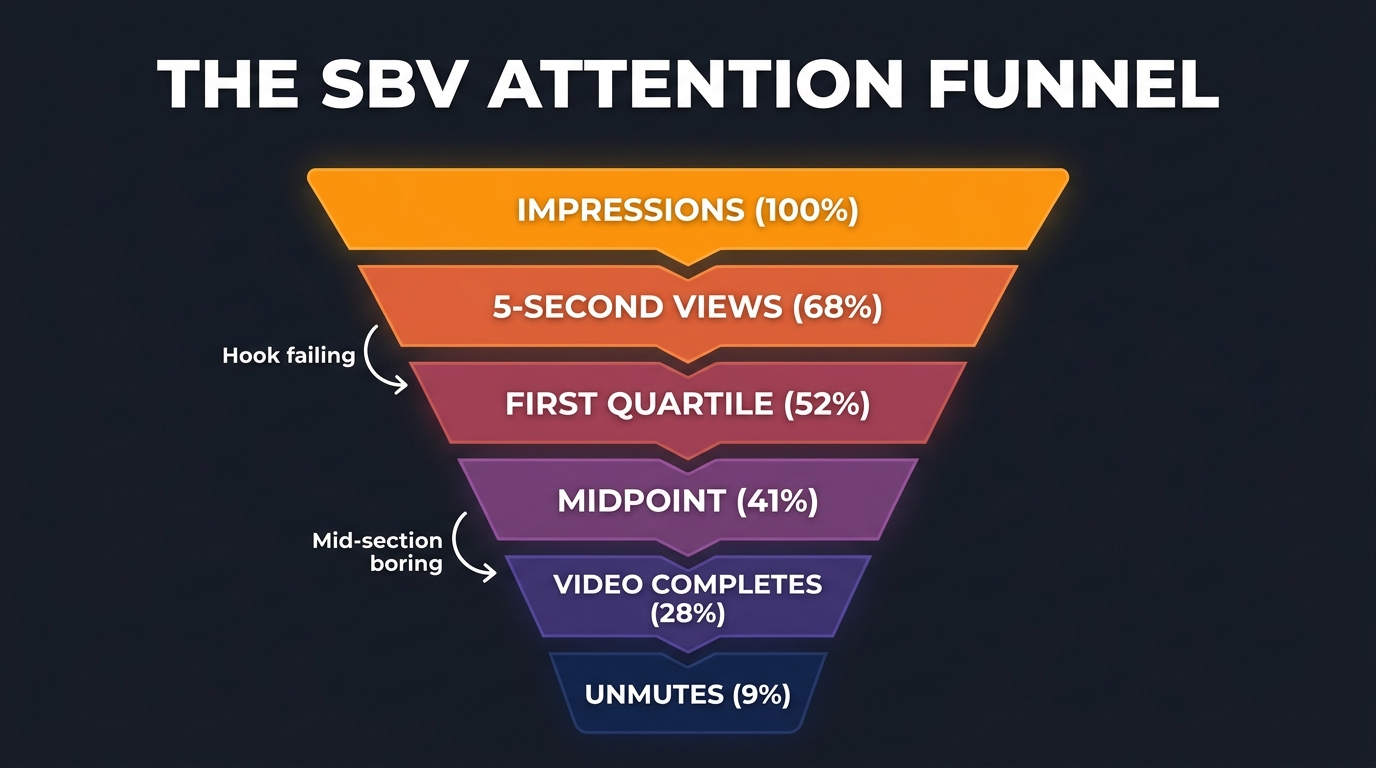
Video reporting in Sponsored Brands typically includes fields such as viewable impressions, video quartile completions (first quartile, midpoint, third quartile, complete), 5-second views, and unmutes. Field names and availability can change, so check your current report templates in the console. Read together, they form a funnel:
- Viewable impressions: did the video actually get on screen?
- 5-second views / early quartile: did the opener hold attention?
- Midpoint and complete views: did the middle of the video keep people watching?
- Unmutes: was anyone interested enough to turn on sound?
- Clicks: did the video earn a visit?
- Orders and sales: did the landing page convert the visit?
Diagnosing by where the drop happens
The value of this funnel is that each drop-off points to a different fix:
- Weak early retention: The opening isn’t working. Test a new first two seconds before touching anything else.
- Good early retention, steep drop by midpoint: The hook works but the middle drags. Tighten the edit or move the differentiator earlier.
- Strong views, low clicks: The video entertains but doesn’t motivate. Check the headline and CTA, and make sure the video creates curiosity instead of answering every question.
- Healthy clicks, poor conversion: The problem is probably the landing page, the price, the reviews, or a mismatch between what the video promised and what the page shows. Not the video.
- Almost no unmutes: That’s normal and expected. It confirms you should keep building for silence.
Beyond last-click
Amazon describes Sponsored Brands as supporting brand growth “across the shopping journey” and highlights the ability to understand “how and which shoppers engage with your ads.” If you have access to new-to-brand metrics, use them, especially for Brand Store campaigns. A video that brings in a high share of first-time customers can justify a higher ACoS than a video that mostly reaches people who would have bought anyway.
A Testing Framework That Produces Real Answers
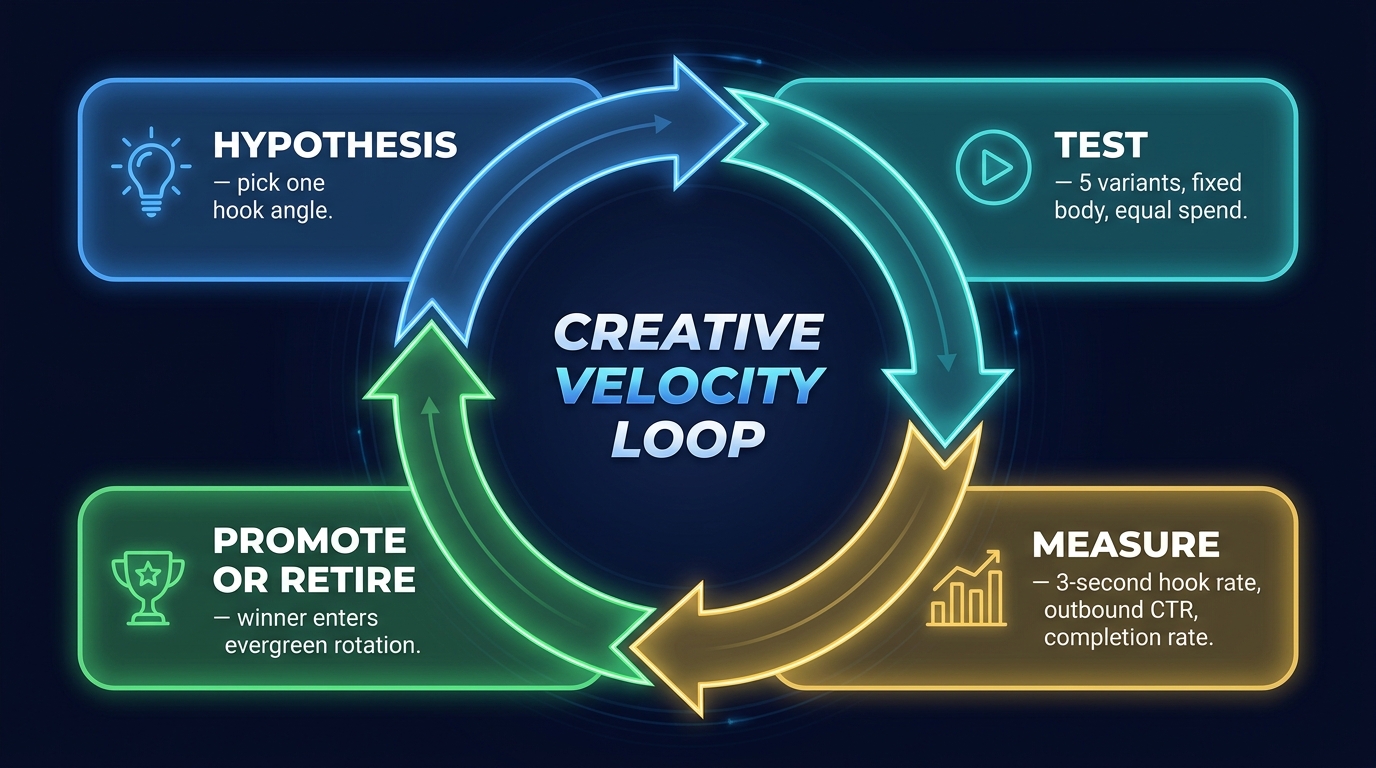
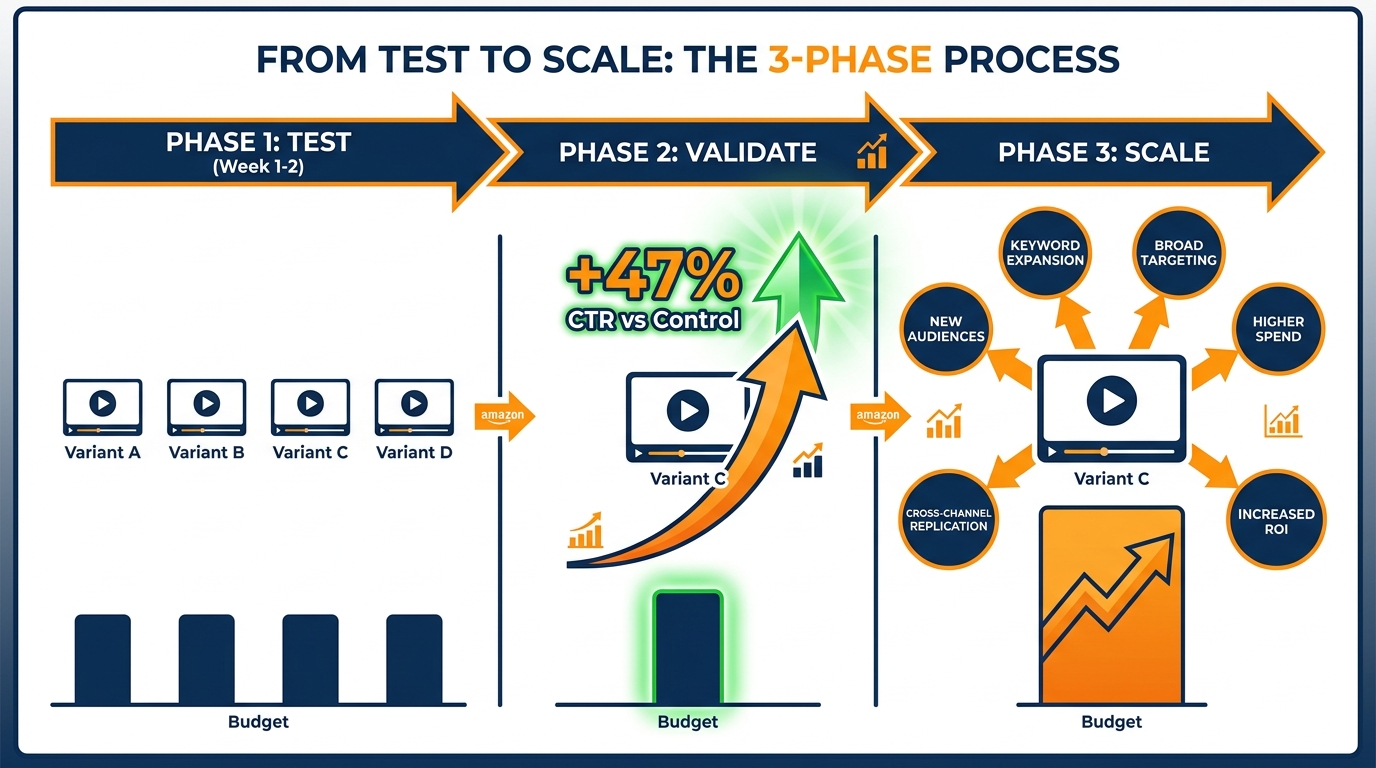
Video testing on Amazon often turns into “we swapped the video and sales went up (or down).” With seasonality, bid changes, competitor moves, and listing edits all happening at once, that tells you very little. A more disciplined approach gives you lessons you can carry from one product to the next.
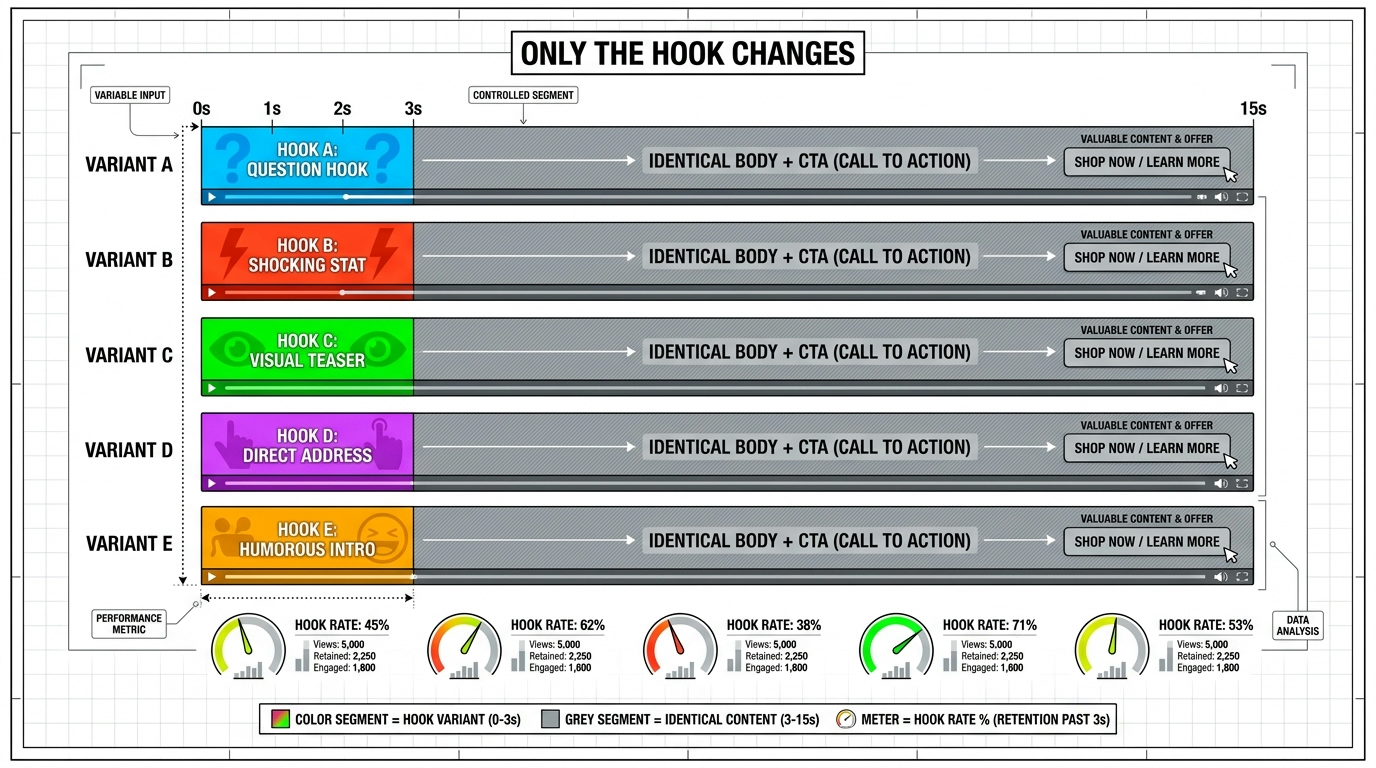
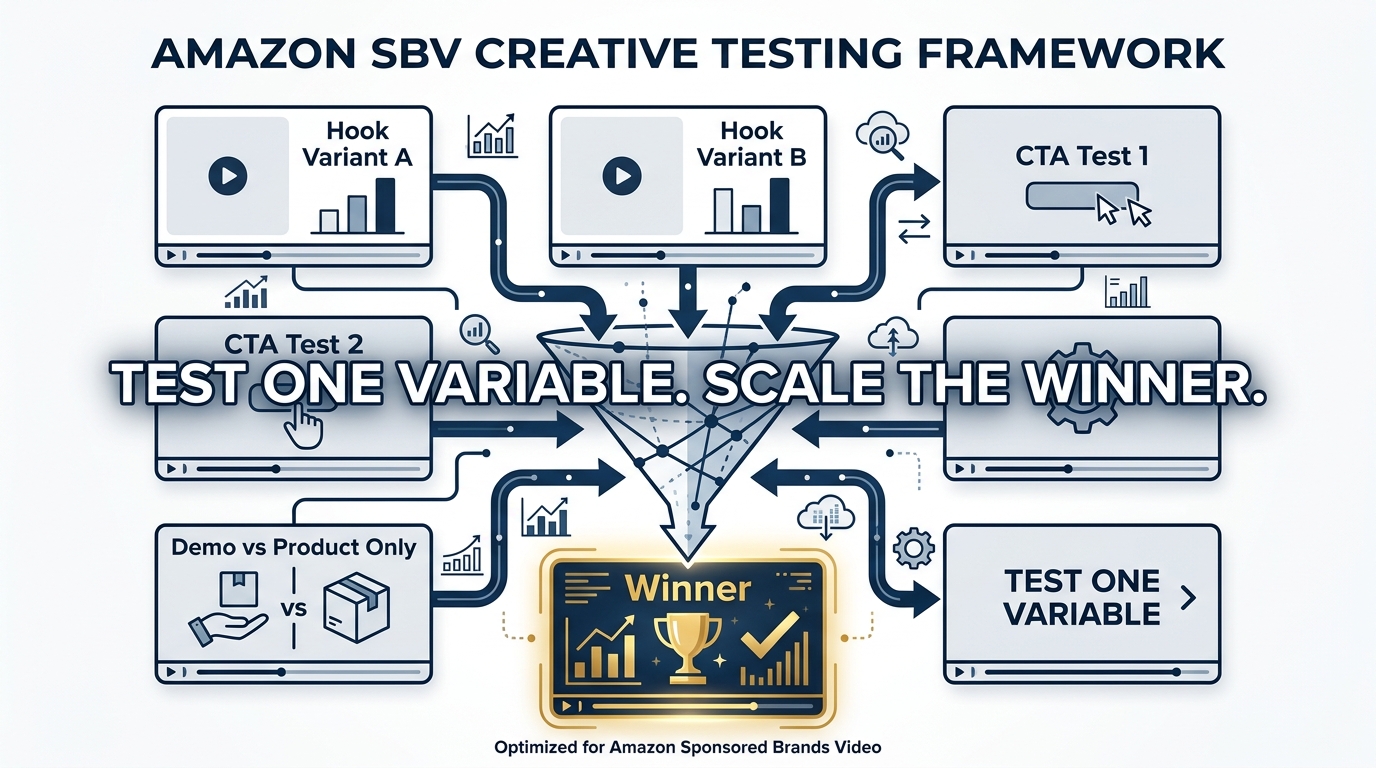
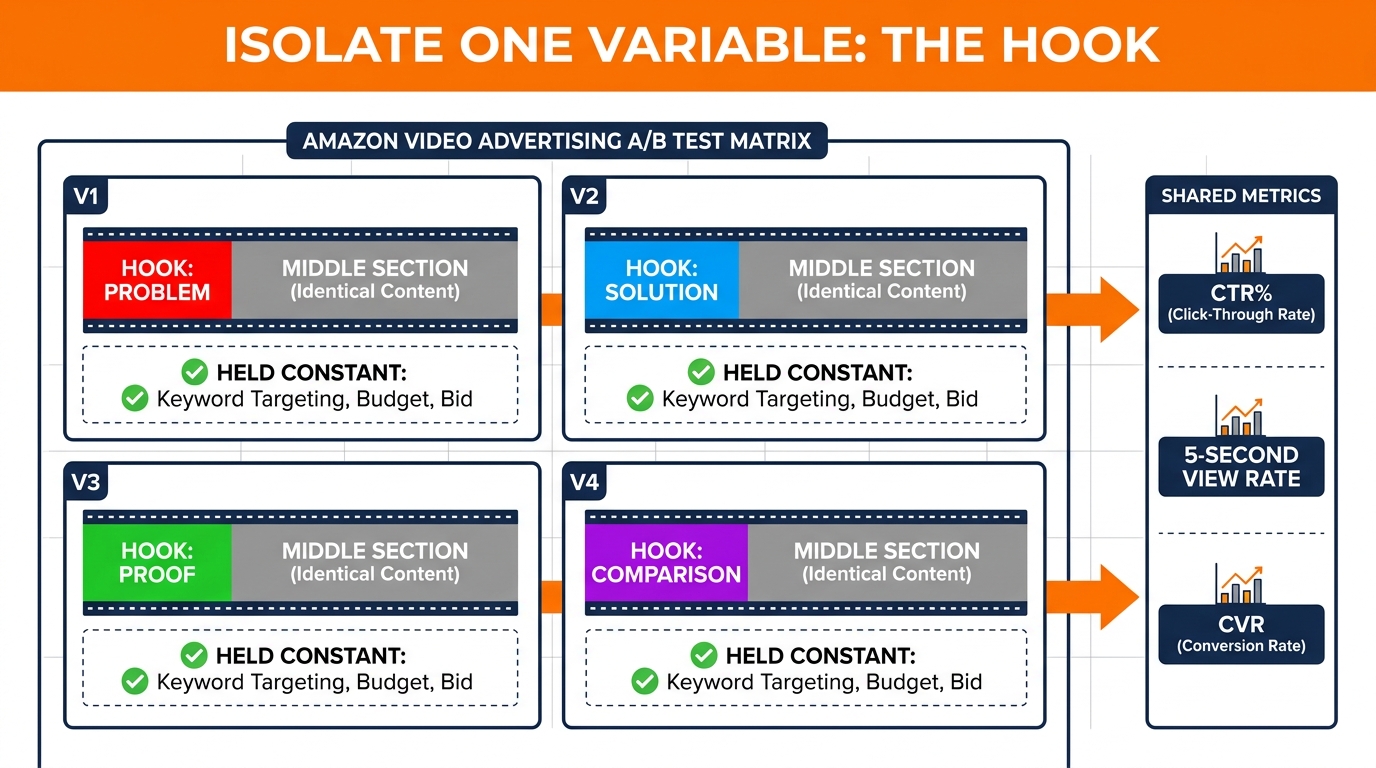
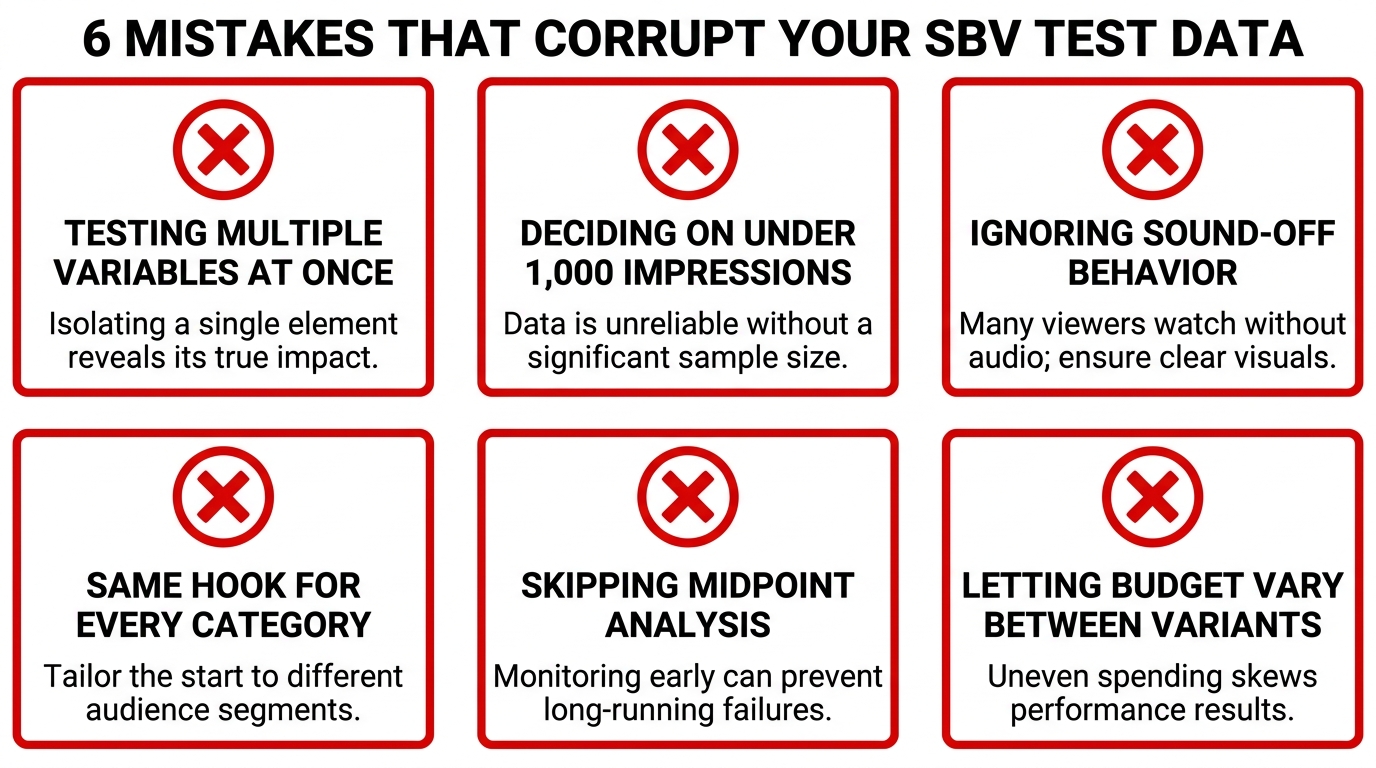
Test one variable at a time
Rank your variables by likely impact and test in that order:
- The opener (first two to three seconds). This is usually where the biggest swing in early retention comes from.
- The headline text in the ad unit.
- The main benefit shown in the proof section.
- Length, for example 15 seconds vs. 30 seconds.
- Landing destination: Product Detail Page vs. Brand Store.
Change the opener and the headline at the same time and you won’t know which one moved the numbers.
Keep the conditions equal
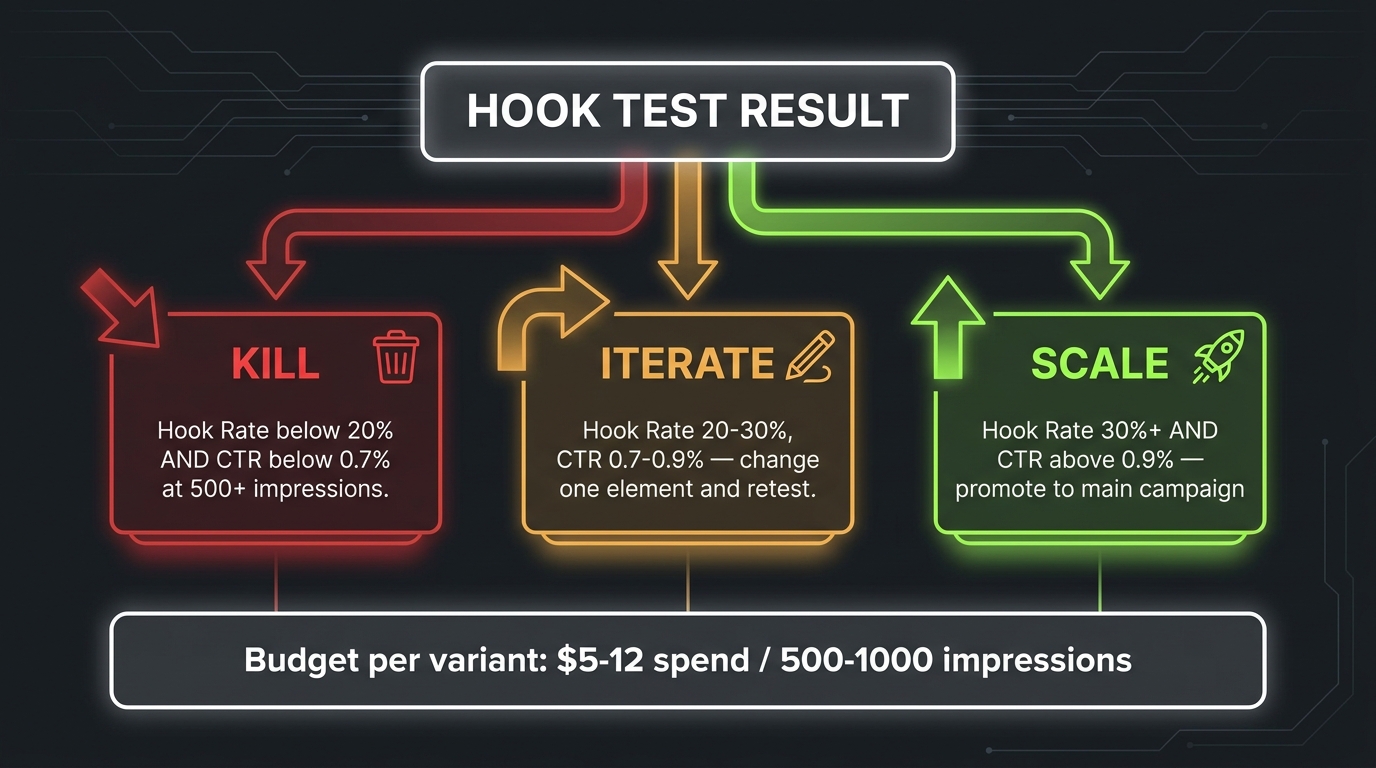
Run versions at the same time, not one after another, so seasonality and competitor changes affect both equally. Use the same keyword set, similar bids, and similar budgets. Give each version enough impressions and clicks that the difference isn’t noise. That threshold depends on your traffic, but a handful of clicks isn’t a result.
Build a modular asset library
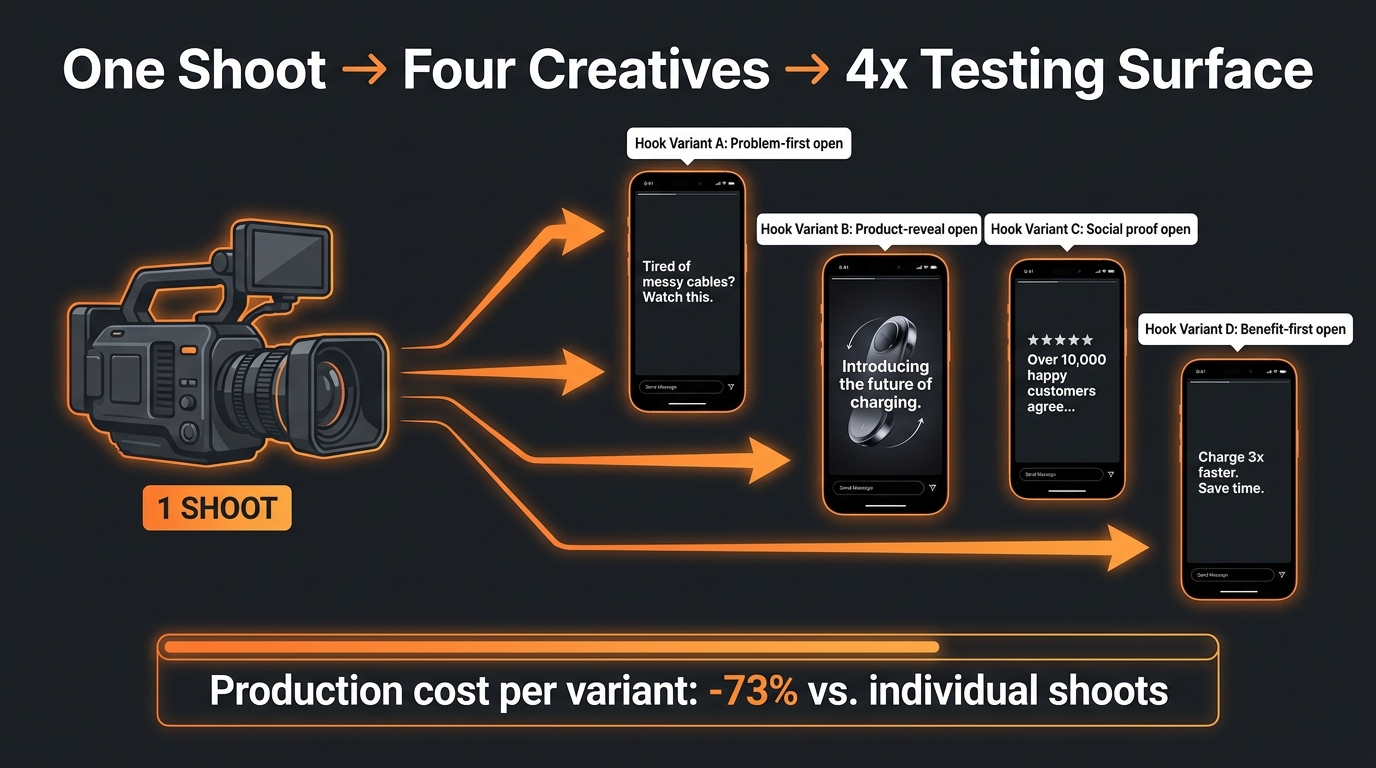
The cheapest way to test openers is to shoot for modularity from the start. At the shoot, capture:
- Several different two-to-three-second hook clips (mid-action, problem, outcome).
- A core proof sequence that can follow any hook.
- Horizontal framing for everything, so 16:9 is native and not a crop.
- A clean end card in each marketplace language you sell in.
With that library, a new test variant is an editing job of minutes, not a new production.
Use Amazon’s free creative tools carefully
Amazon’s Sponsored Brands overview notes that advertisers can “use AI-powered image generation at no cost to produce branded creatives.” Tools like this can help small brands produce more variants for testing, especially for image-based Sponsored Brands creative that runs alongside video. Treat the generated assets the way you’d treat any creative: check them against your brand standards, the product’s actual appearance, and Amazon’s policies before they go live.
Write down what you learn
Keep a simple log of each test: hypothesis, variable, date range, results, and conclusion. After a few months you’ll have category-specific knowledge, such as “problem-first openers beat outcome-first for our kitchen line,” that no general blog post can give you.
What the Published Case Studies Do (and Don’t) Tell You
Amazon publishes case studies for Sponsored Brands. They’re useful, but it helps to read them closely and know what they show and what they leave out.
HP: video as part of a full-funnel mix
Amazon’s Sponsored Brands page features HP, which used Sponsored Brands video along with Sponsored Brands, Sponsored Products, and display ads to expand its reach globally. The reported results: impressions grew 224% year over year, clicks rose 142% year over year, and there was a 42% increase in clicks for Sponsored Brands video placements.
The takeaway isn’t that video alone drove those numbers. HP ran video as one part of a coordinated mix. Video placements added clicks while the other ad types did their own jobs. For most brands, that’s the realistic model: Sponsored Brands video works best alongside Sponsored Products coverage, not in place of it.
Loftie: a small business with efficient returns
Amazon also highlights Loftie, a small business that worked with Amazon Ads on a sponsored ads campaign in 2022. The reported results were a return on ad spend of $5.66 and an advertising cost of sale of 17.68%. The case study is framed around sponsored ads broadly, not video specifically, so don’t read those figures as a video benchmark. What it does show is that brands without enterprise budgets can run efficient sponsored campaigns when the creative and the product fit.
NF Imports: brand-building over time
A third case on the same page describes NF Imports, a brand in Japan that started sponsored ads in 2015 and built its brand with Sponsored Brands. Amazon reports that 80% of its sales came from new customers between March 2018 and December 2022, with 30% sales growth between December 2019 and November 2022. The time frames stand out. These are results built over years, which supports treating Sponsored Brands, including video, as a long-term brand investment and not a quick ROAS fix.
How to use case studies responsibly
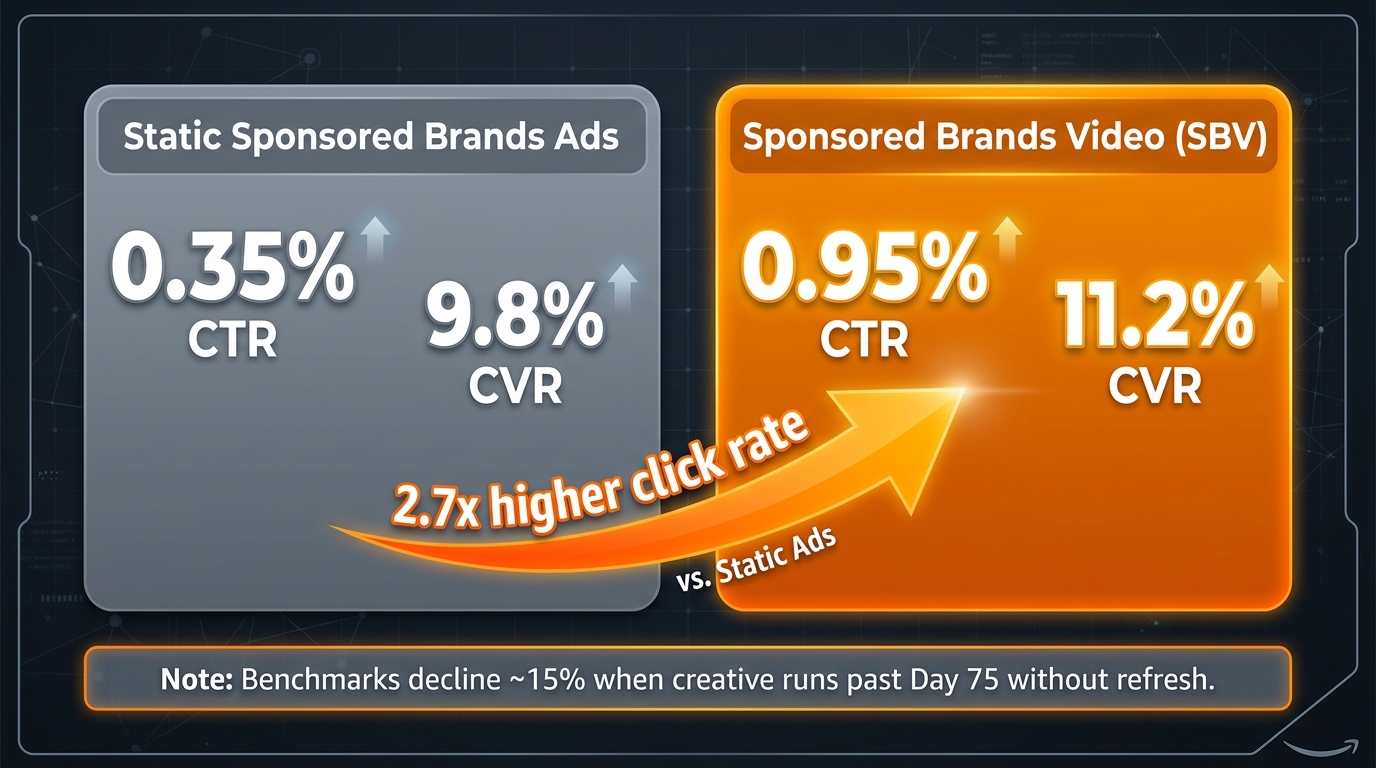
- Don’t treat them as benchmarks. Results depend on category, price point, brand strength, and competition.
- Look at the mix. Most successful examples combine several ad types.
- Notice the time frames. Brand-building results take time to build up.
- Set your own baseline. Your first 60 to 90 days of video data is the benchmark that actually matters for you.
Seven Failure Modes to Fix This Week
If your Sponsored Brands video campaigns are underperforming, the cause is very often one of these. Each one maps back to how the ad unit works.
1. The video needs sound to make sense
Voiceover-led creative in a muted-by-default unit. Fix: Run the silent-first test and rebuild the story with visuals and on-screen text.
2. The logo opens the video
Brand identity comes before relevance. Fix: Follow Amazon’s own guidance. Product first, brand and logo later, end card last.
3. Repurposed vertical footage with bars
A 9:16 social clip padded into 16:9. Fix: Reframe or reshoot horizontally. Amazon says to avoid black, colored, or blurred bars.
4. Key text in the lower-right corner
Claims or CTAs hidden under the mute toggle. Fix: Use Amazon’s safe-area template and build it into your editing presets.
5. Too long, too dense
A 40-second feature tour. Fix: Cut to 20 seconds or less, as Amazon recommends, and focus on one or two benefits. Let the detail page do the explaining.
6. One video for every keyword
Generic creative across very different search intents. Fix: Group keywords by intent and swap in matching openers and headlines.
7. Judging every campaign on ACoS alone
Brand Store campaigns paused for “poor performance” when they were built for a different goal. Fix: Set separate goals for Product Detail Page and Brand Store campaigns, and read the video engagement funnel before making cuts.
Conclusion: Build for the Unit, Not the Brief
Sponsored Brands video isn’t hard because video production is hard. It’s hard because the ad unit has specific rules, and most creative is made without them in mind. Amazon’s specs spell those rules out: autoplay at 50% visibility, muted by default, 16:9 only, no bars, keep the lower-right corner clear, 6 to 45 seconds with 20 or less recommended, and language matched to the marketplace. Every one of those details should shape the creative.
Brands that do well with this format usually aren’t the ones with the biggest production budgets. They’re the ones that accept how shoppers actually see the ad (fast, silent, mid-scroll, right next to their own listing data) and build for that.
Your action checklist
- Audit every live video with the sound off. Can a shopper tell what the product is, why it’s better, and why to tap?
- Move the logo to the end. Open with the product in action or the problem it solves.
- Check technical compliance. 16:9, no bars, lower-right corner clear, accepted codec and frame rate, at least 4 Mbps bit rate, correct marketplace language.
- Cut to 20 seconds or less unless you have a specific reason to go longer, and front-load either way.
- Choose the destination on purpose. Product Detail Page for focused conversion, Brand Store for catalog discovery and brand equity, each with its own goals.
- Match openers to keyword intent clusters. Two or three variants beat one generic cut.
- Read the video funnel. Use viewable impressions, early views, quartile completions, clicks, and orders to find where attention drops off.
- Test one variable at a time, starting with the opener, and log every result.
- Shoot modular assets so new variants take minutes to edit instead of a new production.
- Treat video as part of the mix. As the HP example shows, it adds the most when it runs alongside Sponsored Products and your other ad types.
Your video will autoplay on mute in front of a shopper who’s halfway through a scroll. Make sure it still makes sense to them.