Sponsored Brands Video now accounts for roughly 58% of total Sponsored Brands spend across managed Amazon accounts as of Q1 2026. It delivers CTR benchmarks around 0.9–1.0% — more than double the static Sponsored Brands average of 0.4%. Its conversion rate sits near 11%, and its ROAS range, depending on how it’s managed, stretches from 3x on the low end to 8x or more on well-optimized branded defense campaigns.
SBV is, without question, the dominant Sponsored Brands format right now. Which makes it genuinely strange that most brands reviewing their SBV performance each week are essentially flying blind — pulling whatever metrics the Ads console happens to surface first, comparing them to last week’s numbers, and calling it done.
That is not an analytics routine. That’s reactive data consumption. And the difference matters more in 2026 than it ever has, because SBV performance is now shaped by layers of signals — creative quality, keyword relevance, audience composition, impression share, brand lift, and multi-touch attribution — that don’t all point in the same direction at the same time.
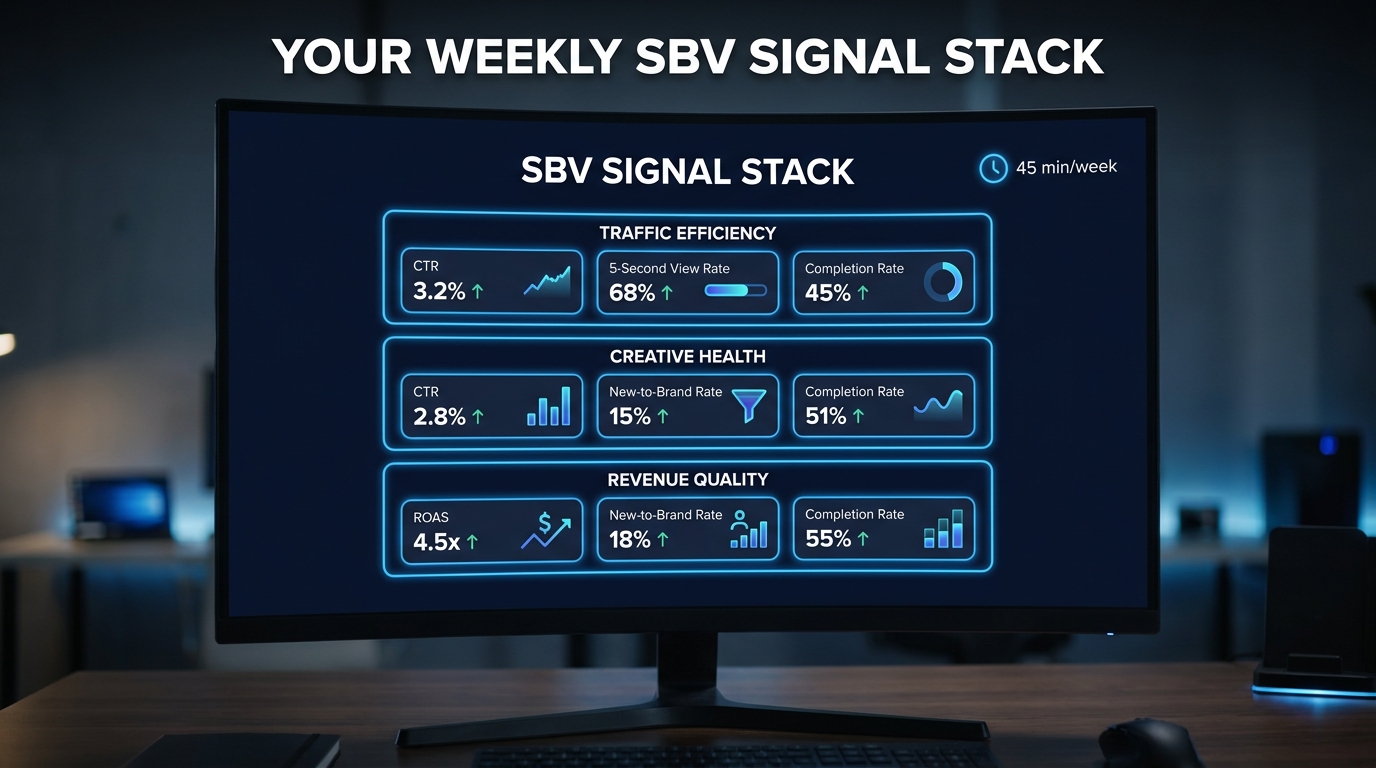
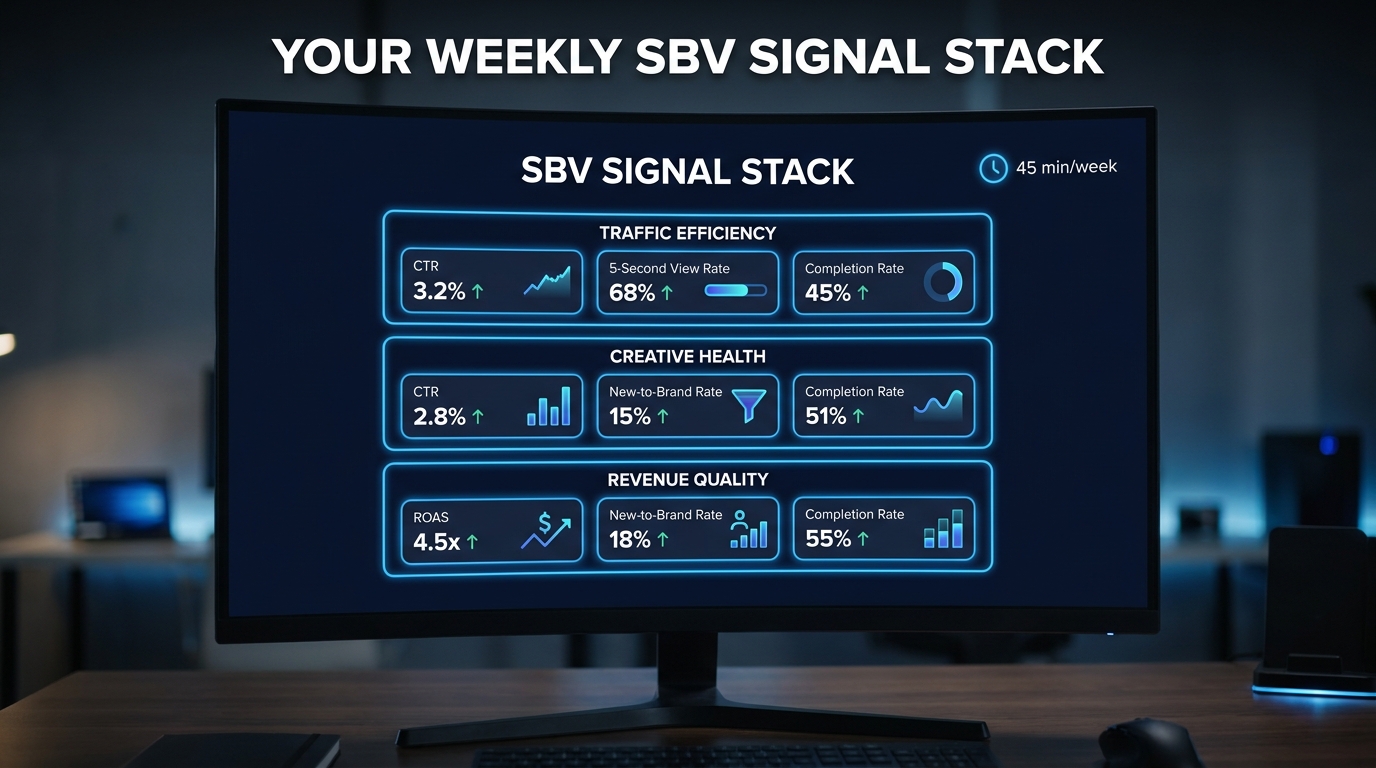
This post is about building a signal stack: a deliberately ordered, tightly scoped set of nine core metrics organized into three functional layers, reviewed on a fixed weekly schedule in under an hour. Not a spreadsheet empire. Not a BI platform project. A lightweight, repeatable routine that turns data into decisions — every single week.
If you’re spending meaningfully on SBV and you’re not running a structured weekly review against a defined signal hierarchy, you’re probably leaving both performance and insight on the table. Here’s how to fix that.
Why Most SBV Analytics Routines Fail Before Friday
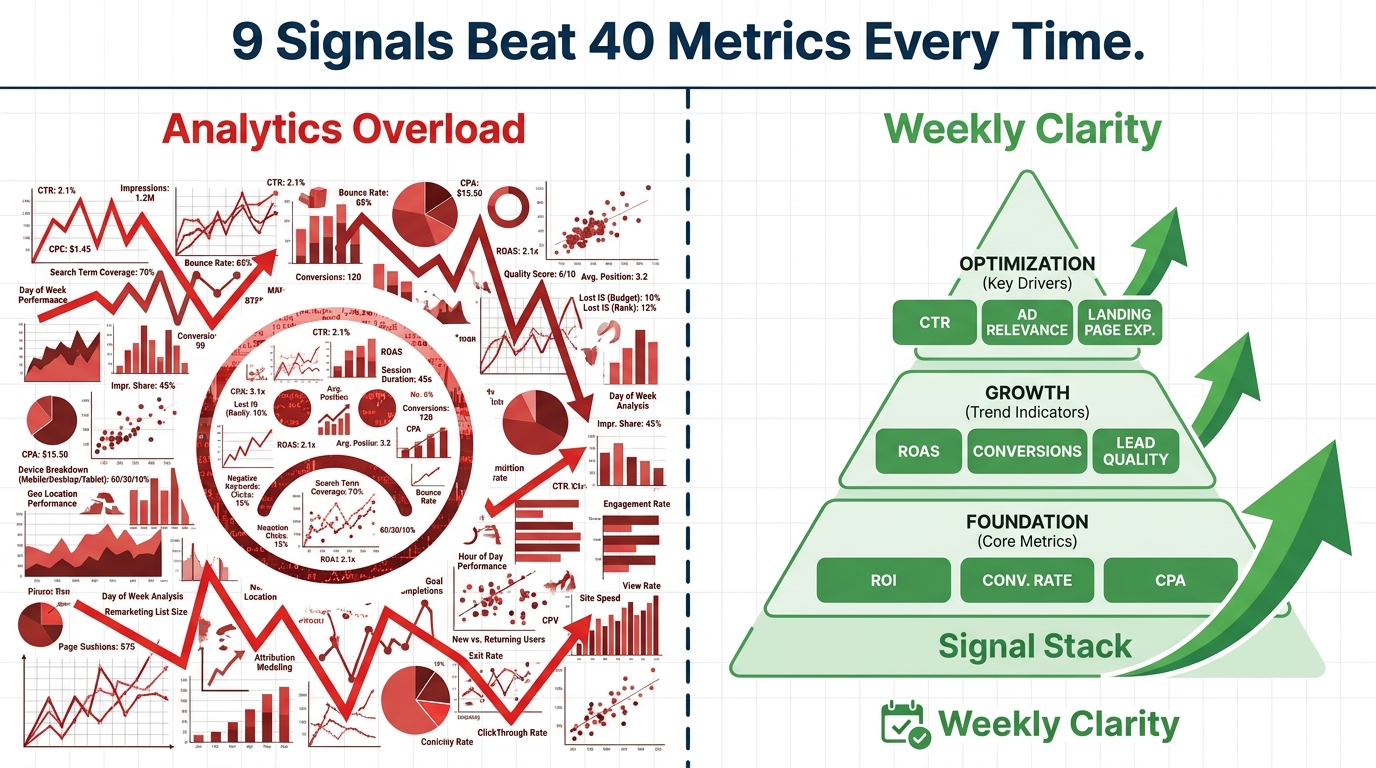
Most SBV analytics routines don’t fail because of bad data. They fail because of a structural problem that starts well before anyone opens a report: too many metrics, no defined hierarchy, and no time-bounded review discipline.
The Metric Sprawl Problem
Amazon’s Ads reporting console, as of 2026, surfaces more than 40 reportable metrics for a Sponsored Brands Video campaign — impressions, viewable impressions, clicks, orders, spend, ACOS, ROAS, CTR, CVR, video starts, 5-second views, first-quartile views, midpoint views, third-quartile views, completes, unmutes, view-through rate, new-to-brand orders, new-to-brand sales, new-to-brand units, brand impression share, and more. That’s not a signal stack. That’s a signal swamp.
When every metric looks equally important, the brain defaults to checking the most emotionally salient numbers — usually total spend, ACOS, and ROAS — and ignoring everything else. Creative signals go unread. Brand lift data stays untouched. Search term impression share never gets pulled. The review becomes a financial audit rather than a performance diagnostic.
The “Once a Month” Trap
Another common failure mode is review cadence mismatch. Many Amazon advertisers review SBV performance monthly — often as part of a broader account review — which is far too infrequent for a format that responds quickly to creative fatigue, bid pressure, and keyword drift.
SBV creative assets can exhaust their novelty effect within two to three weeks in competitive categories. A video that opened the month at 1.0% CTR may be sitting at 0.55% by week three as Amazon’s algorithm deprioritizes repeatedly-seen creative. If you only check monthly, you’ve already lost two weeks of opportunity to either refresh creative or reallocate budget to a better-performing variant.
No Defined Action Layer
The third failure mode — and arguably the most common — is running a review that generates observations but not decisions. It’s easy to spend an hour looking at charts and thinking “CTR is down a bit this week, ROAS looks okay, completion rate seems fine.” Nothing in that review is false. But nothing in it produces a Monday-morning action either.
A signal stack solves all three of these problems at once. It defines which metrics to look at (eliminating sprawl), mandates a weekly cadence (eliminating the monthly trap), and closes every review with a defined action log (eliminating the observation-without-decision cycle).
Why SBV Specifically Demands a Stack Approach
Static Sponsored Brands ads have a relatively simple performance story: you can mostly diagnose them with CTR, CVR, ACOS, and maybe impression share. SBV is categorically more complex because it adds an entire layer of creative engagement signals — video-specific metrics that sit upstream of click behavior — that static ads simply don’t have.
With SBV, a campaign can have a healthy ROAS but a collapsing completion rate, which tells you the creative is burning out fast and ROAS is about to deteriorate. Or it can have a strong completion rate but weak CTR, which tells you the video is holding attention but failing to trigger product interest. These are different diagnoses requiring different fixes. Without a structured stack that looks at both creative signals and revenue signals together, you can’t tell which problem you’re actually dealing with.
The Three-Layer Signal Stack Architecture
The SBV Signal Stack is organized into three functional layers, each answering a different diagnostic question. Reviewing them in order — top to bottom — creates a natural diagnostic flow from upstream attention signals to downstream revenue outcomes.
Layer One: Traffic Efficiency
This layer answers the question: Is SBV getting the right eyeballs and converting them to clicks efficiently? It covers the metrics that sit between impression and click — the first expression of creative-market fit. The core signals here are CTR, 5-Second View Rate, and Search Term Impression Share.
Layer Two: Creative Health
This layer answers: Is the video creative doing its job? It’s the layer most advertisers neglect because the metrics feel less “financial” — but they’re actually leading indicators for future ROAS deterioration. Core signals: Completion Rate, Unmute Rate, and View-Through Rate (VTR).
Layer Three: Revenue Quality
This layer answers: Are the clicks we’re getting worth paying for? It connects ad-attributed conversions to business outcomes, with particular emphasis on customer acquisition quality (New-to-Brand Rate), cost efficiency (ACOS), and blended return (ROAS). Core signals: New-to-Brand (NTB) Order Rate, ACOS, and CVR.
Why the Ordering Matters
The three-layer ordering is not arbitrary. Traffic Efficiency signals often reveal the root cause of Revenue Quality problems — and they’re faster to change than revenue outcomes, which take a full attribution window to update. If you always start with ROAS and work backwards, you’ll frequently chase the wrong fix. Starting with traffic signals and reading downward forces proper causal reasoning: attention → engagement → conversion.
Nine signals. Three questions. One weekly hour. That’s the architecture. Now let’s go deep on each layer.
Layer One — Traffic Efficiency Signals
Traffic efficiency is about the relationship between SBV’s placement in search results and its ability to earn the click. These are your fastest-moving signals — they update daily and respond quickly to bid changes, keyword additions, and creative rotations.
Signal 1: Click-Through Rate (CTR)
CTR is the most direct measure of whether your video creative is compelling enough to earn a click against competing search results. For SBV in 2026, the cross-category benchmark sits at 0.9–1.0%. That’s the range you’re aiming for on competitive keywords. If you’re running branded keywords (where the searcher already knows your brand), CTR benchmarks are higher — 1.2–1.5% is achievable on strong branded campaigns.
The important thing about CTR in a signal stack context is not just its absolute value but its direction over time. A CTR decline of 10–15% week-over-week, sustained across two consecutive weeks, is a strong creative fatigue signal — especially on campaigns where the same video creative has been running for three weeks or longer. This is when the Layer Two creative signals become critical context.
What CTR doesn’t tell you: whether the traffic you’re attracting is relevant, whether those clicks are converting, or whether your impression share is high or low. CTR is a ratio — it measures the quality of clicks per impression, not the volume or quality of the impressions themselves. That’s why it never stands alone in the stack.
Signal 2: 5-Second View Rate
This metric is unique to video formats. Amazon defines it as the percentage of video starts that reach the 5-second mark — which, given that SBV plays as autoplay and can be scrolled past at any moment, is a direct measure of how effectively your creative hooks attention in the first few seconds.
The first 2 seconds of an SBV ad are the most critical creative real estate on Amazon’s search results page. Best-practice guidance from Amazon and third-party agencies in 2026 converges on a consistent recommendation: show the product in the first 2 seconds, communicate its primary function or benefit by the 5-second mark. Ads that front-load brand logos, animations, or ambient footage before showing the product consistently underperform on 5-second view rate.
A healthy 5-second view rate for SBV sits at 35% or higher. Rates below 25% indicate the opening sequence is failing to create enough visual interest to overcome the passive scroll. This is a creative fix, not a bid fix — increasing bids on a video with a weak hook just means you’re paying more to show a creative that isn’t working.
Signal 3: Search Term Impression Share (SIS)
Impression share is the metric most Amazon advertisers have heard of but fewest actually track systematically. Amazon provides Search Term Impression Share in the Sponsored Brands reporting tab — it shows what percentage of available top-of-search impressions on a given query your brand is capturing versus the total available impressions across all competing advertisers.
For branded keywords (queries that include your brand name), impression share should be your most-watched competitive signal. An impression share below 80% on your own branded terms is a meaningful warning sign — it means competitors are actively bidding on your brand name and capturing a fifth or more of the searches where buyers are explicitly looking for you.
For category keywords, impression share benchmarks vary significantly by category, but a weekly review should flag any week-over-week decline of 5 percentage points or more, which typically indicates either a competitor has increased their bids aggressively or your Quality Score has slipped (often tied to product detail page freshness).
Building a running SIS time series is the key habit. Export the Search Term report every Monday, paste the relevant rows into a master tracking spreadsheet, and create a rolling chart. After four weeks, you have a baseline. After eight weeks, you can see trends. After twelve weeks, you have a competitive intelligence signal that no single-week view can provide.
Layer Two — Creative Health Signals
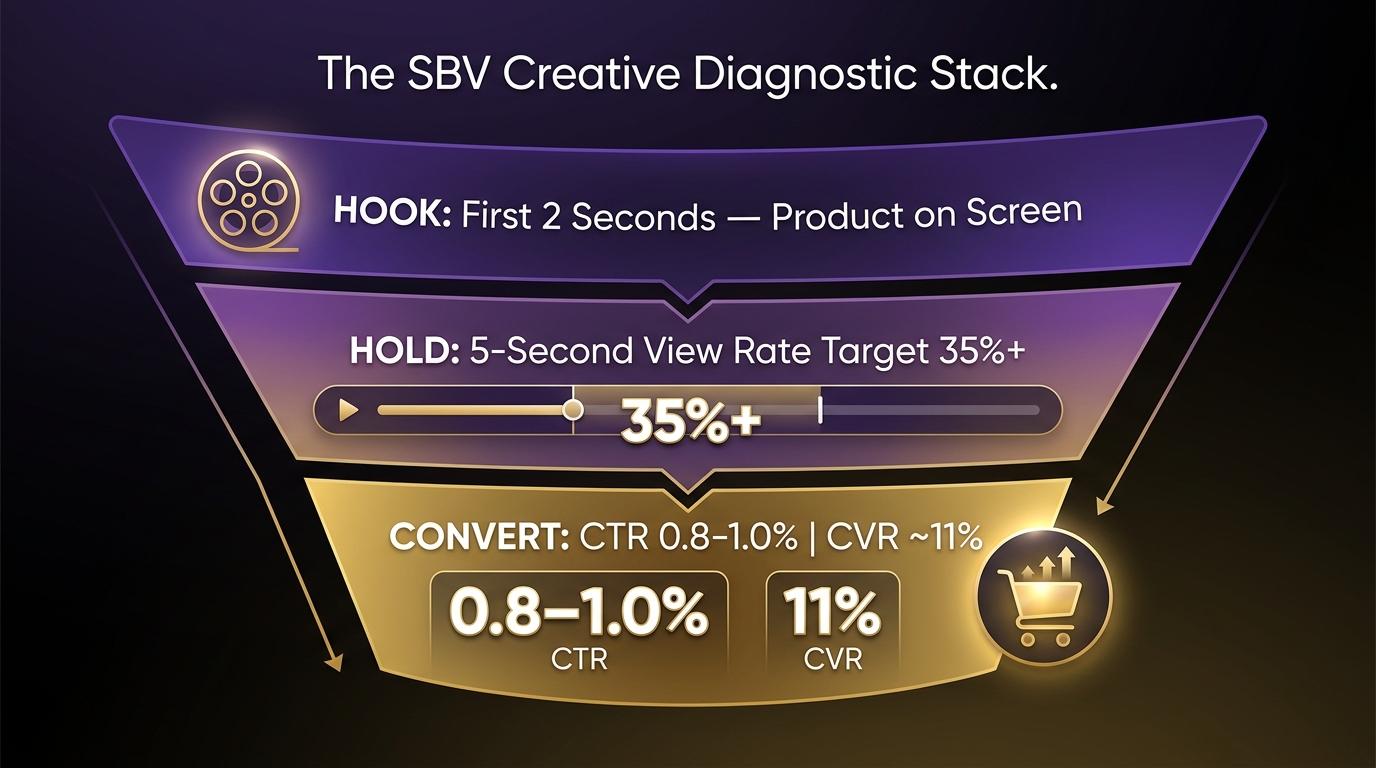
Creative health signals are the layer most likely to be skipped in a time-pressured weekly review — and the layer most likely to give you advance warning of impending ROAS deterioration. A video creative doesn’t break overnight. It decays gradually, and the decay shows up in creative engagement metrics weeks before it shows up in revenue numbers.
Signal 4: Video Completion Rate
Completion rate measures the percentage of video starts that reach the end of the video. For SBV, which typically runs at 15–30 seconds in autoplay, completion rate is a measure of the video’s hold power — its ability to keep a viewer engaged through to the end.
The 2026 benchmark range for healthy SBV completion rates is 40–55% on well-performing campaigns. Rates below 30% indicate the middle portion of the video is losing viewers — often because the creative lingers too long on product features rather than maintaining visual momentum or communicating a clear benefit progression.
Critically, completion rate should be read alongside CTR, not independently. A video with high completion rate (say, 52%) but low CTR (0.4%) tells you viewers are watching to the end but not clicking through — meaning the creative is engaging but the call-to-action or product-market connection is weak. A video with high CTR but low completion rate (18%) tells you the hook is working but viewers who don’t click are bailing early — often a sign of poor creative-keyword alignment.
One nuance for the weekly review: completion rate naturally varies with video length. A 15-second video will almost always have a higher completion rate than a 30-second video, all else equal. When comparing creatives, always compare within the same length tier.
Signal 5: Unmute Rate
SBV plays silently by default on Amazon’s search results page. Viewers who actively tap or click to unmute are signaling a measurably higher level of interest in the creative than those who watch silently. That makes unmute rate a highly sensitive engagement quality signal — it’s not just measuring whether people watched, but whether they wanted to hear what you were saying.
Amazon provides unmute data in the Campaign Manager video metrics tab. Average unmute rates across SBV campaigns are low — typically 5–10% across all viewers — but the metric’s value is comparative: a video with 12% unmute rate versus another with 3% unmute rate tells you something significant about relative engagement quality, even if the absolute numbers seem small.
For brands running multiple SBV creative variants simultaneously, unmute rate is one of the better early signals to identify which variant is generating genuine audience interest versus passive scroll exposure. In a creative testing rotation, the variant with the highest unmute rate often (not always, but often) has the best long-term CVR trajectory.
Signal 6: View-Through Rate (VTR)
VTR measures the percentage of viewable impressions (where at least 50% of the ad was visible for 2+ seconds) that resulted in a video start. It’s a metric that sits between impression and engagement — it captures how many people who could see the video actually let it begin playing.
VTR is particularly useful for diagnosing placement quality issues. If your VTR is declining week-over-week on a campaign with stable creative, it often indicates your SBV is winning more impressions in lower-visibility placements — below the fold, in less-engaged browsing contexts, or in categories where search intent is lower. This doesn’t necessarily mean your bids are wrong, but it does mean your impression volume growth is coming from lower-quality inventory.
A healthy weekly check: if VTR drops more than 8–10% week-over-week without a corresponding creative change, investigate whether your campaign’s keyword portfolio has expanded into lower-intent queries that are winning impressions but generating low-quality viewing contexts.
Layer Three — Revenue Quality Signals
Revenue quality signals are what most advertisers track exclusively — which is precisely the problem. ROAS and ACOS are lagging indicators. By the time they deteriorate meaningfully, the upstream cause has usually been brewing for two to three weeks in the creative and traffic layers. Reading this layer in isolation is like checking your engine temperature after your car has already overheated.
That said, revenue quality signals remain the most financially consequential metrics in the stack, and reading them correctly — especially NTB Rate — creates decision-making clarity that pure efficiency metrics don’t provide.
Signal 7: New-to-Brand (NTB) Order Rate
New-to-Brand is Amazon’s metric for identifying buyers who have not purchased from your brand in the prior 12 months. For SBV, NTB rate is arguably the most strategically important revenue metric — more important, in many cases, than ROAS — because it measures whether your advertising is building your customer base or merely re-converting existing customers.
SBV is inherently an upper-funnel format. Its placement at the top of search results, its autoplay behavior, and its visual storytelling format make it particularly effective at capturing category-level shoppers who are aware of a problem but haven’t yet committed to a brand. The expected NTB rate target for SBV campaigns on non-branded keywords is 50% or higher on a 28-day attribution window. Rates consistently below 35% suggest SBV spend is disproportionately recapturing existing buyers — a role better suited to Sponsored Products retargeting than to SBV.
On branded keywords, the NTB expectation flips. Here, you want a lower NTB rate — you’re defending against competitors targeting your brand name, and many of those clicks should convert existing or highly-aware customers. A branded SBV campaign showing 70% NTB rate might actually indicate keyword bleed into non-branded category terms.
The weekly action rule for NTB: if NTB rate on category campaigns drops below 40% for two consecutive weeks, audit your targeting to check for keyword overlap with branded or retargeting campaigns. Use Amazon Marketing Cloud’s audience overlap queries if you have AMC access — the visual confirmation that your SBV audience and your Sponsored Products retargeting audience are heavily overlapping is usually enough to prompt an immediate segmentation fix.
Signal 8: Advertising Cost of Sales (ACOS)
ACOS — ad spend divided by ad-attributed sales — is the most commonly tracked SBV metric and also the most commonly misread. The mistake isn’t tracking ACOS; it’s applying a single ACOS target to campaigns with fundamentally different strategic purposes.
A branded defense SBV campaign should have a very different ACOS target than a category acquisition campaign. Branded defense campaigns are competing against rivals bidding on your brand name — the cost of allowing competitor SBV to appear on branded searches is customer attrition, not a financial metric. Many advertisers correctly run branded SBV at a deliberately high ACOS (30–40%) because the alternative — losing branded search visibility — is costlier than the ad spend.
Category acquisition SBV campaigns, by contrast, should be held to tighter efficiency targets, typically ACOS in the 15–25% range depending on category margins. If a category acquisition campaign has drifted above 30% ACOS for three consecutive weeks, it’s a signal to investigate either keyword relevance (targeting queries too far from purchase intent) or landing page quality (product detail page not converting SBV traffic effectively).
ACOS targets should be documented in your weekly scorecard, not improvised during each review. Knowing the target before you check the number is what separates a diagnostic review from an anxious one.
Signal 9: Conversion Rate (CVR)
CVR — orders divided by clicks — is the signal that bridges creative performance and listing quality. A platform-wide SBV CVR benchmark sits around 11%, and campaigns achieving 13% or above are generally well-optimized across both creative and landing page dimensions.
CVR drops are one of the clearest diagnostic triggers in the entire stack. A sustained CVR decline (two or more weeks, 15%+ decline) on a campaign where CTR remains stable almost always points to a product detail page issue: price increase, review count or rating decline, competitor content improvement, or a listing image change that weakened perceived value. It’s rarely a campaign structure problem — by the time someone clicks your SBV ad, the campaign has already done its job. What happens after the click is the listing’s responsibility.
This is why CVR belongs in the signal stack: it’s the handoff metric between advertising and merchandising. Watching it weekly creates accountability for both the ad team and the content/listing team simultaneously.
The Brand Metrics Bridge: Connecting Upper-Funnel Signals to Downstream Purchase
The nine signals above cover what happens inside your SBV campaigns. But SBV’s full impact extends beyond what any campaign-level report can show — and that’s where Amazon Brand Metrics becomes an essential companion to the signal stack.
What Brand Metrics Actually Measures
Amazon Brand Metrics is a separate reporting module (available in Seller Central and the Ads console for enrolled brands) that quantifies the shopper funnel at the brand level: awareness, consideration, and purchase. Unlike campaign reports, which only capture ad-attributed events, Brand Metrics captures all on-Amazon shopper behavior associated with your brand — including organic branded searches, product detail page views from non-ad sources, and purchase events that occurred without ad exposure.
This matters enormously for SBV because SBV’s primary job is often to generate awareness and consideration, not just last-click conversion. An SBV impression that doesn’t result in an ad-attributed purchase might still trigger a branded search three days later — which shows up in Brand Metrics’ awareness index but never in your campaign ROAS.
How to Use Brand Metrics in the Weekly Stack
Brand Metrics data refreshes on a three-month rolling basis, which means it’s not a daily-monitoring tool. But adding a monthly Brand Metrics check as a companion to the weekly signal stack creates a crucial upper-funnel perspective that pure campaign metrics miss.
The most actionable weekly bridge between Brand Metrics and your signal stack is branded search volume. If your SBV campaigns are running at scale and your brand-level branded search volume (visible in Brand Metrics under “awareness”) is flat or declining over a multi-week period, that’s a meaningful signal that SBV impressions are not translating into brand recall. It warrants a creative diagnostic: are your videos clearly brand-stamping from the first second? Is your logo placement and brand name prominent in the first 5 seconds of the autoplay?
Consideration Index as a Creative Quality Check
The consideration metric in Brand Metrics — which Amazon builds from detail page views, add-to-carts, and brand-search-to-detail-page navigation patterns — serves as a slow-moving but high-signal indicator of whether your SBV is reaching genuinely interested shoppers or just generating passive impressions.
If you’re running SBV at meaningful scale (say, $5,000+ per month in Sponsored Brands spend) and your consideration index is stagnant while your impression volume grows, the SBV reach expansion is landing on low-intent audiences. This is the moment to tighten keyword targeting, exclude low-quality search terms aggressively, or shift bid weight toward tighter match types that reach shoppers further down the purchase funnel.
Search Term Impression Share: Your Weekly Competitive Pulse Check
Search Term Impression Share (SIS) deserves its own section because it’s the one weekly signal that directly tells you what your competitors are doing — not just what your own campaigns are doing. It’s the closest thing Amazon Advertising offers to a weekly competitive intelligence brief.
Building Your SIS Time Series
Amazon’s SIS report provides a snapshot of your impression share and rank for each search term in your campaigns, with up to a 90-day lookback. The trap is treating this as a static reference document rather than a time series. Your SIS on a given keyword last week means almost nothing in isolation. Your SIS on that keyword across the last 12 consecutive weeks tells you whether you’re gaining ground, holding steady, or losing share — and at what rate.
The mechanical process for building this time series is simple but requires discipline: download the Search Term Impression Share report every Monday morning (or whatever day you designate as your review day), paste the relevant rows into a master tracking spreadsheet, and create a rolling chart. After four to six weeks, patterns emerge. After three months, you have a genuine competitive intelligence asset.
What SIS Declines Actually Tell You
A declining impression share on a given search term can mean three different things, and the right response depends on correctly diagnosing which one it is:
- Competitor increased bids: Your impression share is declining because a competitor is outbidding you. Response: evaluate whether the term’s conversion rate justifies a bid increase, or accept a smaller share on that term and redirect budget elsewhere.
- Your Quality Score declined: Amazon’s algorithm assigns a Quality Score to SBV ads that incorporates creative relevance, keyword-to-landing-page alignment, and historical engagement metrics. A declining Quality Score can reduce impression share even at the same bid level. Response: audit keyword-to-creative alignment and check whether recent listing changes reduced relevance signals.
- New competitor entered the keyword: A new brand has started bidding aggressively on a term where you previously had minimal competition. This is identifiable because the SIS decline is sudden (one week) rather than gradual. Response: investigate the competitor’s creative and consider whether a bid defense is strategically warranted.
Branded Impression Share: The Number That Must Stay Above 80%
Brand impression share — Amazon’s specific metric for your share of top-of-search impressions on queries containing your brand name — is a metric you should never let fall below 80% without active monitoring and a decision. Below 80% means competitors are consistently appearing above or alongside your brand in searches where buyers are explicitly looking for you. Every percentage point of branded impression share lost to competitors represents a measurable leak in brand equity.
The good news: branded SBV is typically lower CPC than category SBV because your Quality Score on your own branded terms tends to be high. Maintaining 85–90%+ branded impression share is usually achievable at a reasonable cost — and the NTB rate on branded campaigns, as discussed earlier, acts as a check on whether that spend is drawing in genuinely new customers or recapturing existing ones.
AMC as a Weekly Sanity Layer (and When You Actually Need It)
Amazon Marketing Cloud (AMC) is the privacy-safe clean room environment where Amazon joins event-level data from Sponsored Products, Sponsored Brands, DSP, and Streaming TV into a single queryable dataset. It’s genuinely powerful — and genuinely over-prescribed for small-to-mid SBV advertisers who don’t yet need it.
Who Actually Needs AMC Weekly
If your total Amazon Ads monthly spend is below $15,000, AMC’s incremental value over a well-executed signal stack routine is marginal. The signal stack covers the actionable decisions you need to make at that scale. If you’re running $15,000–$50,000+ per month, AMC starts delivering unique insights that the signal stack can’t replicate — specifically around multi-touch attribution and audience overlap.
The most valuable AMC query for SBV advertisers at the $15K+ level is the SBV-to-Sponsored Products path analysis: identifying buyers whose purchase path started with an SBV impression and converted later via a Sponsored Products click. This is the exact path that last-click ROAS attribution systematically undercredits SBV for — and AMC is the only way to surface it.
The Overlap Query: Your Audience Cannibalization Check
The second high-value AMC use case for weekly SBV analysis is audience overlap: checking whether the audience exposed to your SBV campaigns is substantially overlapping with the audience you’re retargeting via Sponsored Products or DSP. If it is, you have an attribution problem — conversions are being counted in multiple campaigns, and your true incremental impact of SBV is lower than your ROAS suggests.
Amazon’s AMC Audience Overlap query, run monthly (not weekly), takes roughly 30 minutes to set up and run for the first time, and about 10 minutes on subsequent runs. It outputs an audience overlap percentage between two campaigns or campaign groups. An overlap above 40% between SBV and retargeting campaigns typically warrants an audience exclusion fix — adding an audience exclusion to either the SBV campaign (excluding recent purchasers) or the retargeting campaign (excluding users who saw SBV in the last 7 days, to avoid double-counting).
When to Keep AMC Out of the Weekly Routine
AMC runs SQL queries against a cloud dataset. It has a learning curve, and it produces outputs that require interpretation. For weekly reviews, resist the temptation to use AMC as a primary diagnostic tool — it’s too slow and too complex for the 45-minute weekly cadence. Instead, use it monthly as a validation layer: confirming that what your signal stack has been showing you over the past four weeks is consistent with AMC’s multi-touch view of the same period.
The signal stack gives you speed and decision velocity. AMC gives you depth and attribution confidence. They serve different purposes, and conflating them leads to either analysis paralysis (trying to run AMC queries every week) or strategic blindness (never running AMC at all).
Building Your 45-Minute Weekly Review Ritual
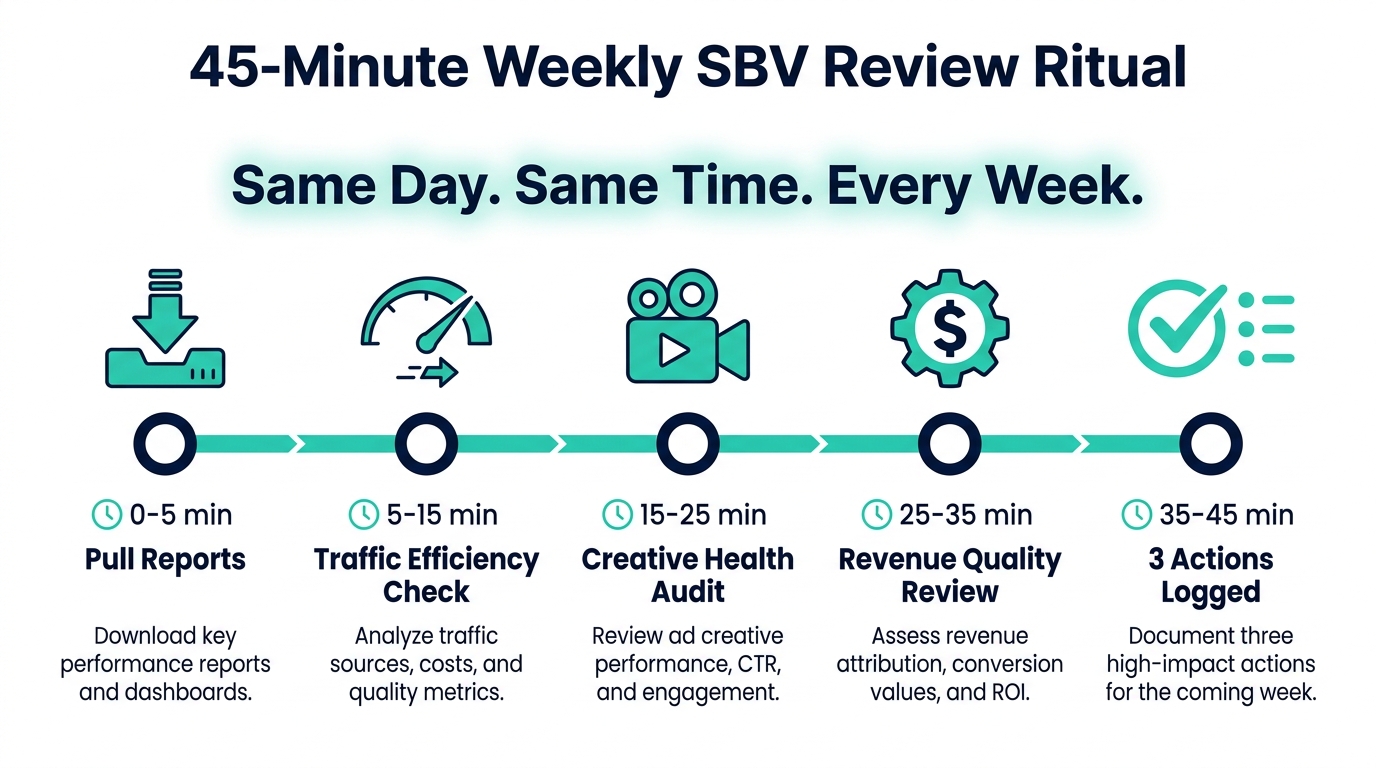
The signal stack is only useful if it’s actually reviewed. The review is only useful if it’s time-boxed, consistent, and action-generating. Here’s the exact routine structure to implement this week.
The Non-Negotiable Anchor: Same Day, Same Time
Pick a day and time for your weekly SBV review and treat it as non-negotiable. Monday mornings work well for most teams because Amazon campaign data from the prior week is fully settled by Sunday evening and Monday’s review can inform the week’s optimization priorities. Tuesday mornings are also popular for teams that run a Monday standup and want fresh data for that discussion.
The specific day matters less than the consistency. Irregular reviews — “whenever I get to it” — are almost always deprioritized during busy weeks and end up happening monthly at best. The habit of a fixed weekly slot is itself a competitive advantage, because most of your competitors are doing it inconsistently.
Minutes 0–5: Report Pull
Before your review session begins, set up a standing report schedule in Amazon Ads so the reports you need are waiting in your inbox when you sit down. The three reports to schedule:
- Sponsored Brands Video Campaign Report — weekly, including CTR, CVR, ACOS, ROAS, NTB metrics
- Sponsored Brands Video Creative Report — weekly, including video starts, 5-second views, completions, unmutes
- Search Term Impression Share Report — weekly, for all Sponsored Brands campaigns
Scheduled reports eliminate the 10–15 minutes that manual report pulling typically consumes and ensure your data is consistent week-over-week. Spend minutes 0–5 downloading these three reports and pasting the relevant rows into your tracking scorecard.
Minutes 5–15: Traffic Efficiency Layer
Review CTR, 5-Second View Rate, and Search Term Impression Share against your established baselines. Flag any metric that has moved more than 10% in either direction compared to the prior week. Green flags (improvements) are worth noting but don’t require immediate action. Red flags (declines) get logged with a hypothesis: Is this a creative issue, a keyword issue, or a competitive pressure issue?
Minutes 15–25: Creative Health Layer
Check completion rate, unmute rate, and VTR. For any video creative that has been running three weeks or more, check whether completion rate has declined 5+ percentage points from its first-week baseline. If it has, this is a creative refresh trigger — note it explicitly in the action log. This is not something to debate in the review; if the signal is there, the action is queued.
Minutes 25–35: Revenue Quality Layer
Review NTB Rate, ACOS, and CVR against campaign-specific targets (not universal benchmarks). Note the delta from last week and from the four-week rolling average. Any metric outside its target range for two or more consecutive weeks gets a root cause entry in the action log — one sentence identifying the most likely cause based on what you saw in Layers 1 and 2.
Minutes 35–45: Action Log
Write three to five concrete actions that emerge from the review. Each action should be specific enough that someone else could execute it without asking for clarification. Examples of good action log entries:
- “Campaign X — Video Creative A has declined from 48% to 29% completion rate over 3 weeks. Initiate Creative B rotation test on 50% of budget this Monday.”
- “Branded keywords — impression share down from 87% to 71% over 2 weeks. Increase branded SBV bid floor by 20% effective today.”
- “Category campaign — CVR down 14% week-over-week with stable CTR. Review product detail page for price or review changes in last 7 days.”
The action log is the most important output of the weekly review. The signal stack tells you what’s happening. The action log decides what to do about it.
When Your Signals Disagree: Conflict Patterns and What They Mean
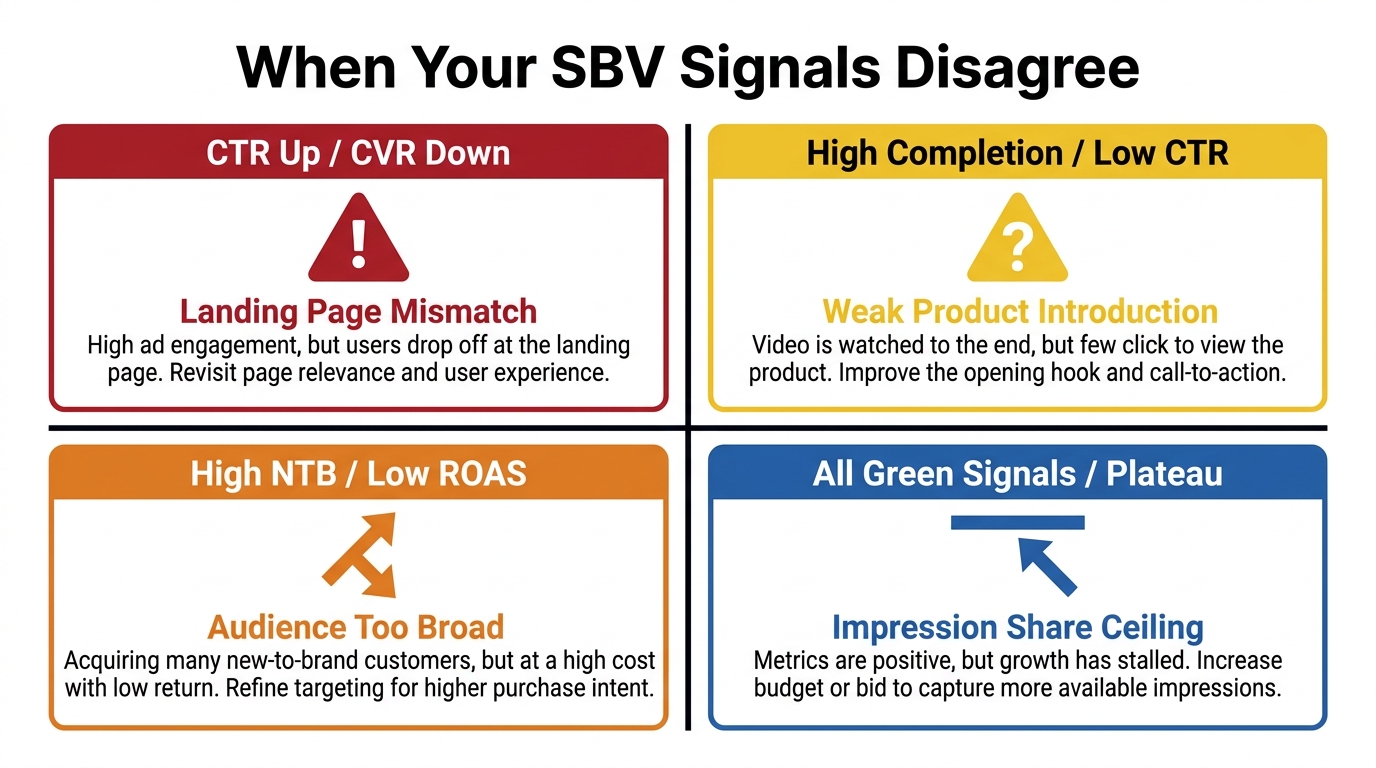
Real SBV campaigns rarely present with all signals pointing in the same direction. The most valuable analytical skill in the weekly routine is not reading healthy signal patterns — it’s correctly diagnosing the four most common conflict patterns, where different layers tell contradictory stories.
Conflict Pattern 1: CTR Up, CVR Down
What it looks like: Week-over-week CTR is improving (often after a creative refresh), but CVR is declining simultaneously.
The diagnosis: Landing page mismatch. The new creative is attracting a different audience — one that’s responding to the visual hook but finding that the product detail page doesn’t match what the video implied. This is common when SBV creative is updated to emphasize a use case or lifestyle context that the listing imagery doesn’t reinforce.
The fix: Audit the product detail page images and A+ content for alignment with the new creative’s messaging. The creative and the listing need to tell the same story — if the SBV shows the product in an outdoor fitness context but the listing imagery is entirely studio white-background shots, the emotional handoff breaks at the click.
Conflict Pattern 2: High Completion Rate, Low CTR
What it looks like: Completion rate is healthy (45%+), viewers are watching the whole video, but CTR sits below 0.6%.
The diagnosis: The video is entertaining or informative but failing to generate purchase intent. This often happens with videos that lead with lifestyle storytelling, problem-framing, or brand narrative before the product appears — viewers watch to the end but don’t click because the video didn’t make them want the product specifically.
The fix: Test a variant that brings the product and its primary benefit into the first 2 seconds. The goal of SBV creative is not to be watched; it’s to generate clicks from buyers who see the product and want it. High completion with low CTR is watchable content that’s failing at commerce.
Conflict Pattern 3: High NTB Rate, Low ROAS
What it looks like: 60%+ of SBV-attributed orders are new-to-brand customers, but ROAS is below target (say, 2x on a campaign targeting 4x).
The diagnosis: The campaign is reaching genuinely new audiences but converting them inefficiently — typically because keyword targeting is too broad and pulling in low-intent search queries that result in expensive-to-win clicks with poor conversion rates.
The fix: A search term audit of the SBV campaign. Isolate the 20% of terms generating 80% of spend, check their individual CVR and ACOS, and aggressively negative-match any term with CTR above 0.8% but CVR below 5%. High NTB rate with low ROAS is not a brand awareness investment — it’s a targeting efficiency problem.
Conflict Pattern 4: All Signals Green, But Performance Plateau
What it looks like: CTR, completion rate, NTB rate, ACOS, and CVR are all at or above benchmark — but revenue growth from the campaign has flatlined.
The diagnosis: Impression share ceiling. The campaign has optimized itself into a state where it’s performing well within its current scale but can’t grow because it’s already captured most of the available impressions on its keyword set.
The fix: Check Search Term Impression Share. If branded keywords are at 85%+ and category keywords are at 40%+, the campaign is close to its organic growth ceiling on the current keyword set. The path forward is keyword expansion — adding related category terms, complementary product queries, and competitor brand terms (with careful ROAS monitoring) — rather than bid increases, which will yield diminishing returns at high impression share levels.
Signal Stack Benchmarks: What Good Actually Looks Like in 2026
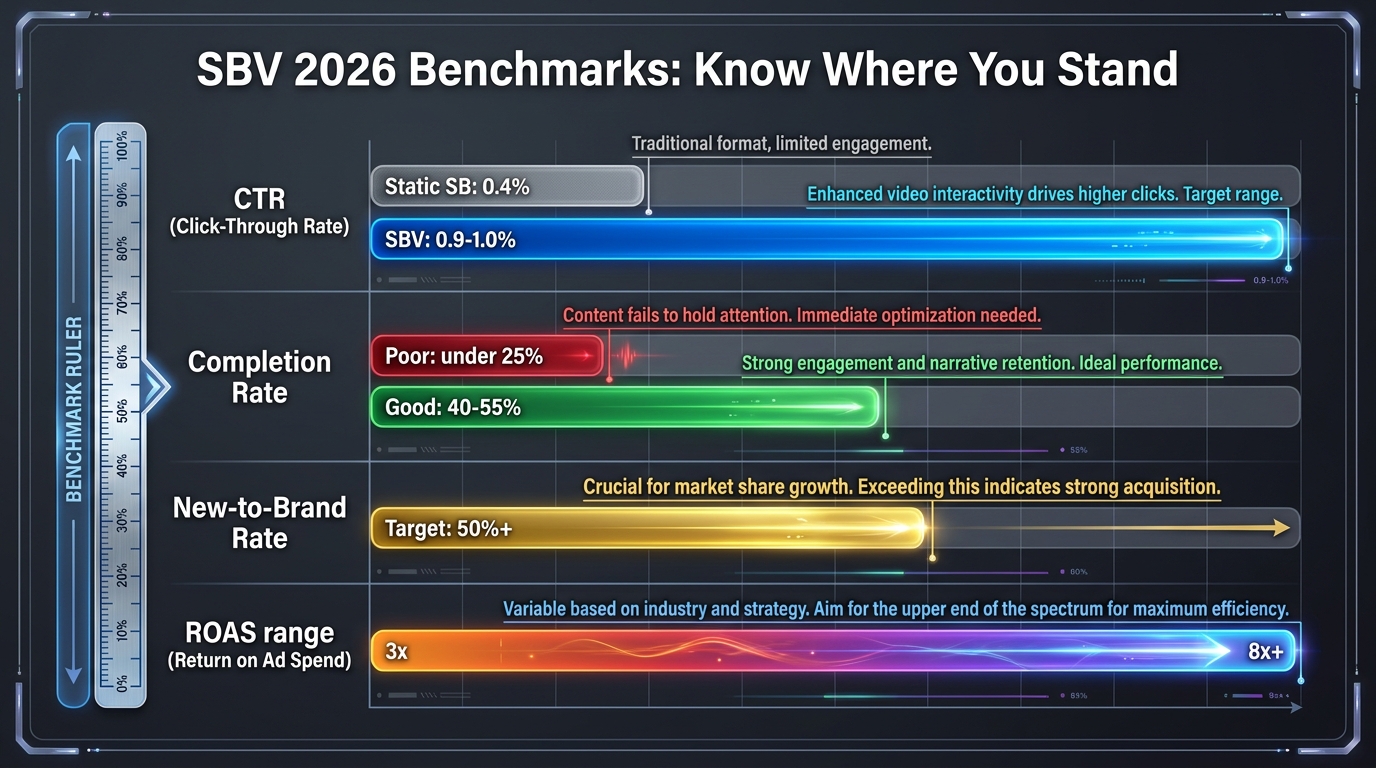
Benchmarks without context are dangerous — but benchmarks with context are genuinely useful calibration tools. The following ranges reflect 2026 cross-category SBV performance data and should be treated as orientation points, not pass/fail thresholds. Your specific category, margin structure, and competitive density will shift your targets in either direction.
Traffic Efficiency Benchmarks
| Signal | Underperforming | On Track | Strong |
|---|---|---|---|
| CTR (Category Keywords) | Below 0.55% | 0.55–0.85% | 0.85%+ |
| CTR (Branded Keywords) | Below 0.9% | 0.9–1.2% | 1.2%+ |
| 5-Second View Rate | Below 25% | 25–35% | 35%+ |
| Branded Impression Share | Below 70% | 70–84% | 85%+ |
Creative Health Benchmarks
| Signal | Underperforming | On Track | Strong |
|---|---|---|---|
| Completion Rate | Below 28% | 28–42% | 42%+ |
| Unmute Rate | Below 4% | 4–8% | 8%+ |
| Creative Freshness (weeks since last test) | 6+ weeks | 3–5 weeks | 1–2 weeks |
Revenue Quality Benchmarks
| Signal | Underperforming | On Track | Strong |
|---|---|---|---|
| NTB Order Rate (Category SBV) | Below 35% | 35–50% | 50%+ |
| CVR | Below 7% | 7–10% | 10%+ |
| ACOS (Category Acquisition) | Above 35% | 25–35% | Below 25% |
| ROAS (Blended SBV) | Below 2.5x | 2.5–4x | 4x+ |
One important caveat on benchmarks: category margin structure changes everything. A brand with 65% gross margins can sustain a 30% ACOS profitably. A brand with 28% gross margins cannot. Always back-calculate your ROAS floor from your margin structure before setting campaign targets, and don’t use cross-category benchmarks as hard performance thresholds without accounting for your own unit economics.
From Data Collector to Signal Reader: A Closing Framework
The difference between an Amazon advertiser who’s drowning in dashboards and one who’s decisively managing their SBV performance isn’t access to better data. It’s a different relationship with data itself.
Data collection is reactive — you open the console and read whatever it shows you. Signal reading is proactive — you review a defined set of metrics in a defined order, looking for specific patterns against established baselines, and generating a specific list of actions before you close the tab.
The SBV Signal Stack described in this post is deliberately narrow: nine signals, three layers, four conflict patterns to watch for, one 45-minute weekly block. That narrowness is not a limitation. It’s the design. Because the goal isn’t to maximize the amount of data you consume each week. It’s to maximize the quality of decisions you make from the data you review.
The Three Habits That Sustain the Routine
Implementing the signal stack is straightforward. Sustaining it past the first month requires three habits:
- Document your baselines explicitly. Your first four weeks of running the signal stack establish your baselines. Write them down. A 0.78% CTR that looks “low” against industry benchmarks might actually be strong for your specific category and keyword mix. Without your own documented baseline, every week’s review is floating against abstract benchmarks rather than your actual performance trajectory.
- Keep the action log honest. The easiest corruption of the weekly review ritual is a vague action log: “Monitor CTR,” “Adjust bids,” “Look at creative.” These are not actions. Each entry in the action log should have a specific metric, a specific campaign, a specific decision, and a specific date for implementation or follow-up.
- Treat creative refresh as a scheduled maintenance item, not a reactive fix. The data will tell you when completion rate is declining. But waiting for the signal to arrive means you’ve already lost two or three weeks of optimal performance. Best practice is to plan a creative refresh cycle proactively — typically every 4–6 weeks for high-spend campaigns — and use the signal stack to confirm whether to accelerate or delay the planned refresh based on the actual performance trajectory.
What This Routine Makes Possible Over Time
Run this routine for twelve weeks and you’ll have something most Amazon advertisers don’t: a structured, annotated performance history for your SBV campaigns that shows exactly which creative changes produced which signal improvements, which keyword decisions moved impression share in which direction, and which targeting refinements correlated with NTB rate recovery.
That history is compounding intellectual capital. Every week of consistent signal reading adds to a body of brand-specific knowledge that no benchmark report and no external audit can fully replace. The brands that will be managing SBV most effectively in the next 12–18 months are the ones building this institutional knowledge now — not because the analytics are complicated, but because the discipline of building them consistently is rare.
Nine signals. Forty-five minutes. Every week. That’s the whole routine. Start this Monday.
Leave a Reply