Something important happened on May 13, 2026. Amazon quietly retired the Rufus brand and absorbed its capabilities into Alexa for Shopping — a merged AI layer that now sits directly inside the Amazon search bar and acts as the primary discovery engine for hundreds of millions of shoppers worldwide. If you blinked, you missed the announcement. If you didn’t update your image strategy in response, you’re already behind.
The rebrand wasn’t cosmetic. Alexa for Shopping combines the conversational product understanding from Rufus with the personalization engine from Alexa+, creating an AI layer that doesn’t just answer product questions — it compares, tracks prices, reads your purchase history, and increasingly makes purchase decisions on behalf of shoppers. The most consequential part of this, for anyone who sells physical products on Amazon, is how this assistant interacts with your product images.
This isn’t another article about white backgrounds and 2000px minimum resolution. Those rules haven’t changed. What has changed is how a multimodal AI system reads, interprets, and uses your images to decide whether to recommend your product or a competitor’s. That’s the gap this playbook addresses — not the compliance checklist, but the strategy layer sitting on top of it.
We’ll cover how the AI actually processes your images (beyond the marketing language), what a slot-by-slot image sequence should accomplish in 2026, how A+ content fits into the visual ecosystem, and how to measure whether your images are working for or against you in AI-mediated discovery. Category-specific guidance is included for the product types where this gap matters most.
The Rebrand That Changed the Underlying Game
Rufus launched in early 2024 as a conversational shopping assistant bolted onto Amazon search. It was useful but limited — good at answering product-specific questions when the listing gave it clear data to work with. The merge into Alexa for Shopping in May 2026 changed three things that matter for image strategy.
Personalization Now Feeds Recommendations
The old Rufus was relatively stateless. Ask it a question, get an answer based on the product catalog. Alexa for Shopping is different — it pulls from your Amazon purchase history, browsing behavior, Alexa device interactions, and household data to personalize what it recommends. This means a product’s visibility through the AI layer isn’t just a function of listing quality. It’s a function of listing quality relative to what a specific shopper has signaled they care about.
The practical implication: your images need to communicate multiple use-case contexts, not just one. A single lifestyle image of a protein powder being used by a 25-year-old male athlete will serve one segment well. But if your product also fits a 45-year-old woman training for her first marathon, an image that speaks to that context dramatically expands how the AI matches your product to relevant queries from that demographic.
Agentic Shopping Changes the Discovery Model
Alexa for Shopping has introduced what Amazon calls “agentic” behaviors — the assistant doesn’t just surface results, it can set price alerts, add items to carts, and eventually complete purchases automatically at a shopper’s instructed price point. This shifts the discovery dynamic significantly. When a human scrolls a results page, they respond to visual cues instinctively. When an AI agent is pre-filtering the results before the human ever sees them, visual quality and information density in images become screening criteria rather than persuasion tools.
Your images need to pass an AI screening layer before they ever get the chance to persuade a human buyer.
Scale: 300 Million Customers, ~$12B in Incremental Sales
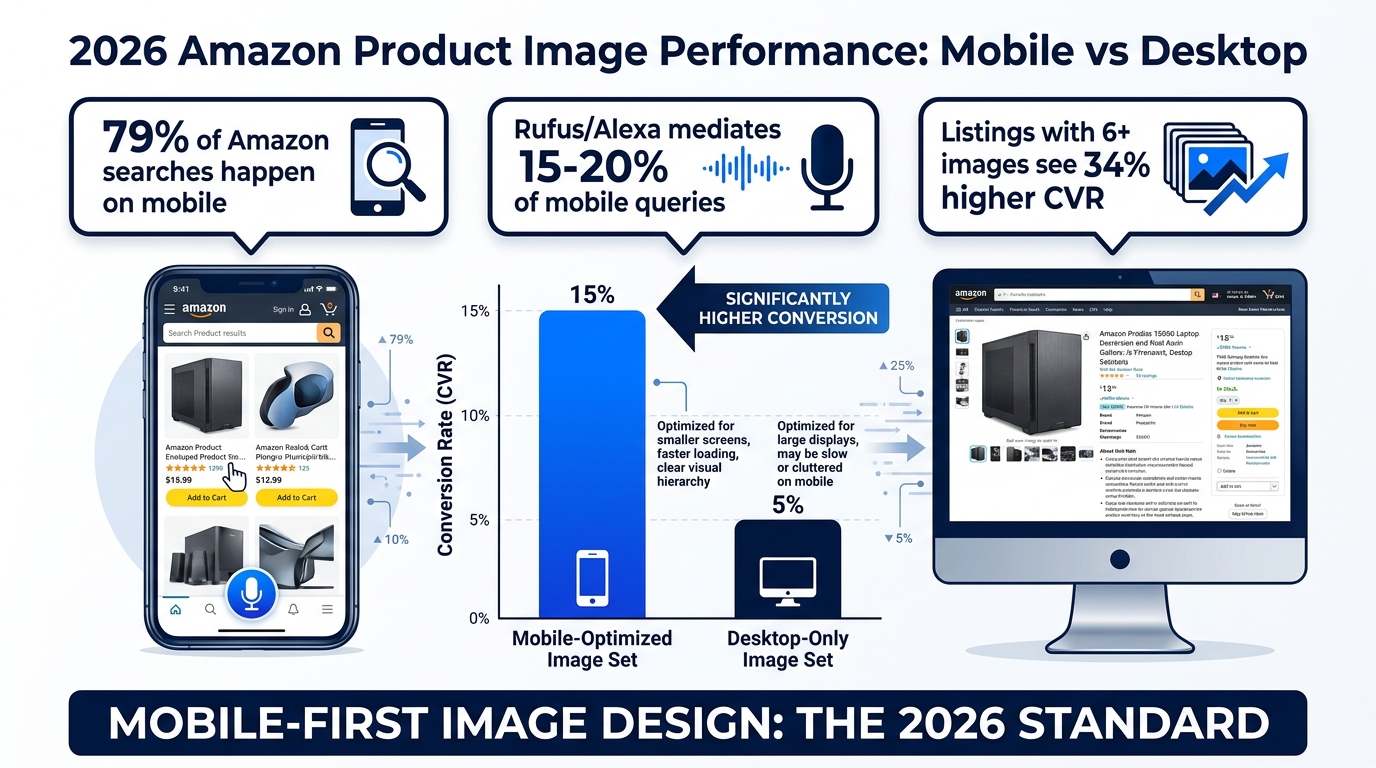
Amazon has indicated that Alexa for Shopping (the combined Rufus + Alexa+ system) reaches approximately 300 million customers across its surfaces. Early internal estimates and third-party account reviews suggest the assistant is mediating between 15–20% of mobile shopping queries as of Q2 2026. That’s not a niche feature. That’s a significant share of your addressable audience on the platform encountering your product first through an AI lens — before they read your title, before they scan your bullets, before they see your price.
How Alexa for Shopping Actually Reads Your Images
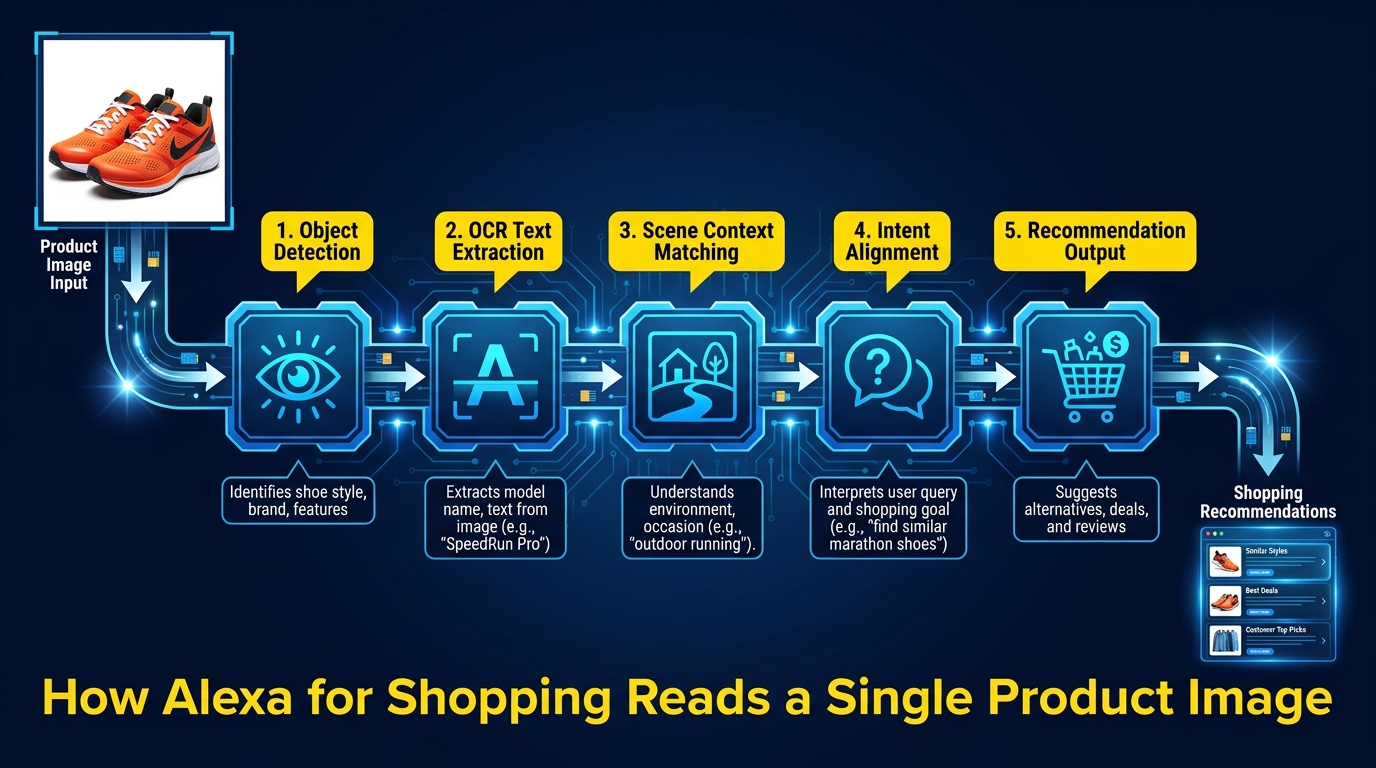
The phrase “AI reads your images” gets used liberally in seller marketing content without much explanation of what that means mechanically. Here’s the substantive version — as close to the actual architecture as publicly available information allows.
Computer Vision: The Object Layer
Alexa for Shopping uses a computer vision pipeline — functionally similar to Amazon Rekognition, Amazon’s own vision API — to identify objects, scenes, and contexts within each product image. This isn’t guesswork. Amazon has years of labeled training data from its own product catalog, and the models are well-calibrated at identifying objects at confidence levels that let them be used as structured attributes.
When the AI “sees” your lifestyle image, it’s detecting: the product itself, the environment it’s in (kitchen, outdoor, gym, bedroom, office), any people present and their apparent demographic attributes, relevant co-occurring objects (a yoga mat next to a water bottle, say), and visual indicators of product features (a child using a sippy cup, confirming “kid-friendly” or “spill-proof” claims).
These detected scene attributes are translated into signals that help match your product to intent-based queries. A search like “water bottle for hiking” will surface products whose images contain contextual outdoor/active-use signals — not just products with the word “hiking” in the title.
OCR: The Text-Reading Layer
This is the piece most sellers underestimate. Alexa for Shopping’s multimodal architecture includes OCR (optical character recognition) that reads text embedded within your product images — the callouts in your infographics, the feature labels, the size charts, the ingredient panels visible on packaging, the certifications shown on graphics.
OCR-extracted text from images is treated as a supplementary data source alongside your listing copy and backend attributes. If your infographic image says “BPA-Free, 32oz, Dishwasher Safe” and that information also appears consistently in your bullet points, the AI has reinforced signal that these attributes are accurate and relevant. If your infographic includes claims that conflict with your copy, or includes important information that appears nowhere in your text-based listing, the AI’s confidence in surfacing your product for related queries can be affected.
Critical implication: text in your images should be consistent with and complementary to your listing copy, not duplicative and not contradictory. The infographic isn’t just for human readers — it’s a secondary data channel feeding the same AI system that reads your backend keywords.
The Intent-Matching Layer
After object detection and OCR, the AI performs intent alignment — comparing what it has understood about your product from all visual signals against the semantic meaning of the shopper’s query. This is where “keyword optimization” ends and “intent optimization” begins.
A shopper asking “what’s the best coffee maker for a small apartment” isn’t just asking about coffee makers. They’re asking about space constraints, possibly noise, convenience, and counter footprint. If your product images show your coffee maker on a tight counter in a compact kitchen setting, the AI has visual confirmation of the “small space” context. If all your images show it in a sprawling commercial kitchen, that context is absent — even if your title mentions “compact.”
This is the core insight behind modern Rufus-ready image strategy: your images need to visually answer the questions your best customers are asking, not just show your product looking attractive.
The Main Image: Still Non-Negotiable, Still Misunderstood
Nothing in the AI evolution changes the fundamentals of main image compliance. Amazon’s requirements are clear: pure white background (RGB 255, 255, 255), product filling at least 85% of the frame, no additional text or graphics, no props that aren’t included with the product, and no watermarks. These rules exist for multiple reasons, and AI-mediated shopping adds one more: the main image is often the only image shown in AI-generated recommendation cards and comparison surfaces.
Why Fill Matters More Than Ever
When Alexa for Shopping surfaces a comparison table across three competing products, it often pulls the main image into a small thumbnail format — sometimes at 150–200px wide on mobile. At that size, a product that fills 65% of the frame becomes nearly unidentifiable. A product that fills 90% of the frame remains recognizable and communicates confidence.
Product fill is also a proxy signal for listing quality. Amazon’s systems have extensive data correlating high fill rates with higher-quality listings and better-performing sellers. A main image at 85%+ fill doesn’t just look better to humans — it sits within a distribution of signals that the AI associates with well-maintained, trustworthy listings.
The Thumbnail-First Mental Model
Design your main image to work at 200px wide first, then scale up. If your product has a critical differentiator visible at scale (a unique form factor, a distinctive color, a specific configuration), it needs to be visible at thumbnail size. This is especially true in high-competition categories where Alexa for Shopping is comparing your product side-by-side with alternatives for the same query.
Test this practically: load your listing on a mobile device, screenshot the search results page, and zoom out until your main image is about the size of a postage stamp. Can you still identify the product category and its primary distinguishing feature? If not, your main image needs work.
Variant Differentiation in Main Images
If your ASIN has multiple variants (color, size, configuration), each variant’s main image needs to make the differentiation immediately obvious. The AI system serves variant-specific recommendations, meaning a shopper searching for a “navy blue laptop bag” should see a navy blue main image — not a black one with a color selection UI suggesting blue is available. Incorrect or misleading variant main images not only harm conversion; they confuse the AI’s product attribute mapping and can result in your product being served for the wrong queries.
Slots 2–4: The Answer Layer Where Rufus Finds Its Data
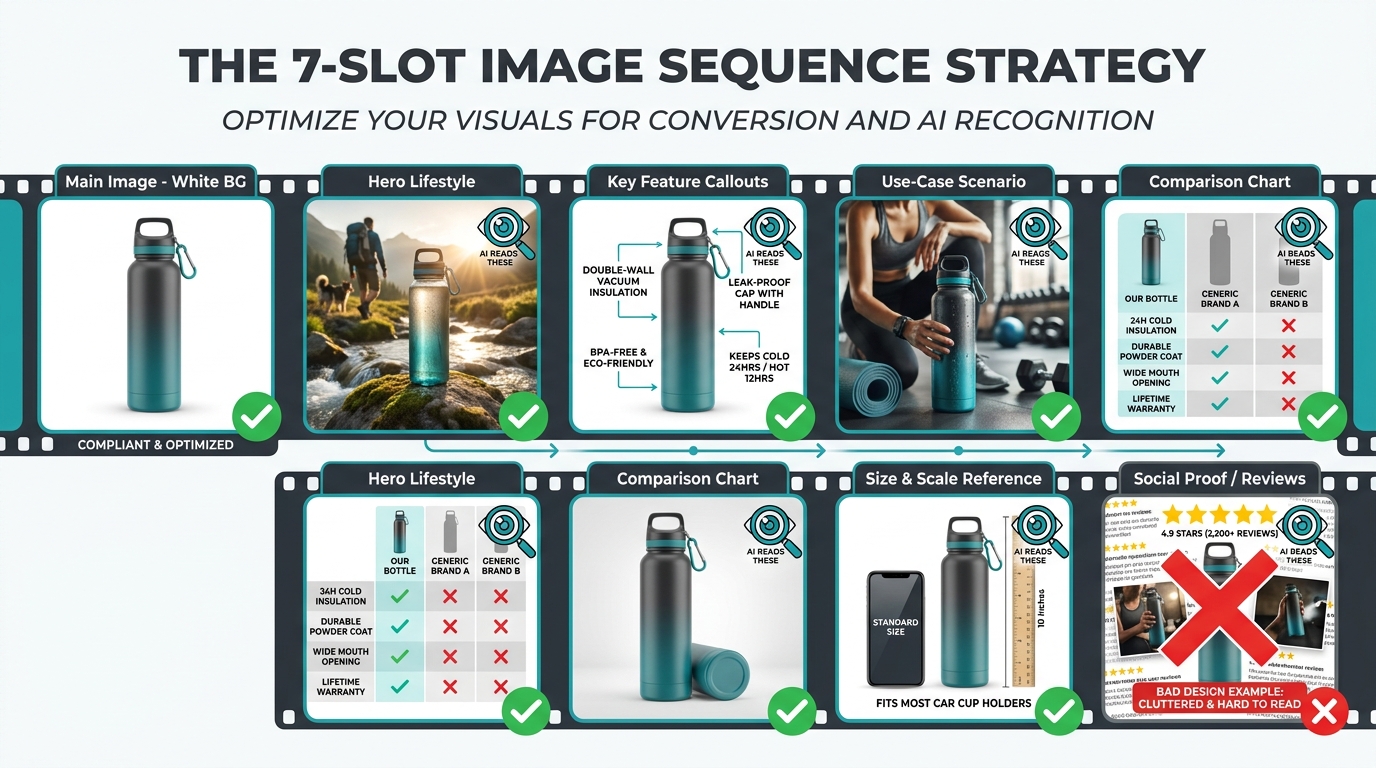
If the main image is your compliance baseline, slots 2 through 4 are your AI answer engine. This is where Alexa for Shopping extracts most of its useful product intelligence — the information it needs to generate accurate, confident answers to shopper questions. Sellers who treat these slots as a second main image (same white background, product from another angle) are leaving significant opportunity on the table.
Slot 2: The Hero Lifestyle Image
Slot 2 is typically the first image a mobile shopper sees after tapping through from search results, which makes it your highest-value persuasion real estate. It’s also the slot most scrutinized by the AI for scene context. The brief for a strong Slot 2 image in 2026: show your product in the most common high-intent use scenario, featuring the primary buyer persona, in an environment that the AI’s scene detection will correctly classify as relevant to likely search queries.
That last part deserves unpacking. If you sell a standing desk mat, your primary buyer is likely an office worker. But “standing desk mat” isn’t always the search query — searches like “anti-fatigue mat for home office,” “comfort mat for standing desk,” “mat for hardwood floor office” all map to the same product. A lifestyle image showing your mat in a clearly identifiable home-office setting, beneath a standing desk, with a person standing comfortably — and no competing visual noise — gives the AI’s scene-detection the environmental signals it needs to match your product to all of those query variants, not just the exact-match ones.
Slot 3: The Feature Callout Infographic
Slot 3 should be your primary infographic — the image that the AI’s OCR pipeline will mine for structured attribute data. Think of this as your backend keyword strategy expressed visually. The goal is to have text in this image that accurately represents your product’s key features, differentiators, and use-case attributes in language that maps to how shoppers search.
Design principles for an OCR-optimized infographic in 2026:
- Font size minimum 30px equivalent in the final rendered image. At the 2000px minimum resolution, this equates to text that is clearly legible at 100% zoom and survives JPEG compression without becoming muddy.
- High contrast text-to-background ratio. White text on pastel backgrounds, or grey text on white — both fail OCR confidence thresholds. Black or dark navy on white, or white on dark solid colors, reliably pass.
- Specific claims over generic ones. “Lasts up to 48 hours” is more useful to the AI (and to the shopper) than “long-lasting.” Numerics, certifications, and specific technical attributes give the AI facts to work with.
- No more than 5–7 callout points. Dense, paragraph-heavy infographics don’t give the OCR system clean, attribute-level data. Bullet points and isolated callouts extract far more cleanly than flowing text.
- Match your listing copy. Every claim in your Slot 3 infographic should appear somewhere in your bullet points or product description. Consistency reinforces the AI’s confidence in your product data.
Slot 4: Use-Case Scenario Image
If Slot 3 is about features, Slot 4 is about applications. The purpose of this image is to answer the class of query that starts with “for”: “for camping,” “for toddlers,” “for arthritis,” “for small dogs.” These intent modifiers are extremely common in conversational AI queries, and they’re addressed by scene context, not by feature lists.
A tactical approach that works well: identify the top 3–5 intent-modified searches driving traffic to your category (using Amazon’s own search term reports and third-party tools), then select the highest-volume use case for Slot 4. Show the product in use, in that context, with visual cues that the AI’s scene detection will confidently classify as that use case. An outdoor cooking product photographed next to a campfire has “camping” scene signals. The same product in a neutral studio has none.
Slots 5–7: Comparison, Scale, and Social Proof
The back half of your image set serves different functions depending on where shoppers are in their decision process — and serves a distinct purpose for Alexa for Shopping’s comparison-generation features.
Slot 5: The Comparison Image
Alexa for Shopping’s most visible feature is its comparison mode — when a shopper asks it to compare products, it generates a structured table drawing from each listing’s content. Your Slot 5 comparison image gives the AI a pre-built comparison frame to work with, and it helps human shoppers at the consideration stage make quicker decisions in your favor.
Effective comparison images in 2026 don’t compare your product to a vague “generic brand.” They compare specific configurations of your own product (size variations, feature tiers) or show your product stacked against clearly relevant alternatives with honest, data-backed differentiators. A comparison chart that shows “Our Product: 48hr battery vs. Industry Average: 8-12hr” is more defensible and more useful to the AI than a chart that cherry-picks meaningless metrics.
If your product genuinely leads on a measurable attribute, show that gap visually. A bar chart with labeled values is more AI-readable than a comparison table with icons and ambiguous ratings.
Slot 6: Size and Scale Reference Image
Returns on Amazon are disproportionately driven by size mismatch — shoppers receiving products that are larger or smaller than expected. A size reference image in Slot 6 serves two purposes: reducing return rates (which directly protects your listing health metrics), and giving the AI system a concrete scale attribute to work with when answering queries like “how big is this” or “will this fit in my bag.”
Best practice: show your product next to objects with universally understood scale (a human hand, a standard coffee mug, a regular-sized book). Avoid using objects that themselves require size interpretation (a decorative bowl, a non-standard household item). If your product has multiple size variants, a single image showing all variants side by side — with labeled dimensions — does significant work for both human shoppers and AI comparison features.
Slot 7: Social Proof Image
Slot 7 can serve several functions, but in 2026 the highest-performing use is a social proof image — one that reinforces trust through visual evidence. This can take several forms: a collage of real customer use-case photos (with appropriate permissions), a graphic highlighting your review count and rating, a before/after comparison where relevant, or a graphic showing certifications, safety test results, or awards your product has received.
Alexa for Shopping pulls review data directly when generating recommendations, so your star rating and review count are factors the AI already has. But a social proof image that reinforces this through visual format creates redundant signal — the AI’s OCR may extract “4.7 stars, 2,400 reviews” from the image text, adding it to the structured data layer from your review profile. Redundant confirmation of claims makes the AI more confident in recommending your product.
A+ Content as an Extended Image Strategy
Most sellers think of A+ Content as a separate section below the fold — useful for human browsers who scroll that far, but disconnected from the core image strategy. This is a mistake in 2026, because Alexa for Shopping reads your full product detail page, including A+ content, when building its understanding of your product.
How Alexa for Shopping Ingests A+ Content
A+ modules contain both structured image content and alt text — and the alt text on your A+ images is a critical, underused SEO and AI-readiness lever. Amazon allows brands to add alt text to every image in an A+ module. This text is indexed by Amazon and treated as a data signal by the AI. If your A+ hero module shows your product being used in a specific context, and the alt text explicitly describes that context in natural language, you’ve given the AI a clean, text-based description of the image that removes any ambiguity in scene detection.
Fill out every alt text field in your A+ content with descriptive, intent-aligned language. Not keyword stuffing — natural language descriptions of what’s in the image and what use case it represents. This 10-minute task per module can materially improve how accurately Alexa for Shopping represents your product in contextual queries.
The Copy-Visual Alignment Principle
Alexa for Shopping performs a form of cross-referencing: it looks for consistency between what your text says and what your images show. A listing that claims “ideal for outdoor use” but contains only indoor lifestyle images creates a discrepancy signal. A listing that claims “ultra-compact” but shows the product in a large, spacious environment contradicts its own copy visually.
Audit your A+ content with this lens: does every image in your A+ modules visually confirm a claim that appears somewhere in your listing copy? If yes, you have alignment. If any image introduces a context or claim that the rest of your listing doesn’t support, it creates noise in the AI’s product model — and noise reduces confidence, which reduces recommendation frequency.
Premium A+ Content: The Structured Data Opportunity
Sellers with Brand Registry access and sufficient review counts can access Premium A+ features, which include video, interactive comparison tables, and enhanced image carousels. In the context of Alexa for Shopping optimization, the interactive comparison table module deserves particular attention — it provides structured, table-formatted data that the AI can extract far more reliably than the same data presented in image format. If you’re choosing between adding another lifestyle image or building a well-structured comparison table in Premium A+, the table often generates more AI-extractable attribute data.

Mobile-First Image Design in an AI-Mediated World
The shift to mobile commerce isn’t new, but its intersection with AI-mediated discovery creates specific design constraints that sellers haven’t had to think about before. When Alexa for Shopping surfaces a product recommendation on mobile, the visual real estate is radically compressed compared to desktop — and the image has to do more work in less space.
The Mobile Image Stack: What Actually Renders
On the Amazon mobile app, a full-width product detail page image renders at roughly 390–430px wide on a standard iPhone screen. At that resolution, a 2000px infographic with 14pt equivalent text becomes completely illegible. Text that appears sharp and readable in your design software may not survive the compression and scaling that occurs in mobile delivery.
The practical design standard for 2026: use a minimum text size equivalent to 30pt in your 2000px source image, which scales to approximately readable 15pt at 390px wide after proportional reduction and JPEG compression. Test every infographic image at 400px wide before uploading — if the key callout text is unreadable at that width, the AI’s OCR will likely struggle with it too, since OCR systems perform better on higher-contrast, larger characters.
The Scroll-Stop Standard
In a standard mobile search results view, your main image appears at roughly 150–180px wide alongside a product title and price. The decision to tap through happens in a fraction of a second. Sellers who design main images for desktop viewing — with product labels, secondary objects, and environmental context visible at large size — often find their mobile CTR significantly lower than category benchmarks.
The “scroll-stop” standard for 2026: identify one visual element about your product that makes it distinct, and ensure that element is clearly visible at 150px wide. For commodity products, this might be a distinctive color. For feature-differentiated products, it’s the form factor that signals “this is different.” For premium products, it might be material quality suggested through surface texture. Design from that core visual element outward, not the reverse.
AI Recommendation Cards
When Alexa for Shopping generates a “here are the top products for your query” response, it shows a product card that typically includes the main image, title fragment, rating, and price. That card appears at roughly 120–150px wide on a standard mobile screen. Your main image needs to be immediately recognizable and contextually appropriate for the query at that size. This is why lifestyle main images — while visually appealing at large size — often underperform clean, high-fill white-background images in AI recommendation surfaces: they become visual noise at thumbnail scale.
AI-Generated vs. Studio Photography: Making the Right Call by Image Type
The availability of high-quality AI image generation tools has created a legitimate strategic choice for sellers: when does generative AI produce images that serve your Rufus-readiness goals, and when does it fall short of what studio photography delivers? The answer isn’t a blanket policy — it’s an image-type-by-image-type decision.
Where AI-Generated Imagery Performs Well
For lifestyle context images (Slots 2 and 4), generative AI has reached a point of quality and controllability where, for many product categories, it produces results that are indistinguishable from studio photography at Amazon’s rendering resolutions. The workflow advantage is speed: an AI-generated lifestyle set showing a product in five different environmental contexts — that would take days and thousands of dollars in studio time — can be produced in hours.
Critically for Alexa for Shopping optimization, AI-generated lifestyle images can be crafted to include highly specific scene signals. You can specify exactly the environment, the demographic signals in the background, the supporting objects visible in the scene — all calibrated to match the intent-modified search queries you’re targeting. This level of control is expensive and logistically complex with studio photography.
AI-generated backgrounds are also effective for showing product variants against contextually appropriate backdrops — a beige product variant shown in a neutral Scandinavian interior, a black variant shown in a modern dark kitchen. Variant-specific lifestyle images, prohibitively expensive to produce at scale with studio photography, become practical with generative AI tools.
Where Studio Photography Remains Essential
The main image is not a candidate for AI generation in 2026. Amazon’s compliance requirements — pure white background, accurate representation of the physical product — require that the product itself be photographed accurately. AI-generated product images consistently introduce subtle inaccuracies: slightly wrong proportions, altered color temperatures, incorrect label text, missing physical details. These inaccuracies can trigger customer expectation mismatches and return-rate spikes, and they can also create conflict with Amazon’s AI product attribute mapping.
Infographic images sit in a middle ground. The product itself in the infographic needs to be accurately photographed (or rendered from a verified 3D model of the actual product). The graphical overlay elements — callout bars, icons, backgrounds, text — are entirely appropriate to produce with design tools or AI assistance. A hybrid approach (accurate product photography + AI-generated/designed graphic treatment) gives you the accuracy of studio photography and the flexibility of digital design.
The Content Integrity Principle
Amazon’s AI image policy — which applies regardless of whether images were generated by AI or captured in a studio — requires that product images accurately represent the item a customer will receive. The enforcement risk isn’t primarily about the generation method; it’s about accuracy. AI-generated images that accurately represent the product and its use context are compliant. Studio images that misrepresent size, color, or features are not.
When using AI-generated lifestyle imagery, build a review step into your workflow: compare the final image against the actual physical product. Any discrepancy in color, texture, proportions, or visible details should be corrected before upload. This protects against both policy enforcement risk and customer experience issues that feed negatively into review metrics — which in turn feed into Alexa for Shopping’s product evaluation.
Category-Specific Playbooks: Where These Rules Matter Most
The principles above apply broadly, but their relative weight varies significantly by product category. Some categories have AI discovery dynamics that are fundamentally different from others, and image strategy should reflect those differences.
Home and Kitchen
This is the category where contextual scene detection matters most. Queries in home and kitchen are intensely use-case driven: “for small kitchens,” “fits in a drawer,” “works on induction,” “safe for dishwasher.” Your Slot 4 use-case image and Slot 6 size reference image carry disproportionate weight here.
Prioritize showing your product installed or in use in a realistic home environment — a real-looking kitchen or living space, not a commercial staging environment. If your product has specific compatibility requirements (stovetop type, counter dimensions, cabinet clearance), include a simple graphic that communicates this clearly. Returns in this category are heavily driven by fit and compatibility mismatches, and images that preemptively answer these questions reduce returns and improve the review metrics that Alexa for Shopping factors into recommendations.
Health, Beauty, and Personal Care
AI queries in this category lean heavily on outcome and ingredient claims. “Fragrance-free,” “for sensitive skin,” “dermatologist tested,” “paraben-free” — these are the intent modifiers that dominate. Your Slot 3 infographic should prominently feature certifications, key ingredient callouts, and clinical or testing data.
Before/after imagery, where applicable and supported by real data, performs strongly in this category both for human shoppers at the consideration stage and for the AI’s claim-verification process. Be precise: a claim of “clinically tested” with no supporting detail is less useful to the AI than “tested by 200 dermatologists, 94% saw improvement in 4 weeks.” The more specific the claim, the more the AI can confidently use it to answer relevant shopper queries.
Sports and Outdoors
Environmental scene detection is the dominant factor here. Queries like “for trail running,” “for ocean kayaking,” “for below-zero camping” are best addressed by lifestyle images shot (or generated with very specific prompting) in clearly identifiable natural environments. The AI’s scene detection models are well-calibrated for outdoor environments — forest vs. desert vs. ocean vs. mountain snow are reliably distinguished.
Durability, weather resistance, and performance specifications are key attributes for this category’s AI queries. Your Slot 3 infographic should address these explicitly, with specific metrics where available (waterproofing rating, temperature range, weight capacity).
Electronics and Tech Accessories
Compatibility is the dominant driver of returns and query intent in electronics. “Compatible with iPhone 16,” “works with Samsung Galaxy,” “for USB-C MacBook” — these queries require your images to clearly communicate compatibility. A Slot 3 infographic that shows compatibility icons for the relevant device ecosystem your product supports — and explicitly lists model numbers or device generations — does critical work for both human shoppers and AI matching.
Technical specification infographics perform strongly in this category. Shoppers and the AI both respond well to specs presented cleanly: battery life, range, data transfer speed, frequency range. The specificity signals product quality and gives the AI precise numerical attributes to work with in comparison queries.
Measuring Rufus-Readiness: The Signals That Tell You Where You Stand
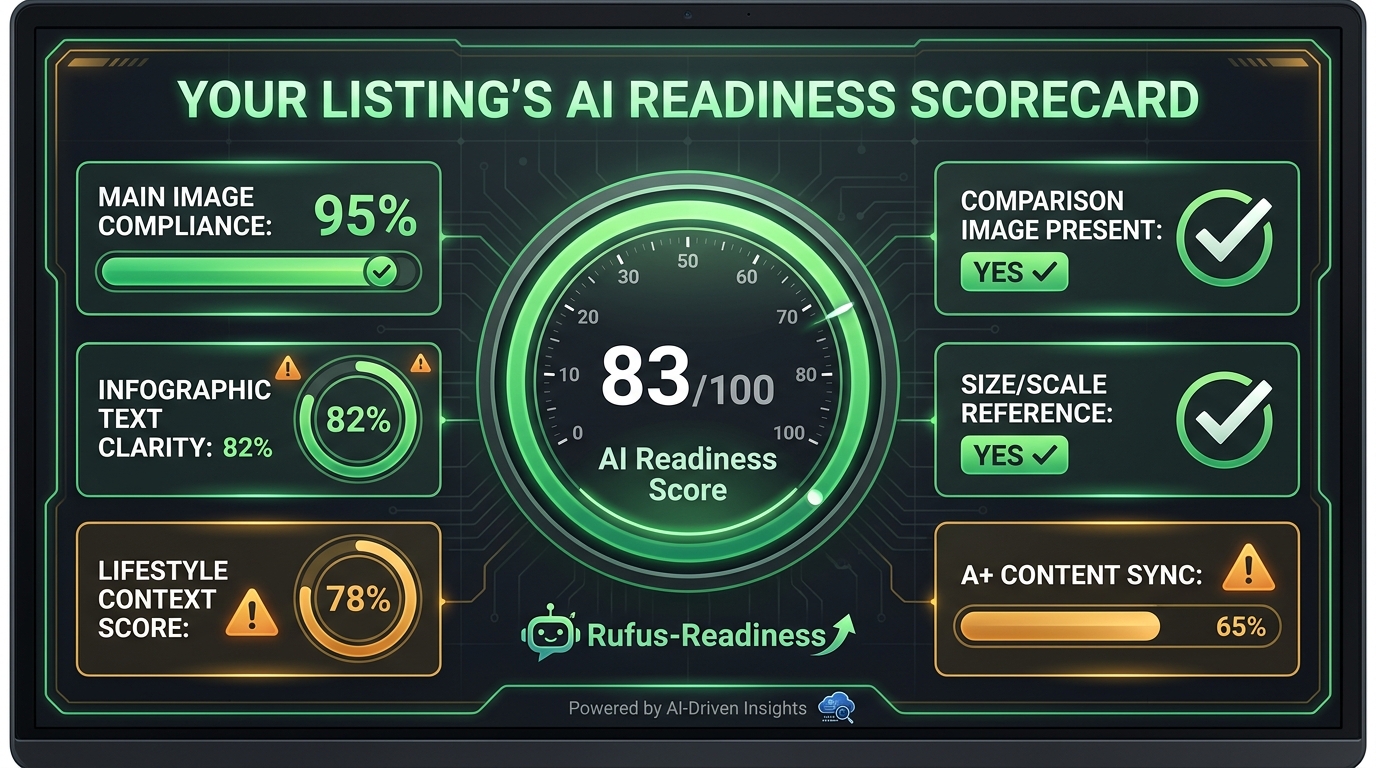
Building Rufus-ready images is a process, not a one-time event. The only way to know whether your image strategy is working is to track the metrics that reflect AI-mediated discovery performance, and to iterate based on what the data shows.
Conversion Rate vs. Category Benchmark
Amazon provides your listing conversion rate through Seller Central’s business reports. The most useful benchmark is your conversion rate relative to your category average — which Amazon also surfaces through some business intelligence tools and which third-party tools like Jungle Scout and Helium 10 approximate from their data. If your conversion rate sits below category average with adequate pricing and review metrics, your images are the most likely variable to investigate first.
Track conversion rate changes after each image update. Image changes that produce measurable CVR improvements within 2–3 weeks are strong signal that the change addressed a real gap. Changes that move the needle less than 0.5% are likely within normal variation and don’t provide clear signal either way — you need longer test windows or larger traffic volumes to draw conclusions.
Click-Through Rate from Search
CTR from search results is primarily a main image metric — it reflects how often shoppers choose to click your listing when they see it among search results. A CTR below the category average with a strong main image may indicate a title or pricing issue, but a CTR below average with a weak main image is almost always an image problem. Track CTR through Amazon’s Search Term Performance report or advertising console data (which gives CTR at the keyword level).
Return Rate and Reason Codes
Seller Central’s returns report shows return reasons at the ASIN level. Returns coded as “item not as described,” “wrong size,” or “product did not match description” are almost always preventable with better images — specifically the scale reference image (Slot 6) and the feature callout infographic (Slot 3). If more than 3–4% of your returns cite description mismatches, your image set has a gap between what it implies and what the product delivers.
This matters for Alexa for Shopping beyond the obvious operational cost: high return rates are a listing health signal that Amazon’s algorithm factors into both organic ranking and recommendation eligibility. Improving images to reduce returns has a compounding effect — better customer experience drives better reviews, which drives higher recommendation frequency from the AI.
Search Query Performance Report
Amazon’s Search Query Performance Report (available in the Brand Analytics section of Seller Central for Brand Registered sellers) shows how your ASIN performs for specific search queries — including impression share, click share, and purchase share. If you’re getting impression share but low click share on important queries, your main image is the primary culprit. If you’re getting click share but low purchase share, your supporting images (particularly the feature callout and comparison images) aren’t converting consideration into purchase.
Map your top 20 converting search queries against the use cases represented in your image set. If high-traffic queries are intent-modified (“for X,” “best for Y”) and your images don’t contain visual scene signals for those contexts, you’ve identified a direct image strategy gap to address.
Common Image Mistakes That Kill AI Visibility
Before closing, it’s worth cataloging the most common image mistakes that specifically undermine Alexa for Shopping performance — because several of these are counterintuitive and still prevalent even in otherwise well-optimized listings.
Over-Designed Infographics
More design elements don’t equal more information extracted by the AI. Dense infographics with overlapping graphics, multiple font sizes, decorative flourishes, and low-contrast color schemes produce images that look impressive in design review but perform poorly in OCR extraction. The AI extracts a fraction of what’s visually present in a cluttered infographic. Simplify to the 5–7 most important attributes, present each one cleanly, and trust that clarity outperforms complexity every time.
Watermarks and Brand Logos on Supporting Images
Large watermarks and brand logos in corners of lifestyle images don’t affect human shoppers significantly — the eye adapts to and ignores them. But they do add visual noise that can interfere with the AI’s scene-detection confidence. More concretely, heavy logo placement can trigger Amazon’s image compliance review systems, which adds risk without adding meaningful value to either human shoppers or the AI’s product model.
Disconnected Image Sets
An image set that feels like seven different photoshoots creates a coherence problem for the AI. If your Slot 1 shows a product in glossy black, your Slot 2 lifestyle image shows a grey version, and your Slot 3 infographic shows a white version — the AI’s product model gets conflicting color attribute signals, potentially reducing confidence in any single color variant query match. Keep image sets visually consistent: same product color/variant throughout, consistent lighting treatment, coherent environmental palette across lifestyle shots.
Claims in Images With No Copy Support
If your infographic image claims “hypoallergenic” or “pediatrician approved” and these terms appear nowhere in your listing copy or backend attributes, the AI faces a discrepancy: the image data says one thing, the text data says another. The conservative outcome is that the AI deprioritizes the attribute when deciding whether your product is relevant to queries using those terms. The riskier outcome is that Amazon’s compliance systems flag the unsubstantiated visual claim during a catalog review.
Ignoring Slots 5–7
A remarkable number of sellers still upload only 3–4 images per ASIN, leaving Slots 5–7 empty or populated with redundant views that add no new information. For Alexa for Shopping, an incomplete image set is a signal about listing quality — a well-maintained, competitive listing fills all available slots with purposeful content. Beyond the AI signal, Slots 5–7 serve real human shoppers at the consideration and decision stages. A comparison image in Slot 5 addresses the shopper who opened three tabs to compare products. A scale image in Slot 6 addresses the shopper about to abandon because they’re not sure it’ll fit. These late-funnel images convert shoppers who would otherwise leave.
Building Your Rufus-Ready Image Audit: A Practical Starting Point
The gap between understanding Rufus-ready image strategy and acting on it tends to be a prioritization problem. A catalog of 200 ASINs can’t all be re-imaged simultaneously. The right approach is a tiered audit that focuses your resources on the highest-impact opportunities first.
Tier 1: High-Traffic, Below-Benchmark CVR
Start with the ASINs that have the most traffic but convert below your category average. These listings are generating impressions — Alexa for Shopping or organic search is already serving them — but failing to convert. This is typically an image problem at the supporting image level (Slots 2–7). Run an audit of each Slot 2–4 image against the query intent driving traffic: does each image visually answer what the top converting queries are asking? If not, this is your first re-image priority.
Tier 2: High-Volume, Main-Image CTR Issue
Use your Search Query Performance data to identify ASINs with high impression share but low click share. This is a main image and title issue. Re-photograph the main image with higher fill, cleaner isolation, and verify the product color is rendered accurately. Thumbnail-test the new image before uploading.
Tier 3: Complete Image Sets for All ASINs
After addressing Tiers 1 and 2, build out complete 7-image sets for any ASIN that currently has fewer than 6 images. The incremental lift from a complete image set — with each slot serving its specific function — is consistent enough across categories that this is a reliable optimization even for lower-traffic ASINs. Use AI-generated lifestyle imagery to make this economically feasible at scale.
The Longer Trajectory: Where Alexa for Shopping Goes Next
Image strategy for AI-mediated discovery isn’t a problem you solve once and set aside. Alexa for Shopping is evolving actively, and the image requirements of 2026 will be the baseline of 2027. Several developments on Amazon’s roadmap suggest where this goes next.
Visual search is expanding. Amazon’s “Search with Your Camera” feature — which lets shoppers photograph a real-world object and find matching products — is seeing increased integration with Alexa for Shopping. This means your main image needs to work not just as the product you’re selling, but as a visual reference that matches real-world objects shoppers might photograph. For product categories where design mimicry is common (furniture, home decor, accessories), this creates both a protection argument for unique visual identity and a discovery argument for images that match common real-world reference objects.
Video is becoming an AI-readable signal. Amazon has been building video indexing capabilities into its product discovery infrastructure, and Alexa for Shopping will increasingly extract information from product videos in the same way it currently processes images. The sellers who establish strong video content now — with clear, feature-demonstrating, voice-narrated product videos — will have a head start when video indexing becomes a material ranking signal in the AI’s product model.
Personalization will deepen. As Alexa for Shopping accumulates more behavioral data across its user base, product recommendations will become more individualized. This creates an argument for image sets that address multiple buyer personas rather than optimizing for a single target customer. Diverse use-case images, diverse lifestyle contexts, and diverse demographic signals across your full 7-image set maximizes the surface area over which the AI can match your product to individual shoppers’ intent signals.
Conclusion: Images as Structured Data, Not Just Visual Assets
The fundamental shift this article has been building toward is this: in 2026, your Amazon product images are no longer primarily visual persuasion tools. They are structured data inputs feeding a multimodal AI system that determines when, how, and to whom your product gets recommended. The distinction matters practically because it changes how you evaluate an image’s success.
A beautiful lifestyle image that doesn’t contain readable text, doesn’t communicate a specific use-case context through scene signals, and doesn’t connect to the intent-modified queries driving your category traffic is failing at its primary job — even if it performs well in human user testing. The new standard is an image that works for both audiences simultaneously: the human shopper who browses and the AI layer that pre-screens and recommends.
The playbook is actionable. Audit your current image sets against the slot-by-slot framework. Test your infographics at 400px wide for OCR-readability. Align image claims with listing copy. Build the use-case context images that match your highest-value intent-modified queries. Fill all seven slots with purposeful, distinct content. Track conversion rate, CTR, and return reason codes after each change.
Sellers who treat this as a systematic, iterative process — rather than a one-time creative exercise — will build a compounding advantage in AI-mediated discovery. The gap between Rufus-ready listings and everything else is already visible in conversion data. As Alexa for Shopping’s footprint grows toward serving the majority of Amazon’s mobile shopping queries, that gap will widen.
Key Takeaways: Alexa for Shopping (formerly Rufus) uses computer vision and OCR to extract structured data from your product images. Design for the AI’s reading layer first — OCR-optimized infographics, scene-specific lifestyle images, copy-consistent claims — and you’ll simultaneously improve human shopper conversion. The 7-slot image sequence should function as an answer engine: each slot addressing a specific question your target shoppers are asking.
Leave a Reply